Housing density: 749 houses/condos per square mile
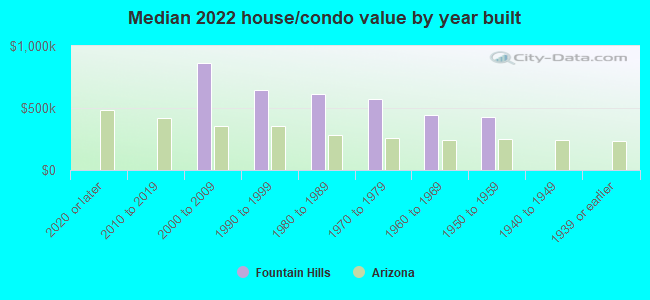
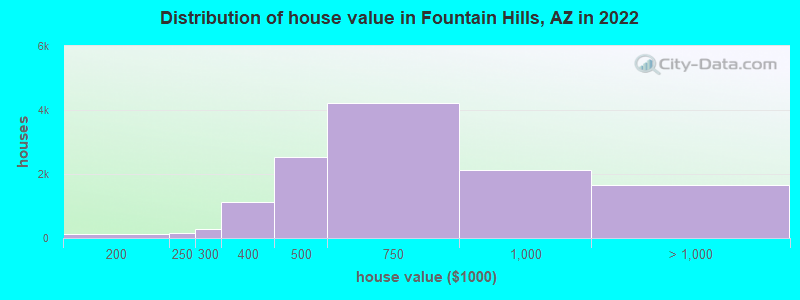
Median price asked for vacant for-sale houses and condos in 2022: $499,787.
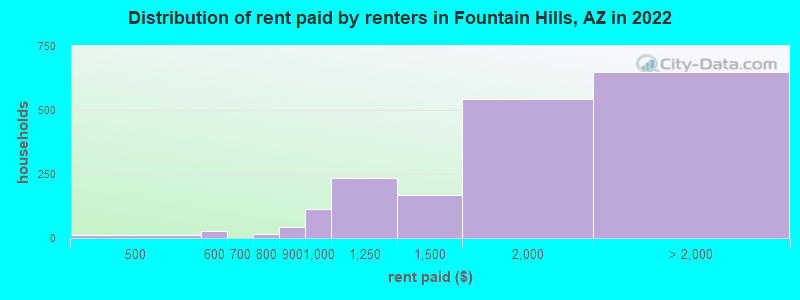
Median contract rent in 2022: $1,583 (lower quartile is $1,146, upper quartile is over $2,000)
Median rent asked for vacant for-rent units in 2022: $5,801
Median gross rent in Fountain Hills, AZ in 2022: $1,828
Housing units in Fountain Hills with a mortgage: 5,672 (487 second mortgage, 7 home equity loan, 423 both second mortgage and home equity loan) Houses without a mortgage: 54
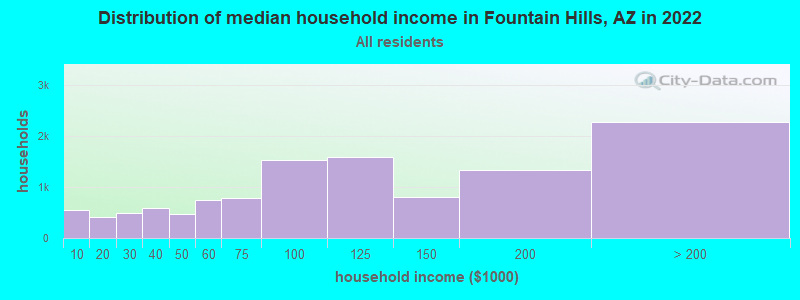
Median household income for houses/condos with a mortgage: $118,326
Median household income for apartments without a mortgage: $92,317
Median monthly housing costs: $1,456
Compare current foreclosures near Fountain Hills, AZ:
Size of family households: 5,422 2-persons, 1,145 3-persons, 660 4-persons, 299 5-persons, 83 6-persons, 45 7-or-more-persons.
Size of nonfamily households: 3,328 1-person, 447 2-persons, 15 3-persons.
1,840 married couples with children.
595 single-parent households (323 men, 272 women).
92.8% of residents of Fountain Hills speak English at home.
1.8% of residents speak Spanish at home (76% speak English very well, 3% speak English well, 22% speak English not well).
4.6% of residents speak other Indo-European language at home (82% speak English very well, 15% speak English well, 2% speak English not well).
1.1% of residents speak Asian or Pacific Island language at home (75% speak English very well, 17% speak English well, 8% speak English not well).
0.1% of residents speak other language at home (100% speak English very well).
Foreign born population: 1,958 (8.0%)
(76.5% of them are naturalized citizens)
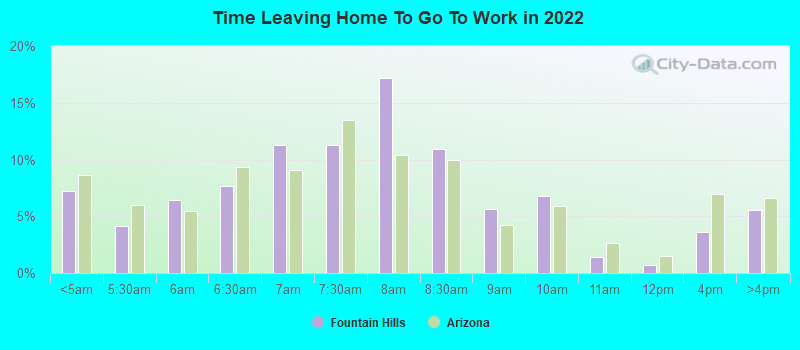
Percentage of workers working in this county: 96.5% Number of people working at home: 4,027 (36.8% of all workers)
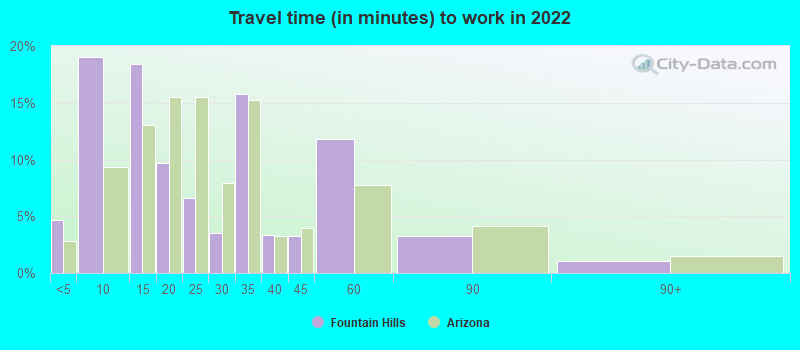
Travel time to work (commute)
Less than 5 minutes: 163
5 to 9 minutes: 849
10 to 14 minutes: 1,015
15 to 19 minutes: 630
20 to 24 minutes: 791
25 to 29 minutes: 635
30 to 34 minutes: 1,192
35 to 39 minutes: 639
40 to 44 minutes: 422
45 to 59 minutes: 691
60 to 89 minutes: 223
90 or more minutes: 158
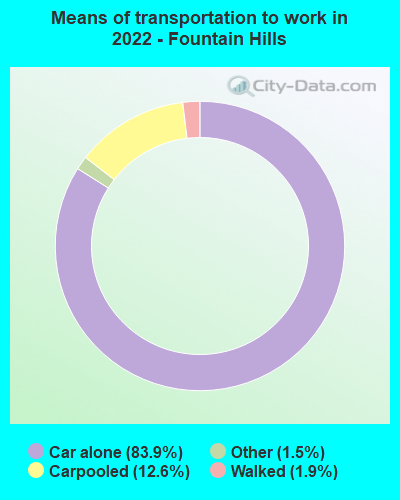
Means of transportation to work:
Drove a car alone: 3,847 (48.6%)
Carpooled: 618 (7.8%)
Taxi: 86 (1.1%)
Walked: 94 (1.2%)
Worked at home: 4,027 (50.9%)
Unemployment by race in 2022
Unemployment rate for White non-Hispanic residents
3.2%Males
5.0%Females
Unemployment rate for other race residents
24.7%Males
Unemployment rate for two or more race residents
19.7%Females
Unemployment rate for Hispanic or Latino residents
4.7%Males
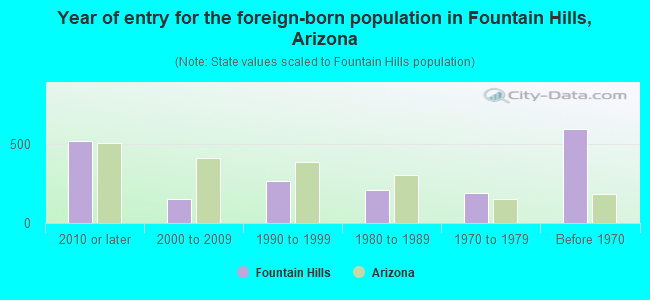
Year of entry for the foreign-born population in Fountain Hills, Arizona
5222010 or later
1542000 to 2009
2701990 to 1999
2081980 to 1989
1941970 to 1979
598Before 1970
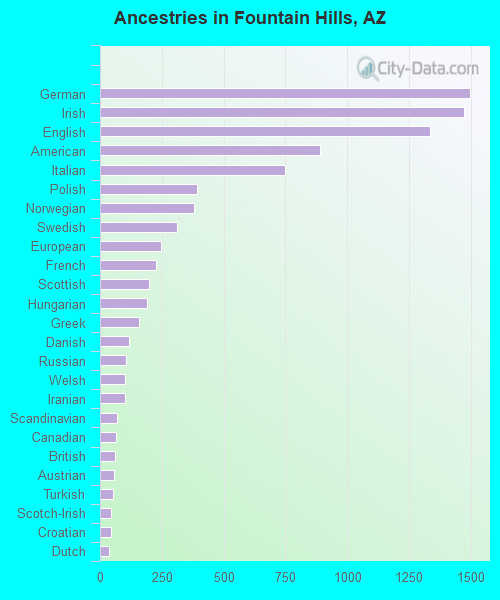
First ancestries reported:
German: 1,499 (13.9%)
Irish: 1,472 (13.7%)
English: 1,337 (12.4%)
American: 891 (8.3%)
Italian: 749 (7.0%)
Polish: 392 (3.6%)
Norwegian: 379 (3.5%)
Swedish: 312 (2.9%)
European: 246 (2.3%)
French: 228 (2.1%)
Scottish: 199 (1.9%)
Hungarian: 191 (1.8%)
Greek: 156 (1.5%)
Danish: 117 (1.1%)
Russian: 105 (1.0%)
Welsh: 102 (0.9%)
Iranian: 101 (0.9%)
Scandinavian: 68 (0.6%)
Canadian: 64 (0.6%)
British: 59 (0.5%)
Austrian: 58 (0.5%)
Turkish: 51 (0.5%)
Scotch-Irish: 45 (0.4%)
Croatian: 45 (0.4%)
Dutch: 38 (0.4%)
French Canadian: 35 (0.3%)
Pennsylvania German: 34 (0.3%)
Portuguese: 31 (0.3%)
Czech: 27 (0.3%)
Northern European: 26 (0.2%)
Lithuanian: 26 (0.2%)
Slovak: 20 (0.2%)
Moroccan: 15 (0.1%)
Brazilian: 15 (0.1%)
Ukrainian: 14 (0.1%)
Finnish: 13 (0.1%)
Slovene: 12 (0.1%)
Eastern European: 11 (0.1%)
Bulgarian: 11 (0.1%)
Yugoslavian: 10 (0.09%)
Lebanese: 10 (0.09%)
West Indian: 10 (0.09%)
Czechoslovakian: 8 (0.07%)
Serbian: 8 (0.07%)
Albanian: 8 (0.07%)
Swiss: 8 (0.07%)
Belgian: 7 (0.07%)
Most common places of birth for foreign-born residents (%):
Canada
Fountain Hills:
22.6% (443)
Arizona:
4.3% (40,102)
France
Fountain Hills:
15.3% (299)
Arizona:
0.4% (3,628)
Mexico
Fountain Hills:
5.1% (99)
Arizona:
53.4% (500,086)
Poland
Fountain Hills:
4.9% (95)
Arizona:
0.5% (5,025)
England
Fountain Hills:
4.2% (82)
Arizona:
1.1% (9,889)
Philippines
Fountain Hills:
3.9% (76)
Arizona:
3.2% (30,378)
Germany
Fountain Hills:
3.7% (72)
Arizona:
1.5% (14,058)
Korea
Fountain Hills:
3.6% (71)
Arizona:
1.2% (11,275)
Scotland
Fountain Hills:
3.5% (69)
Arizona:
0.1% (1,279)
Other Eastern Europe
Fountain Hills:
2.9% (57)
Arizona:
0.3% (2,524)
Vietnam
Fountain Hills:
2.8% (54)
Arizona:
2.1% (19,199)
Russia
Fountain Hills:
2.5% (49)
Arizona:
0.4% (3,763)
Greece
Fountain Hills:
2.0% (39)
Arizona:
0.1% (1,080)
Ethiopia
Fountain Hills:
1.8% (35)
Arizona:
0.4% (3,880)
Kazakhstan
Fountain Hills:
1.6% (32)
Arizona:
0.0% (433)
India
Fountain Hills:
1.6% (31)
Arizona:
4.5% (41,719)
Turkey
Fountain Hills:
1.5% (30)
Arizona:
0.2% (1,702)
Place of birth for U.S.-born residents:
This state: 3,555
Other state: 18,553
Northeast: 3,460
Midwest: 8,190
South: 2,463
West: 4,271
89.0% of Fountain Hills residents lived in the same house 1 years ago. Out of people who lived in different houses, 30.3% lived in this county. Out of people who lived in different counties, 4.5% lived in Arizona.
Fountain Hills:
89.0%
State average:
86.0%
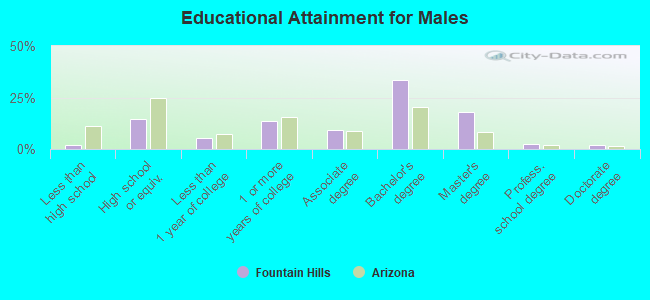
Education attainment for males 25 years and older:
No schooling: 34
Nursery to 4th grade: 56
5th and 6th grade: 0
7th and 8th grade: 25
9th grade: 0
10th grade: 9
11th grade: 0
12th grade, no diploma: 53
High school graduate (or equivalency): 1,491
Less than 1 year of college: 574
Some college more than 1 year, no degree: 1,432
Associate degree: 945
Bachelor's degree: 3,483
Master's degree: 1,840
Professional school degree: 232
Doctorate degree: 205
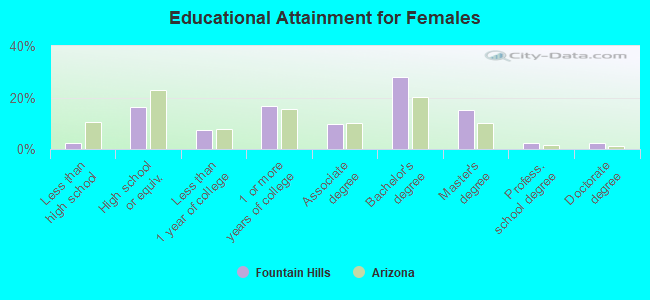
Education attainment for females 25 years and older:
No schooling: 73
Nursery to 4th grade: 18
5th and 6th grade: 0
7th and 8th grade: 37
9th grade: 0
10th grade: 85
11th grade: 22
12th grade, no diploma: 27
High school graduate (or equivalency): 1,723
Less than 1 year of college: 779
Some college more than 1 year, no degree: 1,759
Associate degree: 1,004
Bachelor's degree: 2,929
Master's degree: 1,580
Professional school degree: 236
Doctorate degree: 246
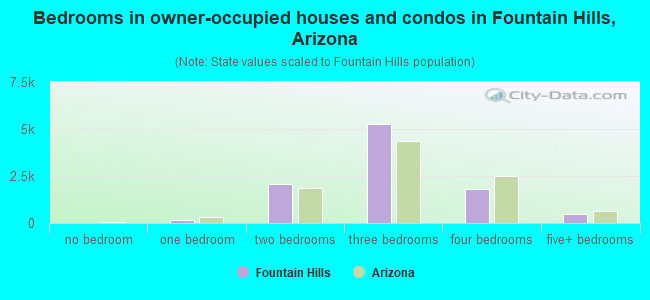
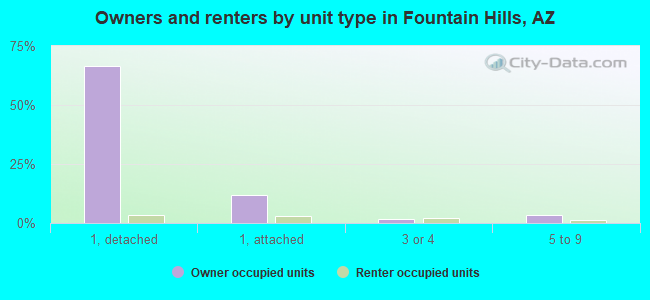
Housing units in structures:
One, detached: 8,951
One, attached: 2,263
Two: 204
3 or 4: 891
5 to 9: 622
10 to 19: 238
20 to 49: 88
50 or more: 347
Housing units lacking complete plumbing facilities in 2022: 0.4%
Housing units lacking complete kitchen facilities in 2022: 0.5%