Fort Smith, AR (Arkansas) Houses and Residents
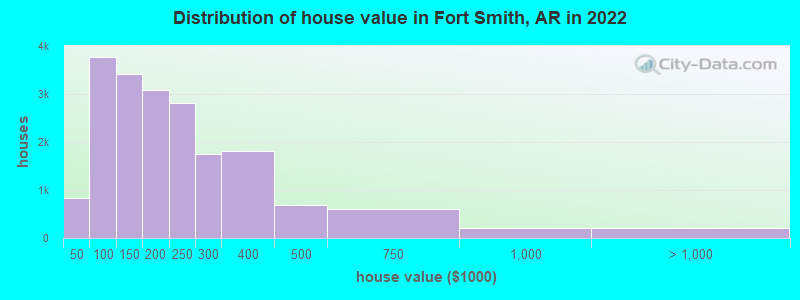
Estimated median house or condo value in 2022: $174,800 (it was $72,900 in 2000 )
Fort Smith:
$174,800Arkansas:
$179,800
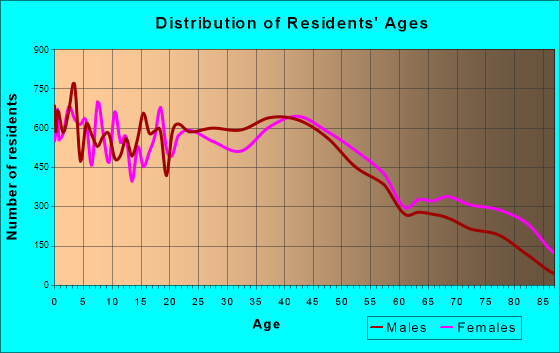
Lower value quartile - upper value quartile: $105,100 - $265,400Total population: 87,351 (Urban population: 79,874, Rural population: 540 (all nonfarm) )
Houses: 40,825 (36,587 occupied: 18,919 owner occupied, 17,668 renter occupied )
% of renters here:
48%State:
34%
Housing density: 811 houses/condos per square mile
Median price asked for vacant for-sale houses and condos in 2022: $186,310.
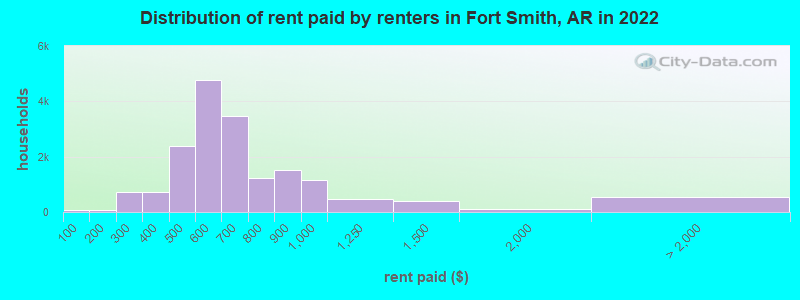
Median contract rent in 2022: $598 (lower quartile is $509, upper quartile is $750)
Median rent asked for vacant for-rent units in 2022: $1,589
Median gross rent in Fort Smith, AR in 2022: $761
Housing units in Fort Smith with a mortgage: 10,660 (731 second mortgage, 0 home equity loan, 682 both second mortgage and home equity loan )Houses without a mortgage: 96
Median household income for houses/condos with a mortgage: $72,333
Median household income for apartments without a mortgage: $54,707
Median monthly housing costs: $766
Data:
Median house or condo value ($)
Median house or condo value ($ change since 2000)
Median house or condo value ($) - White
Median house or condo value ($) - Black or African American
Median house or condo value ($) - Asian
Median house or condo value ($) - Hispanic or Latino
Median house or condo value ($) - American Indian and Alaska Native
Median house or condo value ($) - Multirace
Median house or condo value ($) - Other Race
Median price asked for mobile homes ($)
Household density (households per square mile)
Mean house or condo value by units in structure - 1, detached ($)
Mean house or condo value by units in structure - 1, attached ($)
Mean house or condo value by units in structure - 2 ($)
Mean house or condo value by units in structure by units in structure - 3 or 4 ($)
Mean house or condo value by units in structure - 5 or more ($)
Mean house or condo value by units in structure - Boat, RV, van, etc. ($)
Mean house or condo value by units in structure - Mobile home ($)
Median contract rent ($)
Median contract rent - Lower quartile ($)
Median contract rent - Upper quartile ($)
Median gross rent ($)
Urban houses (%)
Rural houses (%)
Houses occupied (%)
Houses occupied (% change since 2000)
Houses owner occupied (%)
Houses owner occupied (% change since 2000)
Houses renter occupied (%)
Houses renter occupied (% change since 2000)
Vacant housing units - For rent (%)
Vacant housing units - For rent (% change since 2000)
Vacant housing units - For sale only (%)
Vacant housing units - For sale only (% change since 2000)
Vacant housing units - Rented or sold, not occupied (%)
Vacant housing units - Rented or sold, not occupied (% change since 2000)
Vacant housing units - For seasonal, recreational, or occasional use (%)
Vacant housing units - For seasonal, recreational, or occasional use (% change since 2000)
Vacant housing units - For migrant workers (%)
Vacant housing units - For migrant workers (% change since 2000)
Vacant housing units - Other vacant (%)
Vacant housing units - Other vacant (% change since 2000)
Median monthly housing costs ($)
Median household income for houses/condos with a mortgage ($)
Median household income for houses/condos without a mortgage ($)
Median household income ($)
Median household income ($) - White
Median household income ($) - Black or African American
Median household income ($) - Asian
Median household income ($) - Hispanic or Latino
Median household income ($) - American Indian and Alaska Native
Median household income ($) - Multirace
Median household income ($) - Other Race
Mortgage status - with mortgage (%)
Mortgage status - with second mortgage (%)
Mortgage status - with home equity loan (%)
Mortgage status - with both second mortgage and home equity loan (%)
Mortgage status - without a mortgage (%)
Median year house/condo built
Median year apartment built
Household type by relationship - Male householder living alone (%)
Household type by relationship - Male householder not living alone (%)
Household type by relationship - Female householder living alone (%)
Household type by relationship - Female householder not living alone (%)
Household type by relationship - Opposite-Sex spouse (%)
Household type by relationship - Same-Sex spouse (%)
Household type by relationship - Opposite-Sex unmarried partner (%)
Household type by relationship - Same-Sex unmarried partner (%)
Household type by relationship - In group quarters (%)
Size of family households - 2-person household (%)
Size of family households - 3-person household (%)
Size of family households - 4-person household (%)
Size of family households - 5-person household (%)
Size of family households - 6-person household (%)
Size of family households - 7-or-more-person household (%)
Size of nonfamily households - 1-person household (%)
Size of nonfamily households - 2-person household (%)
Size of nonfamily households - 3-person household (%)
Size of nonfamily households - 4-person household (%)
Size of nonfamily households - 5-person household (%)
Size of nonfamily households - 6-person household (%)
Size of nonfamily households - 7-or-moreperson household (%)
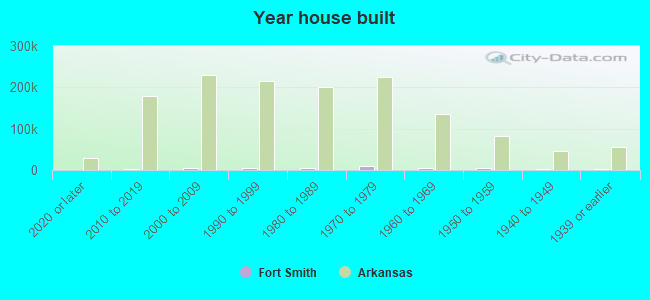
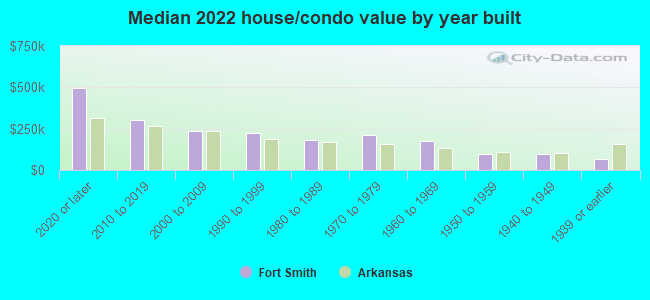
Year house built - Built 2010 or later (%)
Year house built - Built 2000 to 2009 (%)
Year house built - Built 1990 to 1999 (%)
Year house built - Built 1980 to 1989 (%)
Year house built - Built 1970 to 1979 (%)
Year house built - Built 1960 to 1969 (%)
Year house built - Built 1950 to 1959 (%)
Year house built - Built 1940 to 1949 (%)
Year house built - Built 1939 or earlier (%)
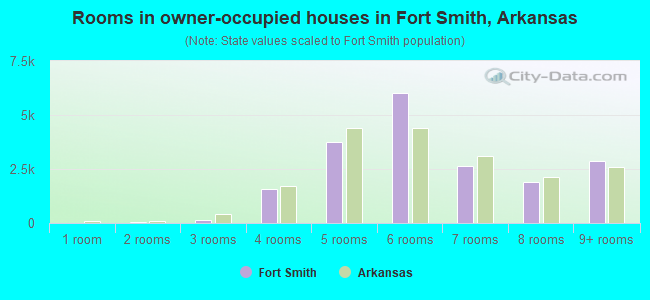
Median number of rooms in houses and condos
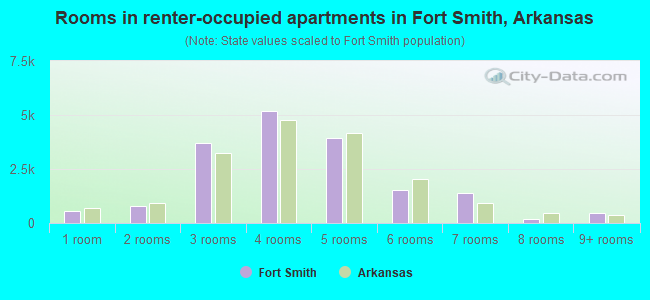
Median number of rooms in apartments
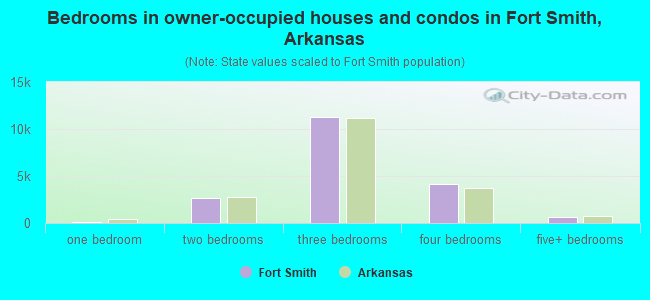
Median number of bedrooms in owner occupied houses
Mean number of bedrooms in owner occupied houses
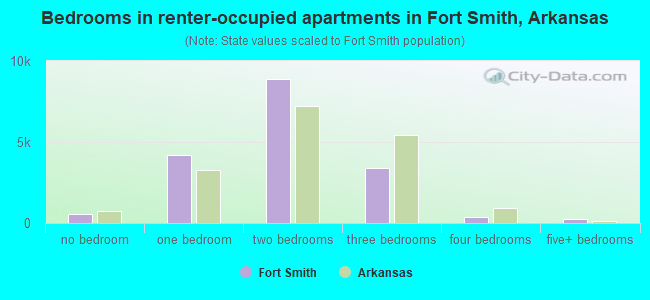
Median number of bedrooms in renter occupied houses
Mean number of bedrooms in renter occupied houses
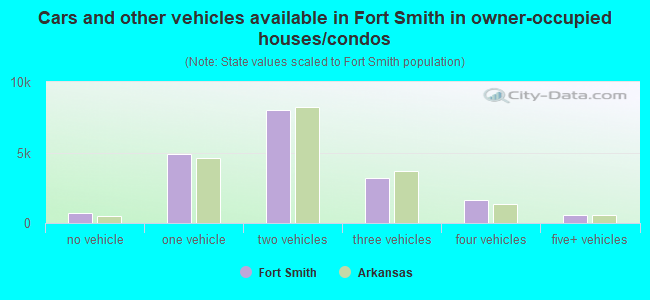
Median number of vehichles in owner occupied houses
Mean number of vehichles in owner occupied houses
Median number of vehichles in renter occupied houses
Mean number of vehichles in renter occupied houses
Rooms in owner-occupied houses - 1 room (%)
Rooms in owner-occupied houses - 2 rooms (%)
Rooms in owner-occupied houses - 3 rooms (%)
Rooms in owner-occupied houses - 4 rooms (%)
Rooms in owner-occupied houses - 5 rooms (%)
Rooms in owner-occupied houses - 6 rooms (%)
Rooms in owner-occupied houses - 7 rooms (%)
Rooms in owner-occupied houses - 8 rooms (%)
Rooms in owner-occupied houses - 9+ rooms (%)
Rooms in renter-occupied houses - 1 room (%)
Rooms in renter-occupied houses - 2 rooms (%)
Rooms in renter-occupied houses - 3 rooms (%)
Rooms in renter-occupied houses - 4 rooms (%)
Rooms in renter-occupied houses - 5 rooms (%)
Rooms in renter-occupied houses - 6 rooms (%)
Rooms in renter-occupied houses - 7 rooms (%)
Rooms in renter-occupied houses - 8 rooms (%)
Rooms in renter-occupied houses - 9+ rooms (%)
Bedrooms in owner-occupied houses - no bedrooms (%)
Bedrooms in owner-occupied houses - 1 bedroom (%)
Bedrooms in owner-occupied houses - 2 bedrooms (%)
Bedrooms in owner-occupied houses - 3 bedrooms (%)
Bedrooms in owner-occupied houses - 4 bedrooms (%)
Bedrooms in owner-occupied houses - 5+ bedrooms (%)
Bedrooms in renter-occupied houses - no bedrooms (%)
Bedrooms in renter-occupied houses - 1 bedroom (%)
Bedrooms in renter-occupied houses - 2 bedrooms (%)
Bedrooms in renter-occupied houses - 3 bedrooms (%)
Bedrooms in renter-occupied houses - 4 bedrooms (%)
Bedrooms in renter-occupied houses - 5+ bedrooms (%)
Vehicles available in owner-occupied houses - no vehicle available (%)
Vehicles available in owner-occupied houses - 1 vehicle available(%)
Vehicles available in owner-occupied houses - 2 Vehicles available (%)
Vehicles available in owner-occupied houses - 3 Vehicles available (%)
Vehicles available in owner-occupied houses - 4 Vehicles available (%)
Vehicles available in owner-occupied houses - 5+ Vehicles available (%)
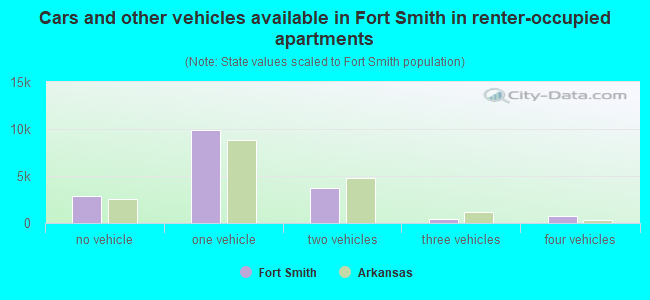
Vehicles available in renter-occupied houses - no vehicle available (%)
Vehicles available in renter-occupied houses - 1 vehicle available (%)
Vehicles available in renter-occupied houses - 2 Vehicles available (%)
Vehicles available in renter-occupied houses - 3 Vehicles available (%)
Vehicles available in renter-occupied houses - 4 Vehicles available (%)
Vehicles available in renter-occupied houses - 5+ Vehicles available (%)
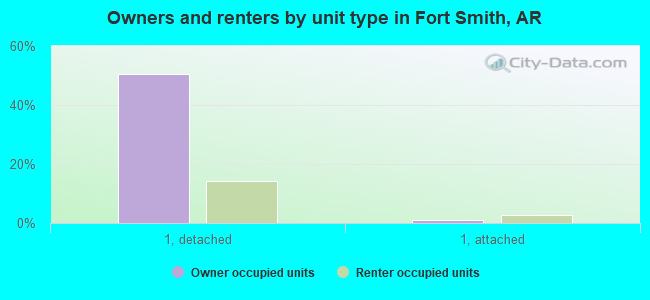
Housing units in structures - 1, detached (%)
Housing units in structures - 1, attached (%)
Housing units in structures - 2 (%)
Housing units in structures - 3 or 4 (%)
Housing units in structures - 5 to 9 (%)
Housing units in structures - 10 to 19 (%)
Housing units in structures - 20 to 49 (%)
Housing units in structures - 50 or more (%)
Housing units in structures - Mobile home (%)
Housing units in structures - Boat, RV, van, etc. (%)
Housing units in structures - Owners - 1, detached (%)
Housing units in structures - Owners - 1, attached (%)
Housing units in structures - Owners - 2 (%)
Housing units in structures - Owners - 3 or 4 (%)
Housing units in structures - Owners - 5 to 9 (%)
Housing units in structures - Owners - 10 to 19 (%)
Housing units in structures - Owners - 20 to 49 (%)
Housing units in structures - Owners - 50 or more (%)
Housing units in structures - Owners - Mobile home (%)
Housing units in structures - Owners - Boat, RV, van, etc. (%)
Housing units in structures - Renters - 1, detached (%)
Housing units in structures - Renters - 1, attached (%)
Housing units in structures - Renters - 2 (%)
Housing units in structures - Renters - 3 or 4 (%)
Housing units in structures - Renters - 5 to 9 (%)
Housing units in structures - Renters - 10 to 19 (%)
Housing units in structures - Renters - 20 to 49 (%)
Housing units in structures - Renters - 50 or more (%)
Housing units in structures - Renters - Mobile home (%)
Housing units in structures - Renters - Boat, RV, van, etc. (%)
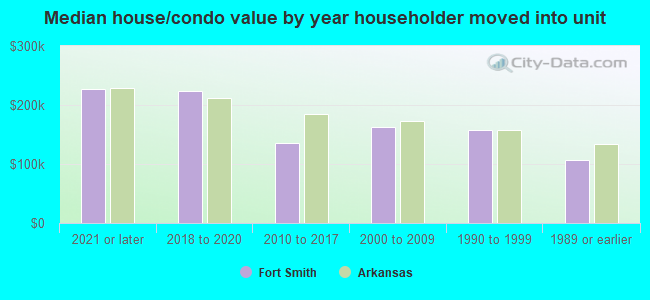
House/condo owner moved in on average (years ago)
Renter moved in on average (years ago)
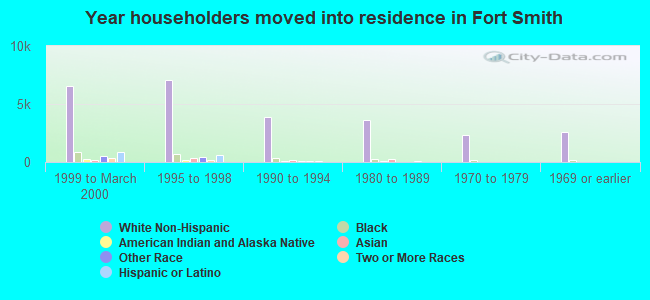
Year householder moved into unit - Moved in 1999 to March 2000 (%)
Year householder moved into unit - Moved in 1999 to March 2000 (%) - White
Year householder moved into unit - Moved in 1999 to March 2000 (%) - Black or African American
Year householder moved into unit - Moved in 1999 to March 2000 (%) - Asian
Year householder moved into unit - Moved in 1999 to March 2000 (%) - Hispanic or Latino
Year householder moved into unit - Moved in 1999 to March 2000 (%) - American Indian and Alaska Native
Year householder moved into unit - Moved in 1999 to March 2000 (%) - Multirace
Year householder moved into unit - Moved in 1999 to March 2000 (%) - Other Race
Year householder moved into unit - Moved in 1995 to 1998 (%)
Year householder moved into unit - Moved in 1995 to 1998 (%) - White
Year householder moved into unit - Moved in 1995 to 1998 (%) - Black or African American
Year householder moved into unit - Moved in 1995 to 1998 (%) - Asian
Year householder moved into unit - Moved in 1995 to 1998 (%) - Hispanic or Latino
Year householder moved into unit - Moved in 1995 to 1998 (%) - American Indian and Alaska Native
Year householder moved into unit - Moved in 1995 to 1998 (%) - Multirace
Year householder moved into unit - Moved in 1995 to 1998 (%) - Other Race
Year householder moved into unit - Moved in 1990 to 1994 (%)
Year householder moved into unit - Moved in 1990 to 1994 (%) - White
Year householder moved into unit - Moved in 1990 to 1994 (%) - Black or African American
Year householder moved into unit - Moved in 1990 to 1994 (%) - Asian
Year householder moved into unit - Moved in 1990 to 1994 (%) - Hispanic or Latino
Year householder moved into unit - Moved in 1990 to 1994 (%) - American Indian and Alaska Native
Year householder moved into unit - Moved in 1990 to 1994 (%) - Multirace
Year householder moved into unit - Moved in 1990 to 1994 (%) - Other Race
Year householder moved into unit - Moved in 1980 to 1989 (%)
Year householder moved into unit - Moved in 1980 to 1989 (%) - White
Year householder moved into unit - Moved in 1980 to 1989 (%) - Black or African American
Year householder moved into unit - Moved in 1980 to 1989 (%) - Asian
Year householder moved into unit - Moved in 1980 to 1989 (%) - Hispanic or Latino
Year householder moved into unit - Moved in 1980 to 1989 (%) - American Indian and Alaska Native
Year householder moved into unit - Moved in 1980 to 1989 (%) - Multirace
Year householder moved into unit - Moved in 1980 to 1989 (%) - Other Race
Year householder moved into unit - Moved in 1970 to 1979 (%)
Year householder moved into unit - Moved in 1970 to 1979 (%) - White
Year householder moved into unit - Moved in 1970 to 1979 (%) - Black or African American
Year householder moved into unit - Moved in 1970 to 1979 (%) - Asian
Year householder moved into unit - Moved in 1970 to 1979 (%) - Hispanic or Latino
Year householder moved into unit - Moved in 1970 to 1979 (%) - American Indian and Alaska Native
Year householder moved into unit - Moved in 1970 to 1979 (%) - Multirace
Year householder moved into unit - Moved in 1970 to 1979 (%) - Other Race
Year householder moved into unit - Moved in 1969 or earlier (%)
Year householder moved into unit - Moved in 1969 or earlier (%) - White
Year householder moved into unit - Moved in 1969 or earlier (%) - Black or African American
Year householder moved into unit - Moved in 1969 or earlier (%) - Asian
Year householder moved into unit - Moved in 1969 or earlier (%) - Hispanic or Latino
Year householder moved into unit - Moved in 1969 or earlier (%) - American Indian and Alaska Native
Year householder moved into unit - Moved in 1969 or earlier (%) - Multirace
Year householder moved into unit - Moved in 1969 or earlier (%) - Other Race
Housing units lacking complete plumbing facilities (%)
Housing units lacking complete kitchen facilities (%)
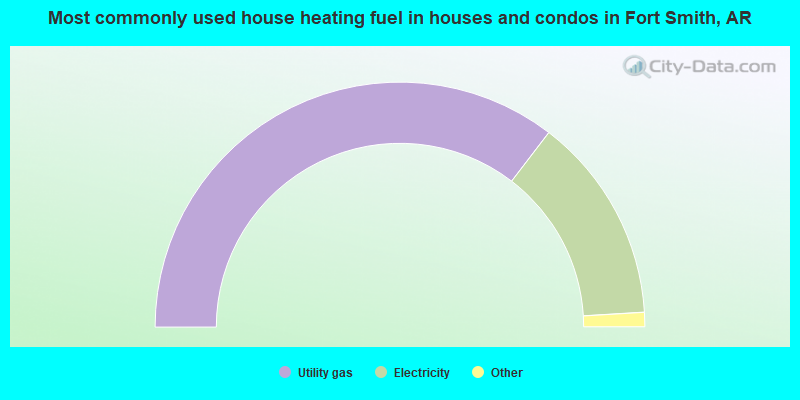
House heating fuel used in houses and condos - Utility gas (%)
House heating fuel used in houses and condos - Bottled, tank, or LP gas (%)
House heating fuel used in houses and condos - Electricity (%)
House heating fuel used in houses and condos - Fuel oil, kerosene, etc. (%)
House heating fuel used in houses and condos - Coal or coke (%)
House heating fuel used in houses and condos - Wood (%)
House heating fuel used in houses and condos - Solar energy (%)
House heating fuel used in houses and condos - Other fuel (%)
House heating fuel used in houses and condos - No fuel used (%)
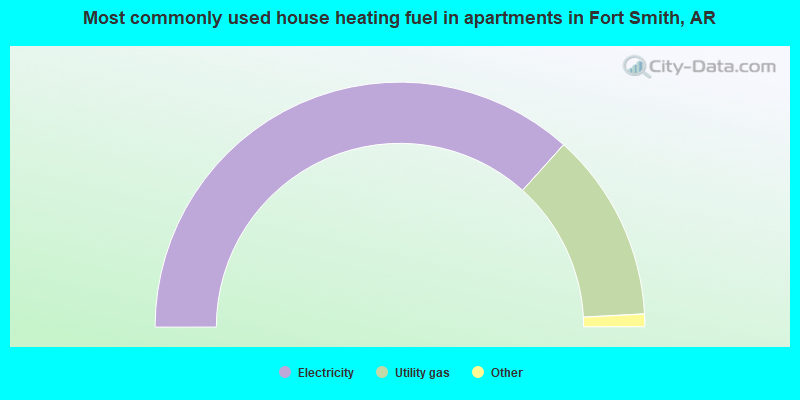
House heating fuel used in apartments - Utility gas (%)
House heating fuel used in apartments - Bottled, tank, or LP gas (%)
House heating fuel used in apartments - Electricity (%)
House heating fuel used in apartments - Fuel oil, kerosene, etc. (%)
House heating fuel used in apartments - Coal or coke (%)
House heating fuel used in apartments - Wood (%)
House heating fuel used in apartments - Solar energy (%)
House heating fuel used in apartments - Other fuel (%)
House heating fuel used in apartments - No fuel used (%)
Median year house/condo built: 1977Median year apartment built: 1979Household type by relationship:
Households: 89,981
Male householders: 15,302 (4,692 living alone ), Female householders: 21,285 (7,307 living alone )15,752 spouses (15,445 opposite-sex spouses ), 3,574 unmarried partners , (3,426 opposite-sex unmarried partners ), 26,074 children (23,587 natural , 689 adopted , 1,798 stepchildren ), 1,136 grandchildren , 667 brothers or sisters , 979 parents , 265 foster children , 1,931 other relatives , 1,696 non-relatives In group quarters: 1,320
Size of family households: 8,683 2-persons , 5,709 3-persons , 3,727 4-persons , 2,889 5-persons , 831 6-persons , 272 7-or-more-persons .
Size of nonfamily households: 11,999 1-person , 2,289 2-persons , 106 3-persons , 82 4-persons .
15,237 married couples with children. single-parent households (1,740 men , 3,850 women ).
79.0% of residents of Fort Smith speak English at home. of residents speak Spanish at home (61% speak English very well , 17% speak English well , 13% speak English not well , 9% don't speak English at all ).of residents speak other Indo-European language at home (92% speak English very well , 4% speak English well , 2% speak English not well , 2% don't speak English at all ).of residents speak Asian or Pacific Island language at home (54% speak English very well , 22% speak English well , 22% speak English not well , 2% don't speak English at all ).of residents speak other language at home (85% speak English very well , 15% speak English well ).
Foreign born population: 9,574 (10.6%)of them are naturalized citizens )
Median number of rooms in houses and condos:
Median number of rooms in apartments
Owner-occupied Renter-occupied
Rooms in owner-occupied houses in Fort Smith, Arkansas
0 1 room 49 2 rooms 147 3 rooms 1,584 4 rooms 3,733 5 rooms 6,020 6 rooms 2,623 7 rooms 1,906 8 rooms 2,857 9+ rooms
Rooms in renter-occupied apartments in Fort Smith, Arkansas
566 1 room 787 2 rooms 3,687 3 rooms 5,194 4 rooms 3,919 5 rooms 1,507 6 rooms 1,387 7 rooms 168 8 rooms 453 9+ rooms
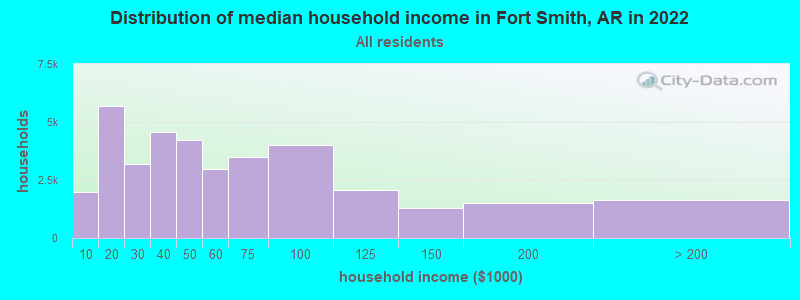
Fort Smith, AR household income distribution 1,973 Less than $10,0005,679 $10,000 to $19,9993,170 $20,000 to $29,9994,560 $30,000 to $39,9994,217 $40,000 to $49,9992,966 $50,000 to $59,9993,491 $60,000 to $74,9994,028 $75,000 to $99,9992,054 $100,000 to $124,9991,307 $125,000 to $149,9991,524 $150,000 to $199,9991,618 $200,000 or more
Home value of owner - occupied houses in 2022 in Fort Smith, AR 108 Less than $10,000273 $10,000 to $14,999152 $20,000 to $24,99930 $35,000 to $39,999272 $40,000 to $49,999749 $50,000 to $59,999779 $60,000 to $69,999578 $70,000 to $79,999801 $80,000 to $89,999595 $90,000 to $99,9991,935 $100,000 to $124,9991,479 $125,000 to $149,9991,721 $150,000 to $174,9991,367 $175,000 to $199,9992,807 $200,000 to $249,9991,760 $250,000 to $299,9991,821 $300,000 to $399,999684 $400,000 to $499,999596 $500,000 to $749,999201 $750,000 to $999,999178 $1,000,000 to $1,499,99933 $2,000,000 or moreRent paid by renters in 2022 in Fort Smith, AR 85 Less than $10083 $100 to $149323 $200 to $249386 $250 to $299390 $300 to $349322 $350 to $399540 $400 to $4491,831 $450 to $4991,889 $500 to $5492,896 $550 to $5992,006 $600 to $6491,476 $650 to $699722 $700 to $749514 $750 to $7991,528 $800 to $8991,172 $900 to $999469 $1,000 to $1,249406 $1,250 to $1,499104 $1,500 to $1,999116 $3,500 or more410 No cash rent
Percentage of workers working in this county: 88.7%Number of people working at home: 3,325 (8.2% of all workers )
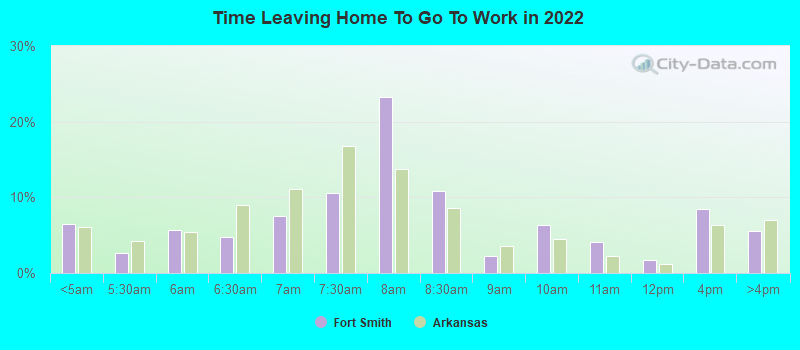
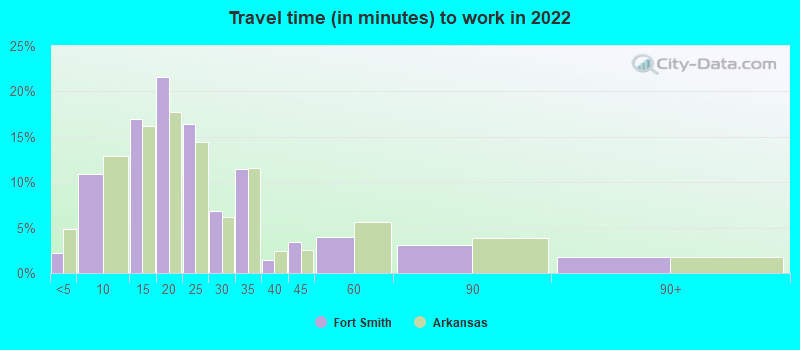
Travel time to work (commute)
Less than 5 minutes: 1,0575 to 9 minutes: 5,94610 to 14 minutes: 8,96715 to 19 minutes: 10,33020 to 24 minutes: 4,89525 to 29 minutes: 1,53030 to 34 minutes: 70535 to 39 minutes: 18740 to 44 minutes: 51845 to 59 minutes: 88560 to 89 minutes: 59390 or more minutes: 272
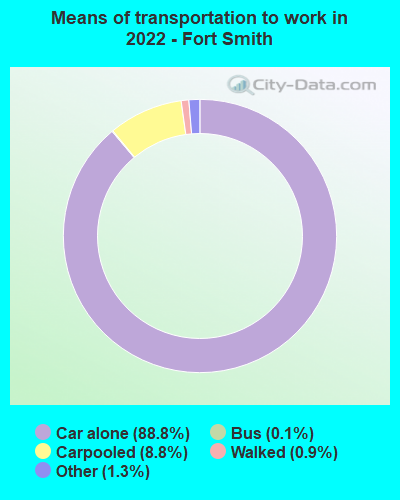
Means of transportation to work:
Drove a car alone: 53,222 (84.3%)Carpooled: 4,596 (7.3%)Bus : 80 (0.1%)Taxi: 852 (1.3%)Bicycle: 28 (0.0%)Walked: 602 (1.0%)Worked at home: 3,325 (5.3%)
Unemployment by race in 2022
Unemployment rate for White non-Hispanic residents 4.6% Males10.5% FemalesUnemployment rate for Black residents 14.1% Males4.8% FemalesUnemployment rate for American Indian and Alaska Native residents 0.9% Males3.9% FemalesUnemployment rate for Asian residents 2.0% Males3.8% FemalesUnemployment rate for other race residents 6.1% Males5.4% FemalesUnemployment rate for two or more race residents 5.9% Males8.9% FemalesUnemployment rate for Hispanic or Latino residents 6.4% Males4.8% Females
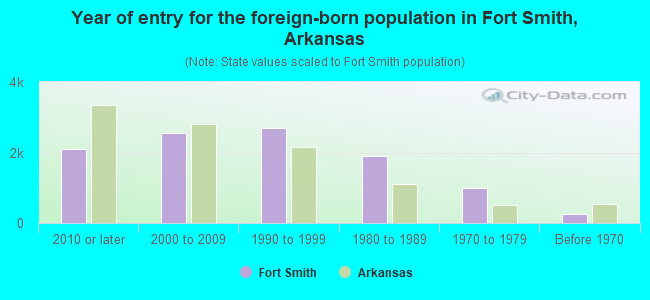
Year of entry for the foreign-born population in Fort Smith, Arkansas
2,110 2010 or later 2,562 2000 to 2009 2,681 1990 to 1999 1,900 1980 to 1989 1,001 1970 to 1979 253 Before 1970
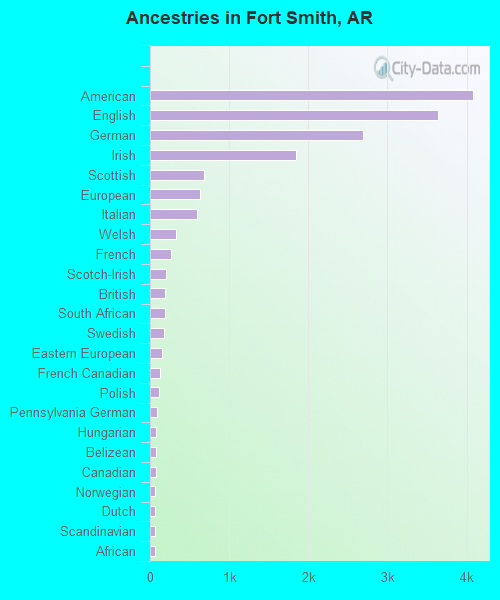
First ancestries reported:
American: 4,079 (8.4%)
English: 3,641 (7.5%)
German: 2,687 (5.5%)
Irish: 1,846 (3.8%)
Scottish: 679 (1.4%)
European: 634 (1.3%)
Italian: 595 (1.2%)
Welsh: 329 (0.7%)
French: 263 (0.5%)
Scotch-Irish: 196 (0.4%)
British: 189 (0.4%)
South African: 185 (0.4%)
Swedish: 173 (0.4%)
Eastern European: 152 (0.3%)
French Canadian: 131 (0.3%)
Polish: 119 (0.2%)
Pennsylvania German: 94 (0.2%)
Hungarian: 78 (0.2%)
Belizean: 73 (0.2%)
Canadian: 71 (0.1%)
Norwegian: 69 (0.1%)
Dutch: 69 (0.1%)
Scandinavian: 65 (0.1%)
African: 65 (0.1%)
Palestinian: 32 (0.07%)
Czech: 30 (0.06%)
Swiss: 30 (0.06%)
Northern European: 27 (0.06%)
Celtic: 26 (0.05%)
Greek: 25 (0.05%)
Cajun: 23 (0.05%)
Israeli: 18 (0.04%)
Austrian: 17 (0.04%)
Dutch West Indian: 12 (0.02%)
Russian: 9 (0.02%)
Albanian: 5 (0.01%)
Danish: 4 (0.01%) Most common places of birth for foreign-born residents (%): Mexico Fort Smith:
40.1% (4,128)Arkansas:
40.2% (61,075)
El Salvador Fort Smith:
14.7% (1,519)Arkansas:
10.7% (16,210)
Laos Fort Smith:
11.9% (1,221)Arkansas:
2.2% (3,381)
Vietnam Fort Smith:
8.4% (862)Arkansas:
2.7% (4,028)
Guatemala Fort Smith:
5.8% (593)Arkansas:
3.5% (5,376)
Philippines Fort Smith:
1.9% (199)Arkansas:
2.7% (4,128)
Place of birth for U.S.-born residents:
This state: 48,205Other state: 30,815Northeast: 1,931Midwest: 7,167South: 13,700West: 8,017 82.2% of Fort Smith residents lived in the same house 1 years ago.
Out of people who lived in different houses, 24.7% lived in this county.
Out of people who lived in different counties, 44.5% lived in Arkansas.
Fort Smith:
82.2%State average:
87.0%
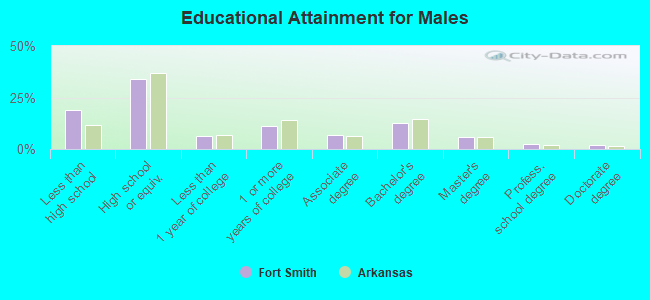
Education attainment for males 25 years and older:
No schooling: 1,694Nursery to 4th grade: 1655th and 6th grade: 4027th and 8th grade: 5429th grade: 81410th grade: 44511th grade: 30512th grade, no diploma: 1,053High school graduate (or equivalency): 9,747Less than 1 year of college: 1,788Some college more than 1 year, no degree: 3,248Associate degree: 1,887Bachelor's degree: 3,623Master's degree: 1,605Professional school degree: 668Doctorate degree: 569
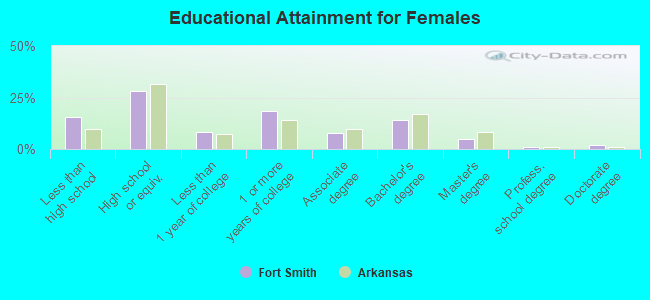
Education attainment for females 25 years and older:
No schooling: 1,502Nursery to 4th grade: 915th and 6th grade: 1,0207th and 8th grade: 3829th grade: 32510th grade: 38111th grade: 98612th grade, no diploma: 264High school graduate (or equivalency): 9,042Less than 1 year of college: 2,687Some college more than 1 year, no degree: 5,966Associate degree: 2,509Bachelor's degree: 4,482Master's degree: 1,580Professional school degree: 281Doctorate degree: 548
Housing units in structures:
One, detached: 25,786One, attached: 1,595Two: 3,0823 or 4: 2,6725 to 9: 2,53110 to 19: 2,11620 to 49: 73650 or more: 1,731Mobile homes: 576Housing units lacking complete plumbing facilities in 2022: 3.2%Housing units lacking complete kitchen facilities in 2022: 4.5%House/condo owner moved in on average 12 years ago
Renter moved in on average 2 years ago
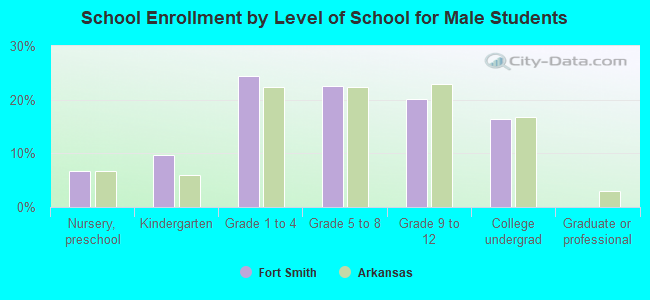
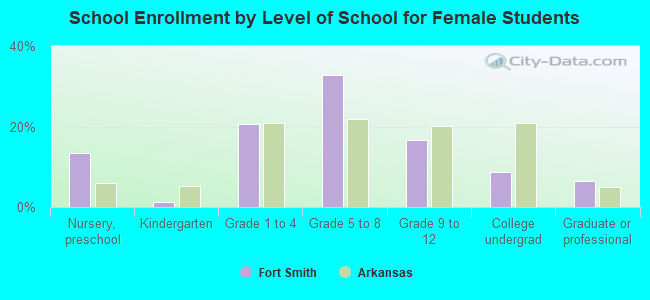
Private vs. public school enrollment:
Students in private schools in grades 1 to 8 (elementary and middle school): 1,711 Students in private schools in grades 9 to 12 (high school): 237 Students in private undergraduate colleges: 113