Fort Mill, SC (South Carolina) Houses and Residents
Estimated median house or condo value in 2022: $528,485 (it was $122,800 in 2000 )
Fort Mill:
$528,485South Carolina:
$254,600
Lower value quartile - upper value quartile: $389,929 - $682,028Total population: 13,087 (Urban population: 7,699, Rural population: 7 (all nonfarm) )
Houses: 9,944 (9,439 occupied: 7,943 owner occupied, 1,492 renter occupied )
% of renters here:
16%State:
28%
Housing density: 2,179 houses/condos per square mile
Median price asked for vacant for-sale houses and condos in 2022 in this county: $539,653.
Median contract rent in 2022: $1,401 (lower quartile is $948, upper quartile is $1,632)
Median rent asked for vacant for-rent units in 2022: $632
Median gross rent in Fort Mill, SC in 2022: $1,452
Housing units in Fort Mill with a mortgage: 6,382 (344 second mortgage, 0 home equity loan, 369 both second mortgage and home equity loan )Houses without a mortgage: 47
Median household income for houses/condos with a mortgage: $152,729
Median household income for apartments without a mortgage: $116,362
Median monthly housing costs: $1,734
Data:
Median house or condo value ($)
Median house or condo value ($ change since 2000)
Median house or condo value ($) - White
Median house or condo value ($) - Black or African American
Median house or condo value ($) - Asian
Median house or condo value ($) - Hispanic or Latino
Median house or condo value ($) - American Indian and Alaska Native
Median house or condo value ($) - Multirace
Median house or condo value ($) - Other Race
Median price asked for mobile homes ($)
Household density (households per square mile)
Mean house or condo value by units in structure - 1, detached ($)
Mean house or condo value by units in structure - 1, attached ($)
Mean house or condo value by units in structure - 2 ($)
Mean house or condo value by units in structure by units in structure - 3 or 4 ($)
Mean house or condo value by units in structure - 5 or more ($)
Mean house or condo value by units in structure - Boat, RV, van, etc. ($)
Mean house or condo value by units in structure - Mobile home ($)
Median contract rent ($)
Median contract rent - Lower quartile ($)
Median contract rent - Upper quartile ($)
Median gross rent ($)
Urban houses (%)
Rural houses (%)
Houses occupied (%)
Houses occupied (% change since 2000)
Houses owner occupied (%)
Houses owner occupied (% change since 2000)
Houses renter occupied (%)
Houses renter occupied (% change since 2000)
Vacant housing units - For rent (%)
Vacant housing units - For rent (% change since 2000)
Vacant housing units - For sale only (%)
Vacant housing units - For sale only (% change since 2000)
Vacant housing units - Rented or sold, not occupied (%)
Vacant housing units - Rented or sold, not occupied (% change since 2000)
Vacant housing units - For seasonal, recreational, or occasional use (%)
Vacant housing units - For seasonal, recreational, or occasional use (% change since 2000)
Vacant housing units - For migrant workers (%)
Vacant housing units - For migrant workers (% change since 2000)
Vacant housing units - Other vacant (%)
Vacant housing units - Other vacant (% change since 2000)
Median monthly housing costs ($)
Median household income for houses/condos with a mortgage ($)
Median household income for houses/condos without a mortgage ($)
Median household income ($)
Median household income ($) - White
Median household income ($) - Black or African American
Median household income ($) - Asian
Median household income ($) - Hispanic or Latino
Median household income ($) - American Indian and Alaska Native
Median household income ($) - Multirace
Median household income ($) - Other Race
Mortgage status - with mortgage (%)
Mortgage status - with second mortgage (%)
Mortgage status - with home equity loan (%)
Mortgage status - with both second mortgage and home equity loan (%)
Mortgage status - without a mortgage (%)
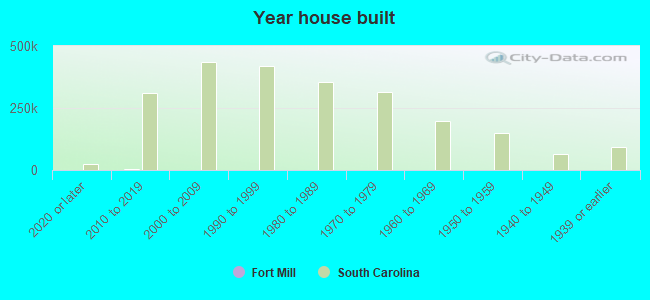
Median year house/condo built
Median year apartment built
Household type by relationship - Male householder living alone (%)
Household type by relationship - Male householder not living alone (%)
Household type by relationship - Female householder living alone (%)
Household type by relationship - Female householder not living alone (%)
Household type by relationship - Opposite-Sex spouse (%)
Household type by relationship - Same-Sex spouse (%)
Household type by relationship - Opposite-Sex unmarried partner (%)
Household type by relationship - Same-Sex unmarried partner (%)
Household type by relationship - In group quarters (%)
Size of family households - 2-person household (%)
Size of family households - 3-person household (%)
Size of family households - 4-person household (%)
Size of family households - 5-person household (%)
Size of family households - 6-person household (%)
Size of family households - 7-or-more-person household (%)
Size of nonfamily households - 1-person household (%)
Size of nonfamily households - 2-person household (%)
Size of nonfamily households - 3-person household (%)
Size of nonfamily households - 4-person household (%)
Size of nonfamily households - 5-person household (%)
Size of nonfamily households - 6-person household (%)
Size of nonfamily households - 7-or-moreperson household (%)
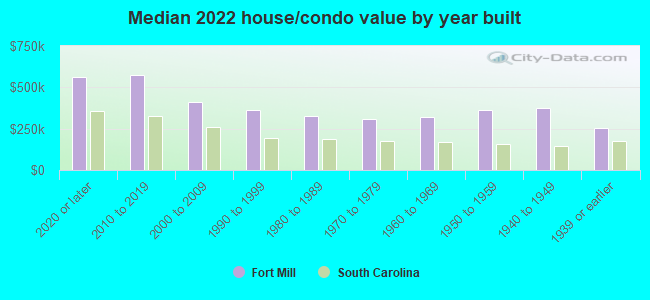
Year house built - Built 2010 or later (%)
Year house built - Built 2000 to 2009 (%)
Year house built - Built 1990 to 1999 (%)
Year house built - Built 1980 to 1989 (%)
Year house built - Built 1970 to 1979 (%)
Year house built - Built 1960 to 1969 (%)
Year house built - Built 1950 to 1959 (%)
Year house built - Built 1940 to 1949 (%)
Year house built - Built 1939 or earlier (%)
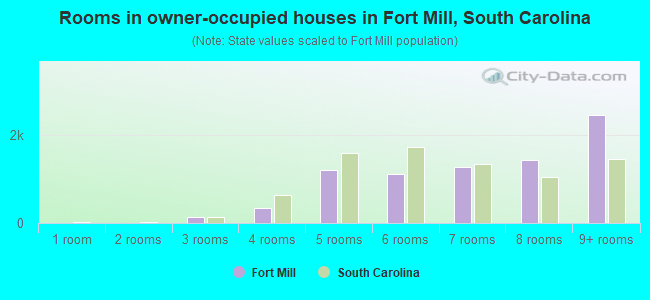
Median number of rooms in houses and condos
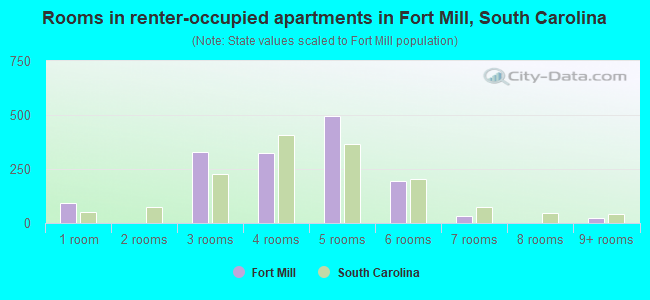
Median number of rooms in apartments
Median number of bedrooms in owner occupied houses
Mean number of bedrooms in owner occupied houses
Median number of bedrooms in renter occupied houses
Mean number of bedrooms in renter occupied houses
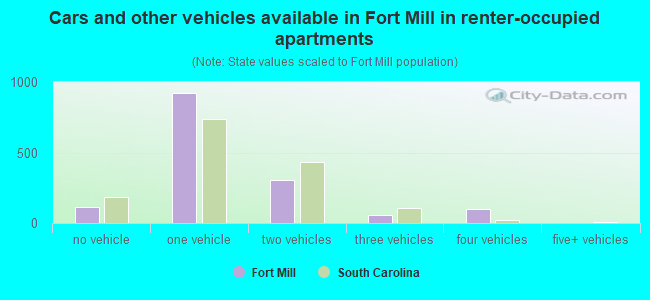
Median number of vehichles in owner occupied houses
Mean number of vehichles in owner occupied houses
Median number of vehichles in renter occupied houses
Mean number of vehichles in renter occupied houses
Rooms in owner-occupied houses - 1 room (%)
Rooms in owner-occupied houses - 2 rooms (%)
Rooms in owner-occupied houses - 3 rooms (%)
Rooms in owner-occupied houses - 4 rooms (%)
Rooms in owner-occupied houses - 5 rooms (%)
Rooms in owner-occupied houses - 6 rooms (%)
Rooms in owner-occupied houses - 7 rooms (%)
Rooms in owner-occupied houses - 8 rooms (%)
Rooms in owner-occupied houses - 9+ rooms (%)
Rooms in renter-occupied houses - 1 room (%)
Rooms in renter-occupied houses - 2 rooms (%)
Rooms in renter-occupied houses - 3 rooms (%)
Rooms in renter-occupied houses - 4 rooms (%)
Rooms in renter-occupied houses - 5 rooms (%)
Rooms in renter-occupied houses - 6 rooms (%)
Rooms in renter-occupied houses - 7 rooms (%)
Rooms in renter-occupied houses - 8 rooms (%)
Rooms in renter-occupied houses - 9+ rooms (%)
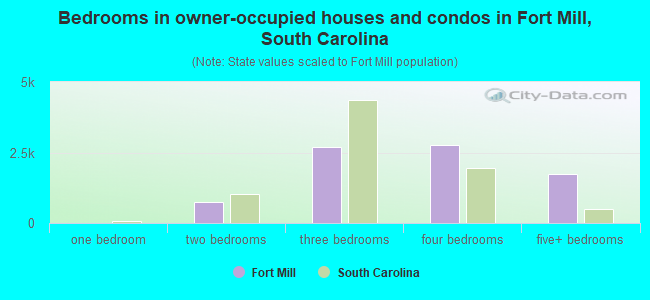
Bedrooms in owner-occupied houses - no bedrooms (%)
Bedrooms in owner-occupied houses - 1 bedroom (%)
Bedrooms in owner-occupied houses - 2 bedrooms (%)
Bedrooms in owner-occupied houses - 3 bedrooms (%)
Bedrooms in owner-occupied houses - 4 bedrooms (%)
Bedrooms in owner-occupied houses - 5+ bedrooms (%)
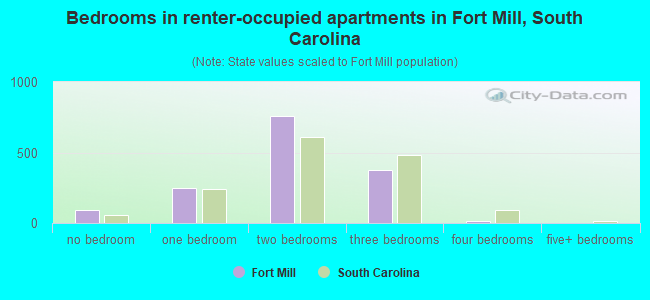
Bedrooms in renter-occupied houses - no bedrooms (%)
Bedrooms in renter-occupied houses - 1 bedroom (%)
Bedrooms in renter-occupied houses - 2 bedrooms (%)
Bedrooms in renter-occupied houses - 3 bedrooms (%)
Bedrooms in renter-occupied houses - 4 bedrooms (%)
Bedrooms in renter-occupied houses - 5+ bedrooms (%)
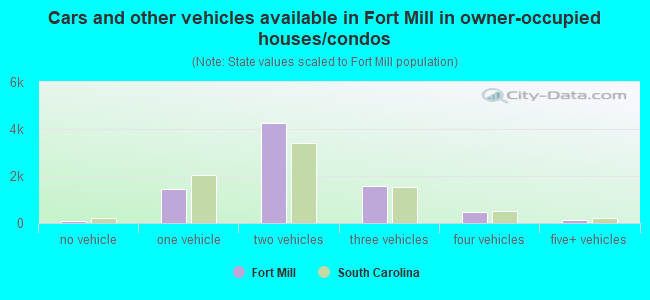
Vehicles available in owner-occupied houses - no vehicle available (%)
Vehicles available in owner-occupied houses - 1 vehicle available(%)
Vehicles available in owner-occupied houses - 2 Vehicles available (%)
Vehicles available in owner-occupied houses - 3 Vehicles available (%)
Vehicles available in owner-occupied houses - 4 Vehicles available (%)
Vehicles available in owner-occupied houses - 5+ Vehicles available (%)
Vehicles available in renter-occupied houses - no vehicle available (%)
Vehicles available in renter-occupied houses - 1 vehicle available (%)
Vehicles available in renter-occupied houses - 2 Vehicles available (%)
Vehicles available in renter-occupied houses - 3 Vehicles available (%)
Vehicles available in renter-occupied houses - 4 Vehicles available (%)
Vehicles available in renter-occupied houses - 5+ Vehicles available (%)
Housing units in structures - 1, detached (%)
Housing units in structures - 1, attached (%)
Housing units in structures - 2 (%)
Housing units in structures - 3 or 4 (%)
Housing units in structures - 5 to 9 (%)
Housing units in structures - 10 to 19 (%)
Housing units in structures - 20 to 49 (%)
Housing units in structures - 50 or more (%)
Housing units in structures - Mobile home (%)
Housing units in structures - Boat, RV, van, etc. (%)
Housing units in structures - Owners - 1, detached (%)
Housing units in structures - Owners - 1, attached (%)
Housing units in structures - Owners - 2 (%)
Housing units in structures - Owners - 3 or 4 (%)
Housing units in structures - Owners - 5 to 9 (%)
Housing units in structures - Owners - 10 to 19 (%)
Housing units in structures - Owners - 20 to 49 (%)
Housing units in structures - Owners - 50 or more (%)
Housing units in structures - Owners - Mobile home (%)
Housing units in structures - Owners - Boat, RV, van, etc. (%)
Housing units in structures - Renters - 1, detached (%)
Housing units in structures - Renters - 1, attached (%)
Housing units in structures - Renters - 2 (%)
Housing units in structures - Renters - 3 or 4 (%)
Housing units in structures - Renters - 5 to 9 (%)
Housing units in structures - Renters - 10 to 19 (%)
Housing units in structures - Renters - 20 to 49 (%)
Housing units in structures - Renters - 50 or more (%)
Housing units in structures - Renters - Mobile home (%)
Housing units in structures - Renters - Boat, RV, van, etc. (%)
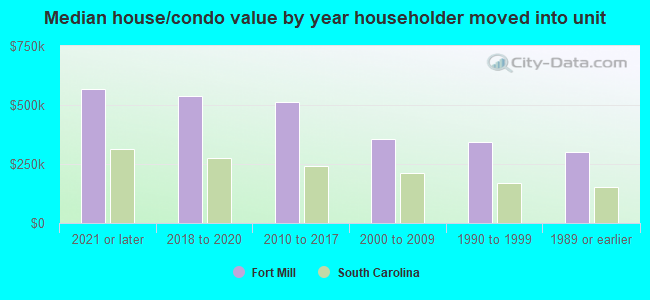
House/condo owner moved in on average (years ago)
Renter moved in on average (years ago)
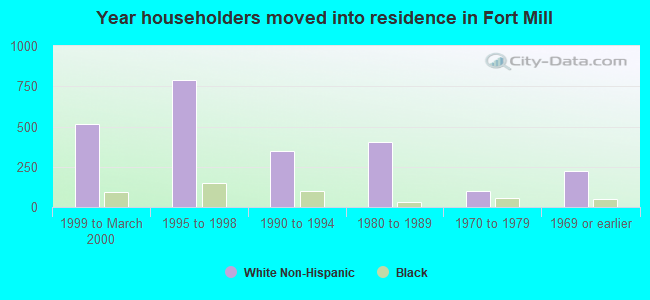
Year householder moved into unit - Moved in 1999 to March 2000 (%)
Year householder moved into unit - Moved in 1999 to March 2000 (%) - White
Year householder moved into unit - Moved in 1999 to March 2000 (%) - Black or African American
Year householder moved into unit - Moved in 1999 to March 2000 (%) - Asian
Year householder moved into unit - Moved in 1999 to March 2000 (%) - Hispanic or Latino
Year householder moved into unit - Moved in 1999 to March 2000 (%) - American Indian and Alaska Native
Year householder moved into unit - Moved in 1999 to March 2000 (%) - Multirace
Year householder moved into unit - Moved in 1999 to March 2000 (%) - Other Race
Year householder moved into unit - Moved in 1995 to 1998 (%)
Year householder moved into unit - Moved in 1995 to 1998 (%) - White
Year householder moved into unit - Moved in 1995 to 1998 (%) - Black or African American
Year householder moved into unit - Moved in 1995 to 1998 (%) - Asian
Year householder moved into unit - Moved in 1995 to 1998 (%) - Hispanic or Latino
Year householder moved into unit - Moved in 1995 to 1998 (%) - American Indian and Alaska Native
Year householder moved into unit - Moved in 1995 to 1998 (%) - Multirace
Year householder moved into unit - Moved in 1995 to 1998 (%) - Other Race
Year householder moved into unit - Moved in 1990 to 1994 (%)
Year householder moved into unit - Moved in 1990 to 1994 (%) - White
Year householder moved into unit - Moved in 1990 to 1994 (%) - Black or African American
Year householder moved into unit - Moved in 1990 to 1994 (%) - Asian
Year householder moved into unit - Moved in 1990 to 1994 (%) - Hispanic or Latino
Year householder moved into unit - Moved in 1990 to 1994 (%) - American Indian and Alaska Native
Year householder moved into unit - Moved in 1990 to 1994 (%) - Multirace
Year householder moved into unit - Moved in 1990 to 1994 (%) - Other Race
Year householder moved into unit - Moved in 1980 to 1989 (%)
Year householder moved into unit - Moved in 1980 to 1989 (%) - White
Year householder moved into unit - Moved in 1980 to 1989 (%) - Black or African American
Year householder moved into unit - Moved in 1980 to 1989 (%) - Asian
Year householder moved into unit - Moved in 1980 to 1989 (%) - Hispanic or Latino
Year householder moved into unit - Moved in 1980 to 1989 (%) - American Indian and Alaska Native
Year householder moved into unit - Moved in 1980 to 1989 (%) - Multirace
Year householder moved into unit - Moved in 1980 to 1989 (%) - Other Race
Year householder moved into unit - Moved in 1970 to 1979 (%)
Year householder moved into unit - Moved in 1970 to 1979 (%) - White
Year householder moved into unit - Moved in 1970 to 1979 (%) - Black or African American
Year householder moved into unit - Moved in 1970 to 1979 (%) - Asian
Year householder moved into unit - Moved in 1970 to 1979 (%) - Hispanic or Latino
Year householder moved into unit - Moved in 1970 to 1979 (%) - American Indian and Alaska Native
Year householder moved into unit - Moved in 1970 to 1979 (%) - Multirace
Year householder moved into unit - Moved in 1970 to 1979 (%) - Other Race
Year householder moved into unit - Moved in 1969 or earlier (%)
Year householder moved into unit - Moved in 1969 or earlier (%) - White
Year householder moved into unit - Moved in 1969 or earlier (%) - Black or African American
Year householder moved into unit - Moved in 1969 or earlier (%) - Asian
Year householder moved into unit - Moved in 1969 or earlier (%) - Hispanic or Latino
Year householder moved into unit - Moved in 1969 or earlier (%) - American Indian and Alaska Native
Year householder moved into unit - Moved in 1969 or earlier (%) - Multirace
Year householder moved into unit - Moved in 1969 or earlier (%) - Other Race
Housing units lacking complete plumbing facilities (%)
Housing units lacking complete kitchen facilities (%)
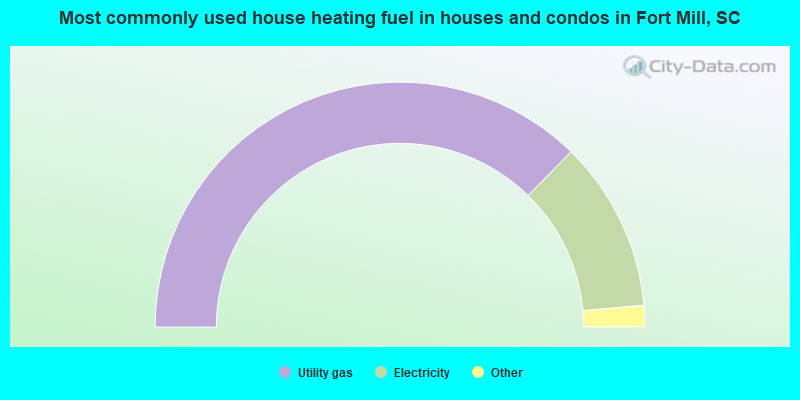
House heating fuel used in houses and condos - Utility gas (%)
House heating fuel used in houses and condos - Bottled, tank, or LP gas (%)
House heating fuel used in houses and condos - Electricity (%)
House heating fuel used in houses and condos - Fuel oil, kerosene, etc. (%)
House heating fuel used in houses and condos - Coal or coke (%)
House heating fuel used in houses and condos - Wood (%)
House heating fuel used in houses and condos - Solar energy (%)
House heating fuel used in houses and condos - Other fuel (%)
House heating fuel used in houses and condos - No fuel used (%)
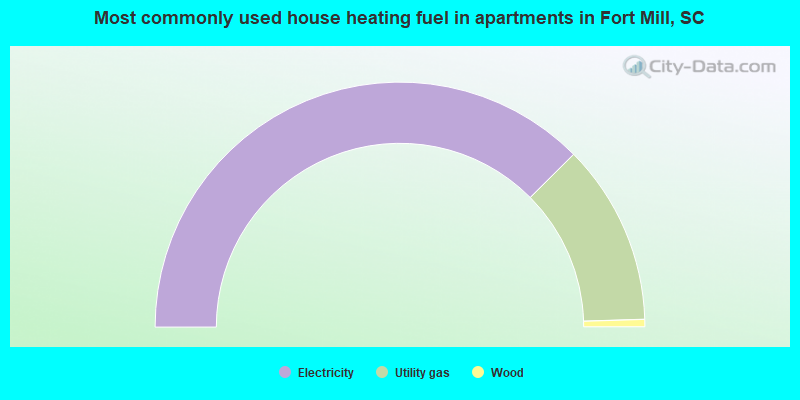
House heating fuel used in apartments - Utility gas (%)
House heating fuel used in apartments - Bottled, tank, or LP gas (%)
House heating fuel used in apartments - Electricity (%)
House heating fuel used in apartments - Fuel oil, kerosene, etc. (%)
House heating fuel used in apartments - Coal or coke (%)
House heating fuel used in apartments - Wood (%)
House heating fuel used in apartments - Solar energy (%)
House heating fuel used in apartments - Other fuel (%)
House heating fuel used in apartments - No fuel used (%)
Median year house/condo built: 2013Median year apartment built: 2000Household type by relationship:
Households: 27,057
Male householders: 4,928 (478 living alone ), Female householders: 4,427 (938 living alone )5,489 spouses (5,489 opposite-sex spouses ), 501 unmarried partners , (411 opposite-sex unmarried partners ), 9,870 children (9,316 natural , 139 adopted , 414 stepchildren ), 263 grandchildren , 155 brothers or sisters , 462 parents , 0 foster children , 599 other relatives , 352 non-relatives In group quarters: 6
Size of family households: 2,840 2-persons , 1,648 3-persons , 2,274 4-persons , 610 5-persons , 247 6-persons , 70 7-or-more-persons .
Size of nonfamily households: 1,431 1-person , 286 2-persons , 39 3-persons .
7,146 married couples with children. single-parent households (331 men , 598 women ).
93.0% of residents of Fort Mill speak English at home. of residents speak Spanish at home (90% speak English very well , 8% speak English well , 1% speak English not well ).of residents speak other Indo-European language at home (87% speak English very well , 12% speak English well , 1% speak English not well ).of residents speak Asian or Pacific Island language at home (95% speak English very well , 5% speak English well ).of residents speak other language at home (74% speak English very well , 26% speak English not well ).
Foreign born population: 1,667 (6.2%)of them are naturalized citizens )
Median number of rooms in houses and condos:
Median number of rooms in apartments
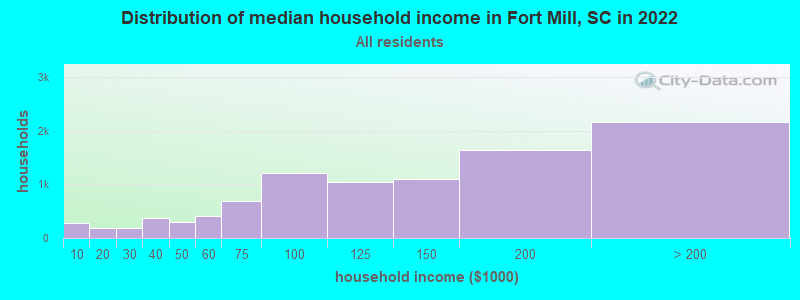
Fort Mill, SC household income distribution 277 Less than $10,000193 $10,000 to $19,999192 $20,000 to $29,999368 $30,000 to $39,999300 $40,000 to $49,999412 $50,000 to $59,999692 $60,000 to $74,9991,216 $75,000 to $99,9991,039 $100,000 to $124,9991,091 $125,000 to $149,9991,630 $150,000 to $199,9992,159 $200,000 or more
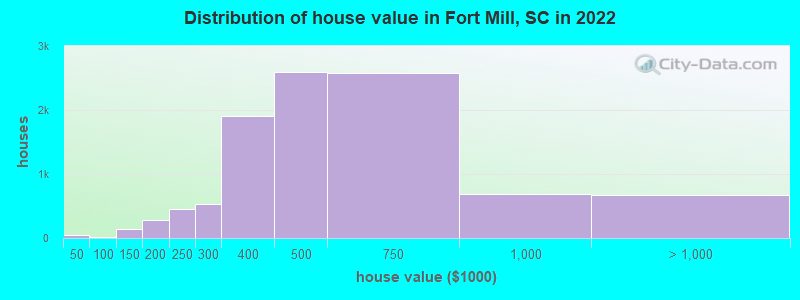
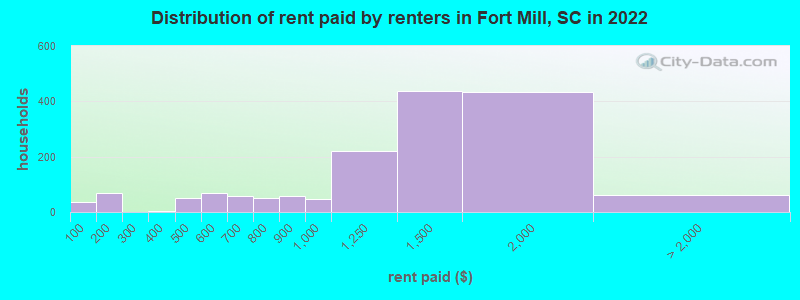
Home value of owner - occupied houses in 2022 in Fort Mill, SC 23 Less than $10,00024 $20,000 to $24,99911 $50,000 to $59,9998 $70,000 to $79,999107 $100,000 to $124,99930 $125,000 to $149,999150 $150,000 to $174,999137 $175,000 to $199,999446 $200,000 to $249,999530 $250,000 to $299,9991,899 $300,000 to $399,9992,601 $400,000 to $499,9992,573 $500,000 to $749,999694 $750,000 to $999,999614 $1,000,000 to $1,499,99950 $1,500,000 to $1,999,999Rent paid by renters in 2022 in Fort Mill, SC 37 Less than $10018 $100 to $14952 $150 to $1992 $350 to $39948 $400 to $44949 $500 to $54921 $550 to $59958 $600 to $64914 $700 to $74937 $750 to $79957 $800 to $89947 $900 to $999220 $1,000 to $1,249435 $1,250 to $1,499432 $1,500 to $1,99924 $2,000 to $2,49917 $2,500 to $2,99919 No cash rent
Percentage of workers working in this county: 64.4%Number of people working at home: 4,050 (28.9% of all workers )
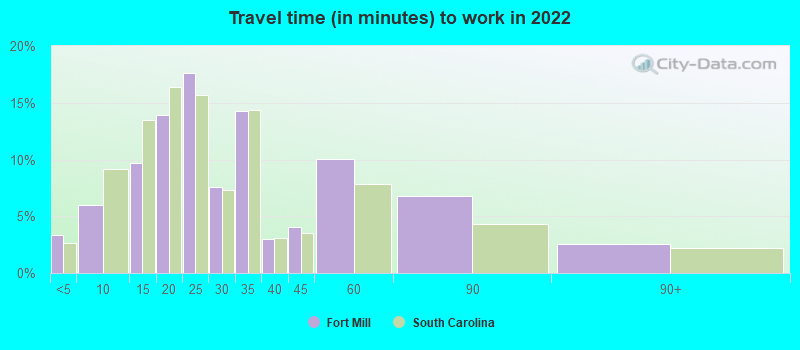
Travel time to work (commute)
Less than 5 minutes: 2465 to 9 minutes: 39110 to 14 minutes: 1,01215 to 19 minutes: 2,11720 to 24 minutes: 1,39525 to 29 minutes: 66730 to 34 minutes: 1,96935 to 39 minutes: 33140 to 44 minutes: 63145 to 59 minutes: 92260 to 89 minutes: 63490 or more minutes: 39
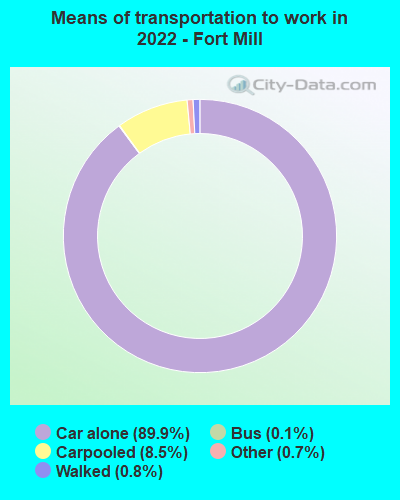
Means of transportation to work:
Drove a car alone: 11,326 (69.8%)Carpooled: 817 (5.0%)Bus : 13 (0.1%)Taxi: 142 (0.9%)Walked: 100 (0.6%)Worked at home: 4,050 (24.9%)
Unemployment by race in 2022
Unemployment rate for White non-Hispanic residents 1.1% Males1.8% FemalesUnemployment rate for Black residents 2.0% Males6.6% FemalesUnemployment rate for two or more race residents 6.4% Males
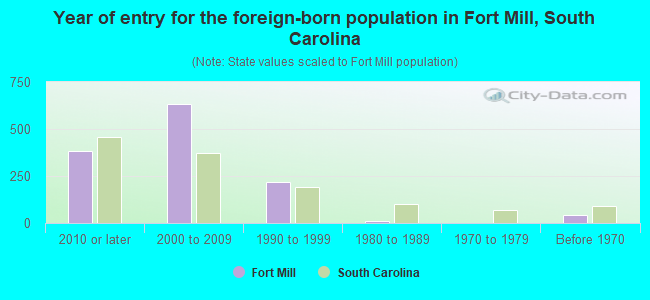
Year of entry for the foreign-born population in Fort Mill, South Carolina
384 2010 or later 631 2000 to 2009 220 1990 to 1999 10 1980 to 1989 0 1970 to 1979 42 Before 1970
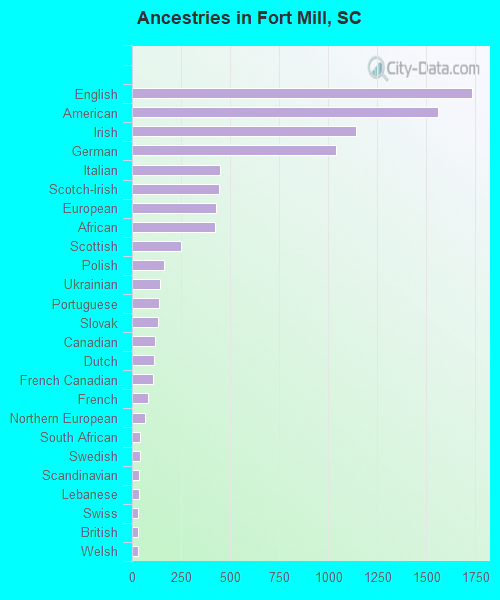
First ancestries reported:
English: 1,733 (13.4%)
American: 1,560 (12.0%)
Irish: 1,142 (8.8%)
German: 1,039 (8.0%)
Italian: 446 (3.4%)
Scotch-Irish: 443 (3.4%)
European: 426 (3.3%)
African: 424 (3.3%)
Scottish: 248 (1.9%)
Polish: 163 (1.3%)
Ukrainian: 145 (1.1%)
Portuguese: 139 (1.1%)
Slovak: 134 (1.0%)
Canadian: 117 (0.9%)
Dutch: 110 (0.8%)
French Canadian: 108 (0.8%)
French: 81 (0.6%)
Northern European: 64 (0.5%)
South African: 42 (0.3%)
Swedish: 40 (0.3%)
Scandinavian: 36 (0.3%)
Lebanese: 35 (0.3%)
Swiss: 33 (0.3%)
British: 32 (0.2%)
Welsh: 30 (0.2%)
Greek: 28 (0.2%)
British West Indian: 25 (0.2%)
Romanian: 20 (0.2%)
Finnish: 18 (0.1%)
Jamaican: 13 (0.1%)
Norwegian: 12 (0.09%)
Hungarian: 12 (0.09%)
Czechoslovakian: 10 (0.08%)
Austrian: 10 (0.08%)
Russian: 8 (0.06%) Most common places of birth for foreign-born residents (%): India Fort Mill:
29.8% (437)South Carolina:
6.8% (18,307)
Canada Fort Mill:
17.6% (258)South Carolina:
3.0% (8,193)
Nepal Fort Mill:
7.5% (110)South Carolina:
0.1% (293)
Germany Fort Mill:
6.7% (98)South Carolina:
3.7% (9,982)
Philippines Fort Mill:
5.1% (74)South Carolina:
4.1% (11,031)
Ukraine Fort Mill:
4.3% (63)South Carolina:
1.4% (3,877)
Venezuela Fort Mill:
4.1% (60)South Carolina:
1.4% (3,822)
Colombia Fort Mill:
4.0% (58)South Carolina:
4.3% (11,533)
United Kingdom, excluding England and Scotland Fort Mill:
3.6% (53)South Carolina:
1.2% (3,296)
Kenya Fort Mill:
3.3% (48)South Carolina:
0.5% (1,298)
South Africa Fort Mill:
2.6% (38)South Carolina:
0.4% (1,091)
Jamaica Fort Mill:
2.5% (36)South Carolina:
2.6% (7,073)
Mexico Fort Mill:
1.7% (25)South Carolina:
22.5% (60,774)
El Salvador Fort Mill:
1.6% (24)South Carolina:
1.1% (2,998)
Cuba Fort Mill:
1.6% (23)South Carolina:
1.5% (3,987)
Place of birth for U.S.-born residents:
This state: 3,978Other state: 21,598Northeast: 5,419Midwest: 3,431South: 11,588West: 1,162 87.1% of Fort Mill residents lived in the same house 1 years ago.
Out of people who lived in different houses, 21.7% lived in this county.
Out of people who lived in different counties, 16.6% lived in South Carolina.
Fort Mill:
87.1%State average:
86.5%
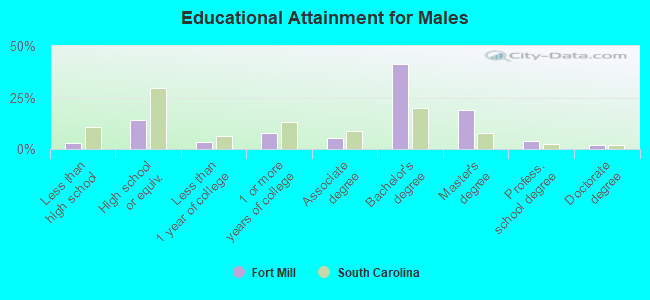
Education attainment for males 25 years and older:
No schooling: 39Nursery to 4th grade: 335th and 6th grade: 07th and 8th grade: 109th grade: 1210th grade: 5711th grade: 2312th grade, no diploma: 68High school graduate (or equivalency): 1,201Less than 1 year of college: 290Some college more than 1 year, no degree: 683Associate degree: 465Bachelor's degree: 3,521Master's degree: 1,636Professional school degree: 317Doctorate degree: 178
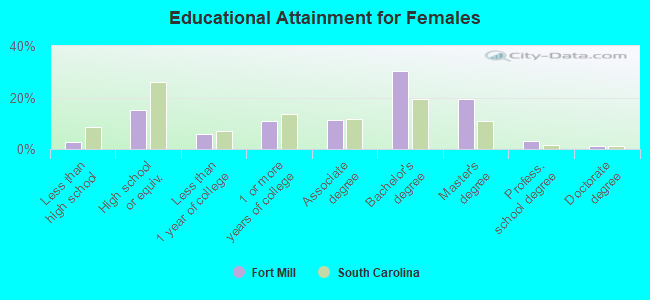
Education attainment for females 25 years and older:
No schooling: 45Nursery to 4th grade: 635th and 6th grade: 07th and 8th grade: 09th grade: 1610th grade: 4511th grade: 8512th grade, no diploma: 19High school graduate (or equivalency): 1,489Less than 1 year of college: 550Some college more than 1 year, no degree: 1,070Associate degree: 1,076Bachelor's degree: 2,956Master's degree: 1,901Professional school degree: 306Doctorate degree: 97
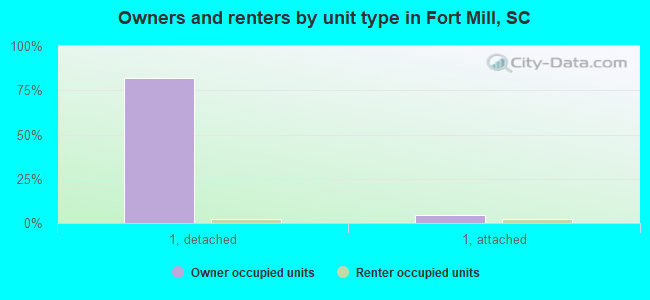
Housing units in structures:
One, detached: 8,005One, attached: 668Two: 1113 or 4: 3025 to 9: 38510 to 19: 18920 to 49: 18450 or more: 53Mobile homes: 44Housing units lacking complete plumbing facilities in 2022: 1.2%Housing units lacking complete kitchen facilities in 2022: 1.4%House/condo owner moved in on average 3 years ago
Renter moved in on average 1 years ago
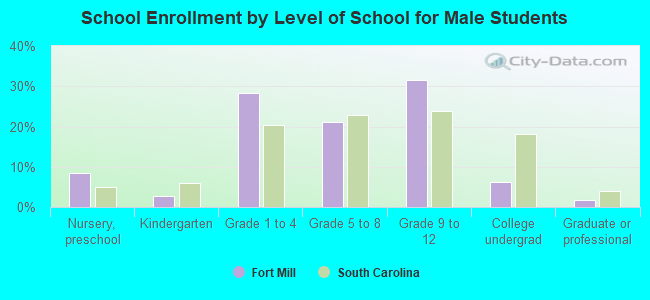
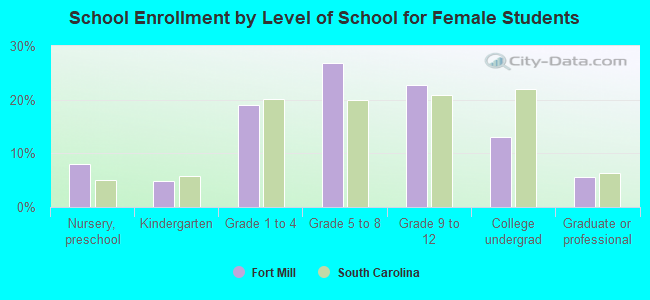
Private vs. public school enrollment:
Students in private schools in grades 1 to 8 (elementary and middle school): 282 Here:
7.3%South Carolina:
14.4%
Students in private schools in grades 9 to 12 (high school): 124 Here:
5.3%South Carolina:
11.1%
Students in private undergraduate colleges: 130 Here:
17.0%South Carolina:
21.9%