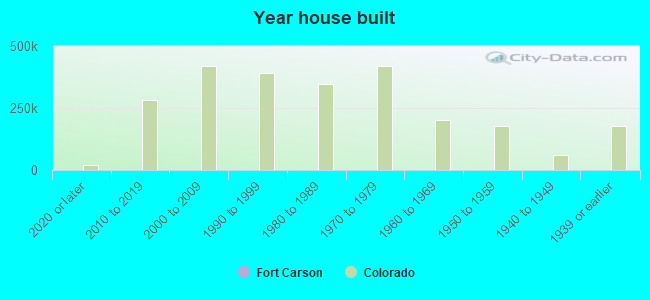
Fort Carson, CO (Colorado) Houses and Residents
| Fort Carson: | |
| Colorado: |
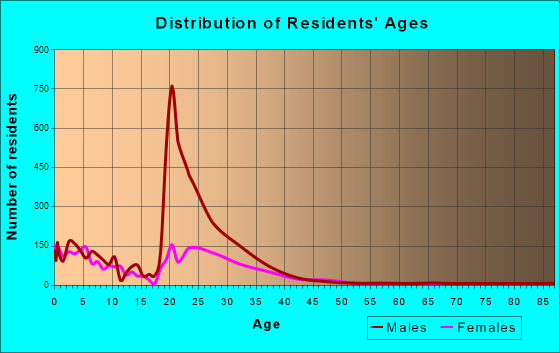
Total population: 13,813 (Urban population: 10,582, Rural population: 0)
Houses: 3,856 (3,494 occupied: 0 owner occupied, 3,530 renter occupied)
| % of renters here: | 100% |
| State: | 34% |
Housing density: 411 houses/condos per square mile
Median price asked for vacant for-sale houses and condos in 2022 in this county: $443,323.
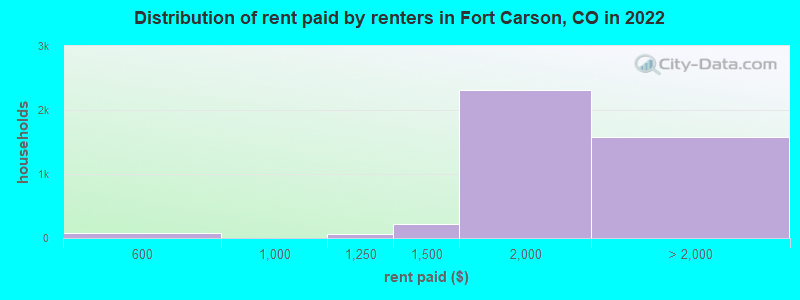
Median contract rent in 2022: $1,939 (lower quartile is $1,709, upper quartile is over $2,000)
Median rent asked for vacant for-rent units in 2022: $1,521
Median gross rent in Fort Carson, CO in 2022: $1,953
Housing units in Fort Carson with a mortgage: 0 (0 second mortgage, 0 home equity loan, 0 both second mortgage and home equity loan)
Houses without a mortgage: 0
Compare current foreclosures near Fort Carson, CO:
| Photo | Address | Area | Beds / Baths | Price | Details |
|---|---|---|---|---|---|

|
#1
Yellow Dock Point
Colorado Springs, CO 80911
|
1,867 sq. feet
|
4 baths 3 beds |
show details | |

|
#2
Johnsontown Hghts
Colorado Springs, CO 80908
|
1,566 sq. feet
|
3 baths 3 beds |
show details | |

|
#3
Cliveden Hts
Colorado Springs, CO 80906
|
1,476 sq. feet
|
2 baths 3 beds |
show details | |

|
#4
Hiawatha Dr
Colorado Springs, CO 80915
|
2,128 sq. feet
|
2 baths 5 beds |
show details | |

|
#5
Palomino Ranch Pt Unit 204
Colorado Springs, CO 80922
|
1,498 sq. feet
|
2 baths 3 beds |
show details | |

|
#6
Brentwood Ter
Colorado Springs, CO 80910
|
1,005 sq. feet
|
1 baths 3 beds |
show details | |

|
#7
S Brentwood Dr
Colorado Springs, CO 80910
|
1,040 sq. feet
|
1 baths 3 beds |
show details | |

|
#8
Mount View Ln
Fountain, CO 80817
|
1,360 sq. feet
|
2 baths 3 beds |
show details | |

|
#9
Fay Dr
Colorado Springs, CO 80911
|
- sq. feet
|
1 baths 2 beds |
show details | |

|
#10
Linda Mood Dr
Fountain, CO 80817
|
1,146 sq. feet
|
1 baths 3 beds |
show details |
| Photo | Address | Area | Beds / Baths | Price | Details |
|---|---|---|---|---|---|

|
#11
Live Oak Dr
Colorado Springs, CO 80916
|
1,540 sq. feet
|
1 baths 2 beds |
show details | |

|
#12
Streambank Dr
Colorado Springs, CO 80951
|
1,775 sq. feet
|
3 baths 3 beds |
show details | |

|
#13
Bow River Dr
Colorado Springs, CO 80923
|
1,272 sq. feet
|
2 baths 3 beds |
show details | |

|
#14
Tillamook Drive
Colorado Springs, CO 80925
|
1,421 sq. feet
|
3 baths 3 beds |
show details | |

|
#15
Northglen Dr
Colorado Springs, CO 80909
|
- sq. feet
|
2 baths 3 beds |
show details | |

|
#16
Breckenridge Dr W
Colorado Springs, CO 80906
|
2,618 sq. feet
|
2 baths 2 beds |
show details | |

|
#17
Excursion Dr
Colorado Springs, CO 80911
|
1,945 sq. feet
|
2 baths 3 beds |
show details | |

|
#18
Ely St
Colorado Springs, CO 80911
|
1,578 sq. feet
|
1 baths 2 beds |
show details | |

|
#19
Araia Dr
Fountain, CO 80817
|
1,504 sq. feet
|
3 baths 3 beds |
show details | |

|
#20
Lazy Stream Way
Colorado Springs, CO 80923
|
1,605 sq. feet
|
2 baths 3 beds |
show details |
| Photo | Address | Area | Beds / Baths | Price | Details |
|---|---|---|---|---|---|

|
#21
E Pikes Peak Ave
Colorado Springs, CO 80909
|
1,764 sq. feet
|
1 baths 3 beds |
show details | |

|
#22
N Murray Blvd
Colorado Springs, CO 80915
|
1,769 sq. feet
|
2 baths 3 beds |
show details | |

|
#23
Wainwright Dr
Colorado Springs, CO 80911
|
1,528 sq. feet
|
3 baths 5 beds |
show details | |

|
#24
Jamesport Dr
Colorado Springs, CO 80918
|
2,845 sq. feet
|
3 baths 3 beds |
show details | |

|
#25
Settlers Ter
Colorado Springs, CO 80917
|
2,228 sq. feet
|
4 baths 4 beds |
show details | |

|
#26
Daffodil St
Fountain, CO 80817
|
1,992 sq. feet
|
2 baths 3 beds |
show details | |

|
#27
Saratoga Dr
Colorado Springs, CO 80910
|
1,060 sq. feet
|
2 baths 5 beds |
show details | |

|
#28
Date St
Colorado Springs, CO 80917
|
1,517 sq. feet
|
2 baths 3 beds |
show details | |

|
#29
Bareback Dr
Colorado Springs, CO 80922
|
1,414 sq. feet
|
3 baths 3 beds |
show details | |

|
#30
Pinyon Jay Dr
Colorado Springs, CO 80951
|
2,425 sq. feet
|
3 baths 3 beds |
show details |
| Photo | Address | Area | Beds / Baths | Price | Details |
|---|---|---|---|---|---|

|
#31
Allens Park Dr
Colorado Springs, CO 80922
|
2,191 sq. feet
|
4 baths 4 beds |
show details | |

|
#32
N Carefree Cir
Colorado Springs, CO 80917
|
995 sq. feet
|
2 baths 3 beds |
show details | |

|
#33
Hutchinson Dr
Colorado Springs, CO 80910
|
876 sq. feet
|
2 baths 2 beds |
show details | |

|
#34
Iron Horse Trl
Colorado Springs, CO 80917
|
2,098 sq. feet
|
3 baths 3 beds |
show details | |

|
#35
Zermatt Dr
Colorado Springs, CO 80915
|
1,600 sq. feet
|
3 baths 4 beds |
show details | |

|
#36
Defoe Ave
Colorado Springs, CO 80911
|
1,396 sq. feet
|
1 baths 3 beds |
show details | |

|
#37
Shasta Dr
Colorado Springs, CO 80910
|
1,060 sq. feet
|
1 baths 3 beds |
show details | |

|
#38
Brook Valley Dr
Fountain, CO 80817
|
2,501 sq. feet
|
4 baths 4 beds |
show details | |

|
#39
Valley Hi Ave
Colorado Springs, CO 80910
|
1,625 sq. feet
|
2 baths 4 beds |
show details | |

|
#40
N Enchanted Cir
Colorado Springs, CO 80917
|
1,848 sq. feet
|
3 baths 4 beds |
show details |
| Photo | Address | Area | Beds / Baths | Price | Details |
|---|---|---|---|---|---|

|
#41
Poteae Cir
Colorado Springs, CO 80915
|
1,492 sq. feet
|
2 baths 3 beds |
show details | |

|
#42
Bethany Ct
Colorado Springs, CO 80918
|
2,352 sq. feet
|
4 baths 4 beds |
show details | |

|
#43
Yellowstone Rd
Colorado Springs, CO 80910
|
1,394 sq. feet
|
1 baths 3 beds |
show details | |

|
#44
Iron Horse Trl
Colorado Springs, CO 80917
|
1,584 sq. feet
|
3 baths 4 beds |
show details | |

|
#45
Ambleside Dr
Colorado Springs, CO 80915
|
2,453 sq. feet
|
2 baths 2 beds |
show details | |

|
#46
Skywriter Cir
Colorado Springs, CO 80922
|
2,319 sq. feet
|
4 baths 5 beds |
show details | |

|
#47
N Nevada Ave
Colorado Springs, CO 80907
|
1,475 sq. feet
|
3 baths 3 beds |
show details | |

|
#48
Prairier Schooner Dr
Colorado Springs, CO 80923
|
- sq. feet
|
1 baths 4 beds |
show details | |

|
#49
Liberty Ct
Fountain, CO 80817
|
2,225 sq. feet
|
2 baths 5 beds |
show details | |

|
Check over 1 million property listings on Foreclosure.com!
|
browse all offers | |||


 | East Woodmen Road in Colorado Springs eyed for homes, shopping and apartments (11 replies) |
| Colorado Springs Home prices (537 replies) |
| Best Colorado Springs neighborhood to rent for Fort Carson soldier family (1 reply) |
| Colorado Springs from Florida? (155 replies) |
| Houses along S. Academy. (5 replies) |
| Fort Carson Army Substance Abuse Program Holiday DUI Announcement (10 replies) |
Household type by relationship:
Households: 18,358- Male householders: 2,256 (17 living alone), Female householders: 1,119 (90 living alone)
2,995 spouses (2,912 opposite-sex spouses), 14 unmarried partners, (14 opposite-sex unmarried partners), 4,834 children (4,440 natural, 42 adopted, 351 stepchildren), 0 grandchildren, 0 brothers or sisters, 6 parents, 0 foster children, 41 other relatives, 96 non-relatives
- In group quarters: 6,994
Size of family households: 653 2-persons, 1,293 3-persons, 607 4-persons, 497 5-persons, 95 6-persons, 70 7-or-more-persons.
Size of nonfamily households: 115 1-person.
4,184 married couples with children.
448 single-parent households (38 men, 410 women).
83.8% of residents of Fort Carson speak English at home.
11.8% of residents speak Spanish at home (91% speak English very well, 8% speak English well).
1.2% of residents speak other Indo-European language at home (93% speak English very well, 7% speak English well).
1.8% of residents speak Asian or Pacific Island language at home (77% speak English very well, 23% speak English well).
1.5% of residents speak other language at home (76% speak English very well, 24% speak English well).
Foreign born population: 621 (3.4%)
(58.0% of them are naturalized citizens)
| Here: | -675799086.1 |
| State: | 6.8 |
| Here: | 5.4 |
| State: | 4.0 |
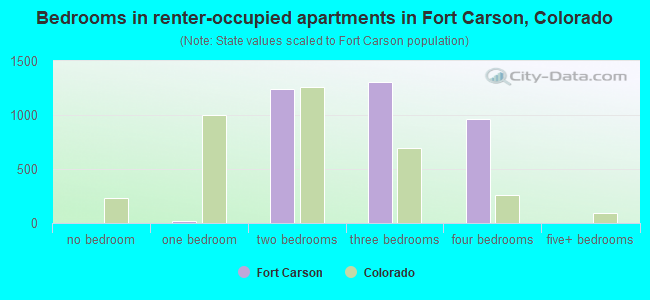
- Bedrooms in renter-occupied apartments in Fort Carson, Colorado
- 0no bedroom
- 171 bedroom
- 1,2422 bedrooms
- 1,3093 bedrooms
- 9634 bedrooms
- 05+ bedrooms
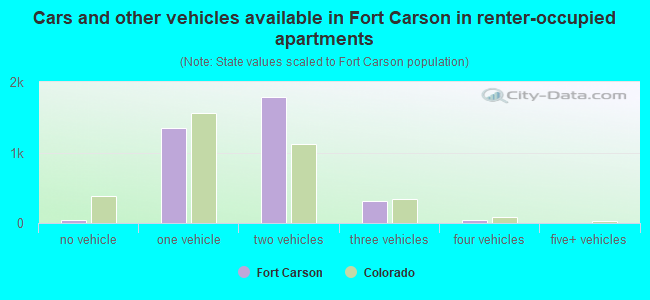
- Cars and other vehicles available in Fort Carson in renter-occupied apartments
- 47no vehicle
- 1,3471 vehicle
- 1,7822 vehicles
- 3083 vehicles
- 484 vehicles
- 05+ vehicles
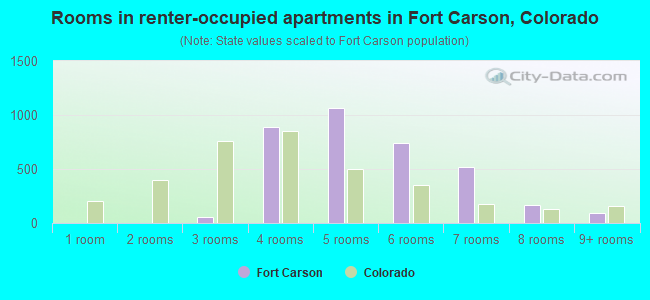
- Rooms in renter-occupied apartments in Fort Carson, Colorado
- 01 room
- 02 rooms
- 543 rooms
- 8914 rooms
- 1,0645 rooms
- 7436 rooms
- 5207 rooms
- 1648 rooms
- 949+ rooms
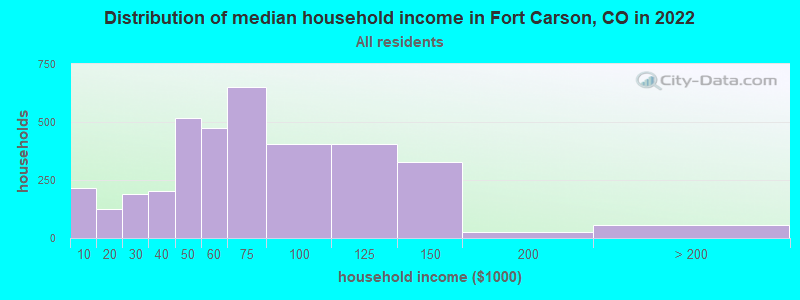
Fort Carson, CO household income distribution

- 216Less than $10,000
- 123$10,000 to $19,999
- 189$20,000 to $29,999
- 204$30,000 to $39,999
- 517$40,000 to $49,999
- 475$50,000 to $59,999
- 652$60,000 to $74,999
- 406$75,000 to $99,999
- 406$100,000 to $124,999
- 328$125,000 to $149,999
- 26$150,000 to $199,999
- 55$200,000 or more
Rent paid by renters in 2022 in Fort Carson, CO
-
- 15Less than $100
- 74$500 to $549
- 64$1,000 to $1,249
- 211$1,250 to $1,499
- 2,307$1,500 to $1,999
- 1,430$2,000 to $2,499
- 43$2,500 to $2,999
- 109No cash rent
Percentage of workers working in this county: 98.9%
Number of people working at home: 274 (2.3% of all workers)
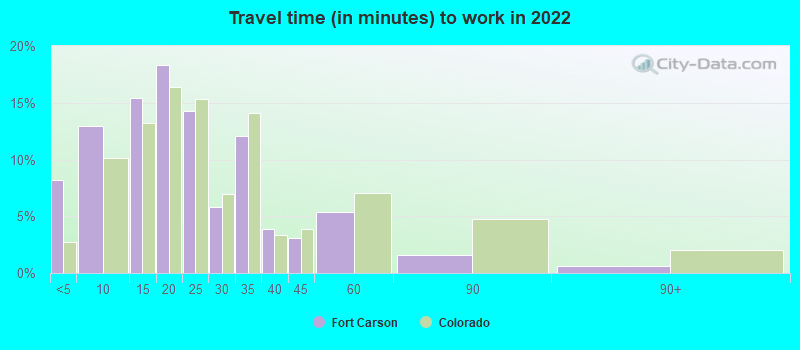
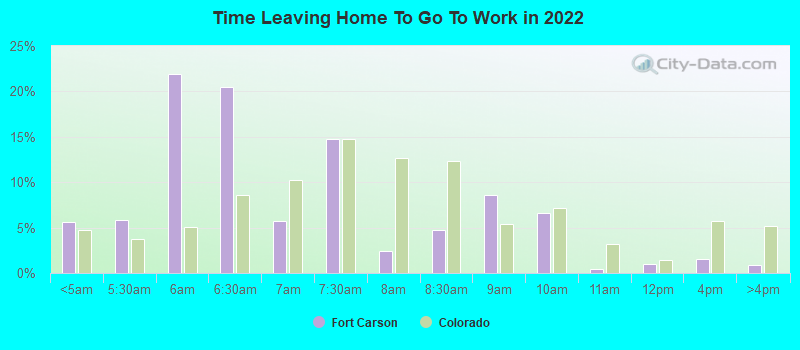
Travel time to work (commute)
- Less than 5 minutes: 2,241
- 5 to 9 minutes: 3,520
- 10 to 14 minutes: 2,845
- 15 to 19 minutes: 1,707
- 20 to 24 minutes: 786
- 25 to 29 minutes: 112
- 30 to 34 minutes: 330
- 35 to 39 minutes: 4
- 40 to 44 minutes: 54
- 45 to 59 minutes: 113
- 60 to 89 minutes: 19
- 90 or more minutes: 0
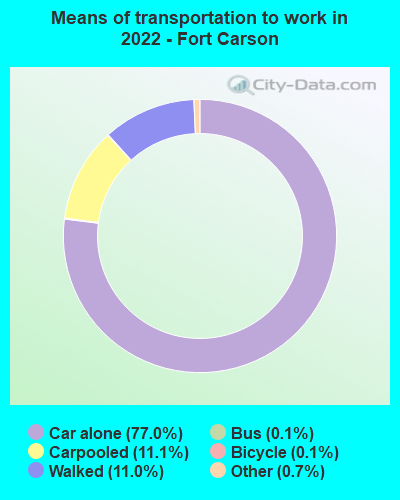
Means of transportation to work:
- Drove a car alone: 21,001 (72.1%)
- Carpooled: 2,877 (9.9%)
- Bus: 30 (0.1%)
- Taxi: 247 (0.8%)
- Bicycle: 60 (0.2%)
- Walked: 3,581 (12.3%)
- Worked at home: 274 (0.9%)
- Unemployment by race in 2022
- Unemployment rate for White non-Hispanic residents
- 2.9%Females
- Unemployment rate for two or more race residents
- 4.6%Females
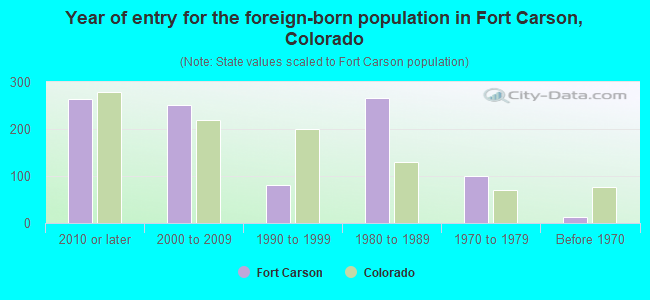
- Year of entry for the foreign-born population in Fort Carson, Colorado
- 2642010 or later
- 2512000 to 2009
- 801990 to 1999
- 2661980 to 1989
- 1011970 to 1979
- 12Before 1970
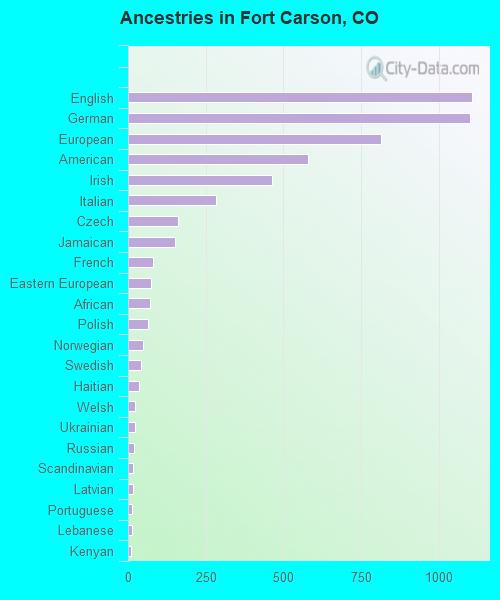
First ancestries reported:
- English: 1,107 (10.3%)
- German: 1,100 (10.3%)
- European: 814 (7.6%)
- American: 581 (5.4%)
- Irish: 463 (4.3%)
- Italian: 284 (2.7%)
- Czech: 161 (1.5%)
- Jamaican: 152 (1.4%)
- French: 82 (0.8%)
- Eastern European: 73 (0.7%)
- African: 70 (0.7%)
- Polish: 66 (0.6%)
- Norwegian: 47 (0.4%)
- Swedish: 43 (0.4%)
- Haitian: 37 (0.3%)
- Welsh: 23 (0.2%)
- Ukrainian: 21 (0.2%)
- Russian: 18 (0.2%)
- Scandinavian: 16 (0.1%)
- Latvian: 15 (0.1%)
- Portuguese: 13 (0.1%)
- Lebanese: 12 (0.1%)
- Kenyan: 11 (0.1%)
- Trinidadian and Tobagonian: 10 (0.09%)
- Scotch-Irish: 8 (0.07%)
- Romanian: 8 (0.07%)
- Sudanese: 7 (0.07%)
- Scottish: 6 (0.06%)
- British West Indian: 6 (0.06%)
- Brazilian: 6 (0.06%)
- Nigerian: 3 (0.03%)
- Somali: 2 (0.02%)
- Greek: 2 (0.02%)
- Liberian: 1 (0.01%)
Most common places of birth for foreign-born residents (%):
| Fort Carson: | 13.9% (91) |
| Colorado: | 0.7% (3,596) |
| Fort Carson: | 11.2% (73) |
| Colorado: | 38.3% (209,491) |
| Fort Carson: | 8.3% (54) |
| Colorado: | 0.4% (1,940) |
| Fort Carson: | 7.7% (50) |
| Colorado: | 0.3% (1,778) |
| Fort Carson: | 6.0% (39) |
| Colorado: | 2.3% (12,342) |
| Fort Carson: | 5.8% (38) |
| Colorado: | 1.4% (7,898) |
| Fort Carson: | 4.0% (26) |
| Colorado: | 0.7% (3,563) |
| Fort Carson: | 3.5% (23) |
| Colorado: | 0.8% (4,267) |
| Fort Carson: | 3.5% (23) |
| Colorado: | 0.5% (2,472) |
| Fort Carson: | 3.5% (23) |
| Colorado: | 0.1% (731) |
| Fort Carson: | 3.2% (21) |
| Colorado: | 1.1% (5,971) |
| Fort Carson: | 3.1% (20) |
| Colorado: | 2.5% (13,706) |
| Fort Carson: | 2.9% (19) |
| Colorado: | 0.1% (476) |
| Fort Carson: | 2.8% (18) |
| Colorado: | 1.4% (7,860) |
| Fort Carson: | 2.8% (18) |
| Colorado: | 0.1% (422) |
| Fort Carson: | 2.3% (15) |
| Colorado: | 3.0% (16,616) |
| Fort Carson: | 1.7% (11) |
| Colorado: | 1.1% (6,142) |
Place of birth for U.S.-born residents:
- This state: 2,058
- Other state: 14,883
- Northeast: 1,430
- Midwest: 2,821
- South: 8,016
- West: 2,815
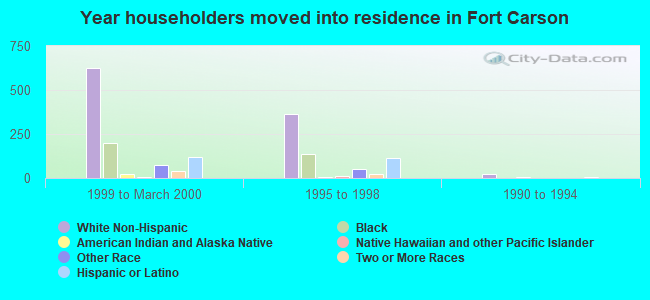
60.5% of Fort Carson residents lived in the same house 1 years ago.
Out of people who lived in different houses, 13.5% lived in this county.
Out of people who lived in different counties, 9.5% lived in Colorado.
| Fort Carson: | 60.5% |
| State average: | 83.6% |
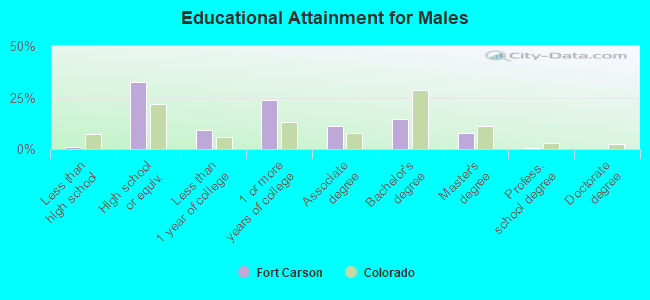
Education attainment for males 25 years and older:
- No schooling: 0
- Nursery to 4th grade: 0
- 5th and 6th grade: 0
- 7th and 8th grade: 0
- 9th grade: 0
- 10th grade: 6
- 11th grade: 0
- 12th grade, no diploma: 25
- High school graduate (or equivalency): 1,158
- Less than 1 year of college: 322
- Some college more than 1 year, no degree: 857
- Associate degree: 407
- Bachelor's degree: 512
- Master's degree: 273
- Professional school degree: 9
- Doctorate degree: 0
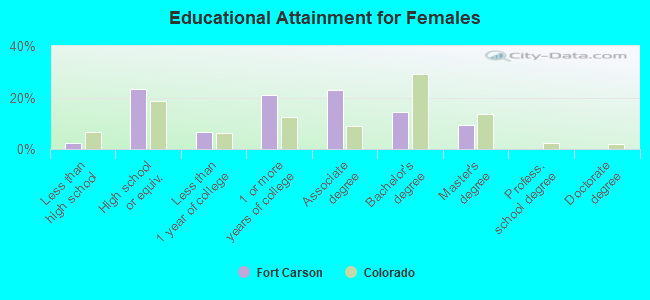
Education attainment for females 25 years and older:
- No schooling: 0
- Nursery to 4th grade: 0
- 5th and 6th grade: 8
- 7th and 8th grade: 0
- 9th grade: 0
- 10th grade: 53
- 11th grade: 0
- 12th grade, no diploma: 5
- High school graduate (or equivalency): 621
- Less than 1 year of college: 179
- Some college more than 1 year, no degree: 558
- Associate degree: 604
- Bachelor's degree: 376
- Master's degree: 245
- Professional school degree: 3
- Doctorate degree: 0
Housing units in structures:
- One, detached: 312
- One, attached: 2,910
- Two: 74
- 3 or 4: 437
- 5 to 9: 55
- 10 to 19: 16
- Mobile homes: 48
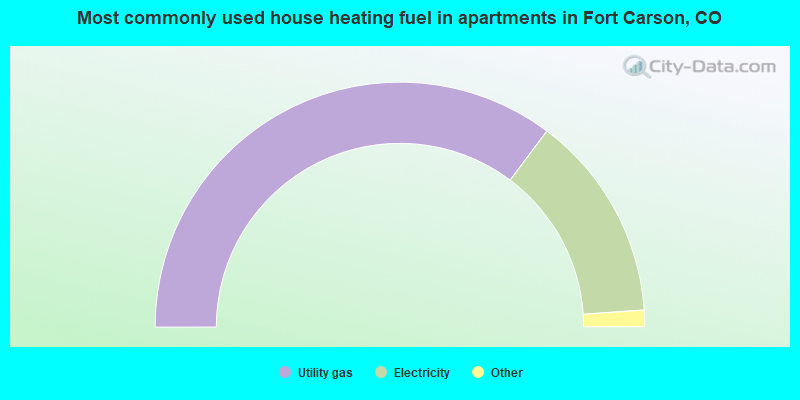
- 70.5%Utility gas
- 27.3%Electricity
- 1.4%Bottled, tank, or LP gas
- 0.8%Solar energy
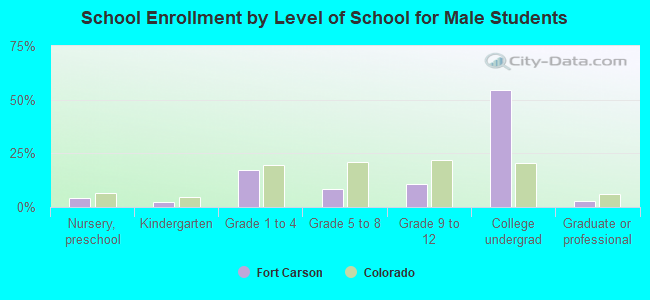
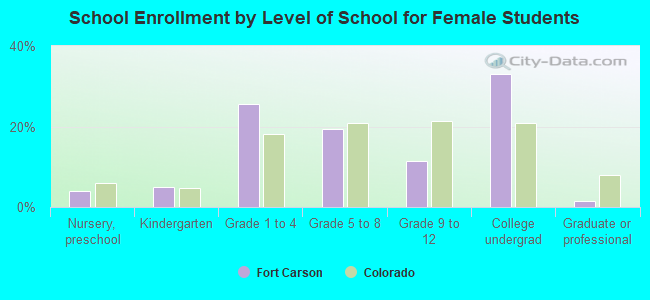
Private vs. public school enrollment:
| Here: | 4.6% |
| Colorado: | 11.4% |
| Here: | 0.5% |
| Colorado: | 8.5% |
| Here: | 5.0% |
| Colorado: | 14.0% |