Fort Bragg, NC (North Carolina) Houses and Residents
| Fort Bragg: | $187,637 |
| North Carolina: | $280,600 |
Total population: 29,731 (Urban population: 29,246, Rural population: 0)
Houses: 4,421 (4,320 occupied: 54 owner occupied, 4,266 renter occupied)
| % of renters here: | 99% |
| State: | 33% |
Housing density: 233 houses/condos per square mile
Median price asked for vacant for-sale houses and condos in 2022 in this county: $76,854.
Median contract rent in 2022: $1,197 (lower quartile is $992, upper quartile is $1,453)
Median gross rent in Fort Bragg, NC in 2022: $1,226
Housing units in Fort Bragg with a mortgage: 8 (0 second mortgage, 0 home equity loan, 0 both second mortgage and home equity loan)
Houses without a mortgage: 15
Compare current foreclosures near Fort Bragg, NC:
| Photo | Address | Area | Beds / Baths | Price | Details |
|---|---|---|---|---|---|

|
#1
La Bonneville Rd
Fort Bragg, NC 28307
|
- sq. feet
|
- baths - beds |
show details | |

|
#2
Le Blanc St
Fort Bragg, NC 28307
|
- sq. feet
|
- baths - beds |
show details | |

|
#3
Tunner St
Fort Bragg, NC 28307
|
- sq. feet
|
- baths - beds |
show details | |

|
#4
Pont L Abby St
Fort Bragg, NC 28307
|
- sq. feet
|
- baths - beds |
show details | |

|
#5
Provider Cir
Fort Bragg, NC 28307
|
- sq. feet
|
- baths - beds |
show details | |

|
#6
Leham St
Fort Bragg, NC 28307
|
- sq. feet
|
- baths - beds |
show details | |

|
#7
Dutch Loop
Fort Bragg, NC 28307
|
- sq. feet
|
- baths - beds |
show details | |

|
#8
Dutch Loop
Fort Bragg, NC 28307
|
- sq. feet
|
- baths - beds |
show details | |

|
#9
Greengate Hill Rd
Fort Bragg, NC 28310
|
- sq. feet
|
- baths - beds |
show details | |

|
#10
Firefly St
Fayetteville, NC 28306
|
1,377 sq. feet
|
1 baths 4 beds |
$255,000
|
show details |
| Photo | Address | Area | Beds / Baths | Price | Details |
|---|---|---|---|---|---|

|
#11
Rock Harbor Ln
Spring Lake, NC 28390
|
- sq. feet
|
2 baths 3 beds |
$202,800
|
show details |

|
#12
Franklin St
Hope Mills, NC 28348
|
- sq. feet
|
2 baths 3 beds |
$99,200
|
show details |

|
#13
Southgate Rd
Fayetteville, NC 28314
|
1,300 sq. feet
|
2 baths 4 beds |
show details | |

|
#14
Wayne Ln
Fayetteville, NC 28304
|
925 sq. feet
|
1 baths 3 beds |
show details | |

|
#15
Nicole Dr
Sanford, NC 27332
|
2,128 sq. feet
|
2 baths 4 beds |
show details | |

|
#16
July Ct
Fayetteville, NC 28314
|
1,350 sq. feet
|
2 baths 3 beds |
show details | |

|
#17
Mourning Dove Pl
Fayetteville, NC 28314
|
1,570 sq. feet
|
2 baths 3 beds |
show details | |

|
#18
Wall St
Fayetteville, NC 28301
|
700 sq. feet
|
1 baths 3 beds |
show details | |

|
#19
Maple Leaf Ct
Fayetteville, NC 28306
|
1,627 sq. feet
|
2 baths 3 beds |
show details | |

|
#20
Cascade St
Fayetteville, NC 28301
|
1,654 sq. feet
|
2 baths 3 beds |
show details |
| Photo | Address | Area | Beds / Baths | Price | Details |
|---|---|---|---|---|---|

|
#21
Porter Rd
Hope Mills, NC 28348
|
1,936 sq. feet
|
2 baths 3 beds |
show details | |

|
#22
Home Stakes Dr
Parkton, NC 28371
|
1,919 sq. feet
|
3 baths 3 beds |
show details | |

|
#23
Crystal Spring Dr
Sanford, NC 27332
|
2,268 sq. feet
|
2 baths 3 beds |
show details | |

|
#24
Expedition Dr
Cameron, NC 28326
|
1,586 sq. feet
|
3 baths 3 beds |
show details | |

|
#25
Winthrop Dr
Fayetteville, NC 28311
|
1,312 sq. feet
|
1 baths 3 beds |
show details | |

|
#26
Lakehurst Dr
Fayetteville, NC 28304
|
1,572 sq. feet
|
2 baths 3 beds |
show details | |

|
#27
Taraway Dr
Fayetteville, NC 28304
|
1,148 sq. feet
|
2 baths 3 beds |
show details | |

|
#28
Cypress Dr
Raeford, NC 28376
|
1,222 sq. feet
|
2 baths 3 beds |
show details | |

|
#29
Lynn Ave
Fayetteville, NC 28301
|
1,360 sq. feet
|
2 baths 3 beds |
show details | |

|
#30
Bayleaf Ln
Sanford, NC 27332
|
1,440 sq. feet
|
2 baths 3 beds |
show details |
| Photo | Address | Area | Beds / Baths | Price | Details |
|---|---|---|---|---|---|

|
#31
Ashfield Dr
Fayetteville, NC 28311
|
2,450 sq. feet
|
3 baths 3 beds |
show details | |

|
#32
Arnish Ct
Fayetteville, NC 28306
|
1,148 sq. feet
|
2 baths 3 beds |
show details | |

|
#33
Rustic Rdg
Hope Mills, NC 28348
|
1,092 sq. feet
|
2 baths 3 beds |
show details | |

|
#34
Bretton Woods Dr
Hope Mills, NC 28348
|
1,096 sq. feet
|
1 baths 3 beds |
show details | |

|
#35
Alexwood Dr
Hope Mills, NC 28348
|
1,493 sq. feet
|
2 baths 3 beds |
show details | |

|
#36
Wingate Rd
Fayetteville, NC 28304
|
1,365 sq. feet
|
2 baths 3 beds |
show details | |

|
#37
Spreading Branch Rd
Hope Mills, NC 28348
|
2,484 sq. feet
|
5 baths 6 beds |
show details | |

|
#38
Stovall Ter
Cameron, NC 28326
|
1,806 sq. feet
|
2 baths 3 beds |
show details | |

|
#39
Dowfield Dr
Fayetteville, NC 28311
|
1,769 sq. feet
|
2 baths 3 beds |
show details | |

|
#40
Spreading Branch Rd
Hope Mills, NC 28348
|
2,789 sq. feet
|
3 baths 4 beds |
show details |
| Photo | Address | Area | Beds / Baths | Price | Details |
|---|---|---|---|---|---|

|
#41
Hedingham Dr
Hope Mills, NC 28348
|
1,566 sq. feet
|
2 baths 4 beds |
show details | |

|
#42
Madison Ave
Fayetteville, NC 28304
|
1,595 sq. feet
|
2 baths 3 beds |
show details | |

|
#43
Sally Hill Cir
Fayetteville, NC 28306
|
1,728 sq. feet
|
2 baths 3 beds |
show details | |

|
#44
Richardson Ave
Fayetteville, NC 28314
|
1,336 sq. feet
|
2 baths 3 beds |
show details | |

|
#45
Reedy Branch Rd
Fayetteville, NC 28312
|
1,354 sq. feet
|
2 baths 3 beds |
show details | |

|
#46
Porto Pl
Fayetteville, NC 28314
|
1,468 sq. feet
|
2 baths 3 beds |
show details | |

|
#47
Rolling Hill Rd
Fayetteville, NC 28304
|
2,000 sq. feet
|
3 baths 3 beds |
show details | |

|
#48
Sunpointe Dr
Hope Mills, NC 28348
|
1,296 sq. feet
|
2 baths 3 beds |
show details | |

|
#49
Anderson Creek School Rd
Bunnlevel, NC 28323
|
1,305 sq. feet
|
1 baths 3 beds |
show details | |

|
Check over 1 million property listings on Foreclosure.com!
|
browse all offers | |||

 | Single family homes turning into shared bedroom rentals (24 replies) |
| Fort Bragg to Fort Liberty (79 replies) |
| rentals in ft bragg area WHEELS ESTATES (4 replies) |
| Rental houses in Fort Bragg area??? (4 replies) |
| House Congressional District 7 Race (0 replies) |
| Need real estate agent in Fayetteville, NC (3 replies) |

Household type by relationship:
Households: 309,274- In family households: 261,535 (50,786 male householders, 32,441 female householders)
54,159 spouses, 96,671 children (88,082 natural, 2,219 adopted, 6,370 stepchildren), 8,879 grandchildren, 3,062 brothers or sisters, 2,567 parents, foster children, 4,219 other relatives, 7,216 non-relatives
- In nonfamily households: 47,739 (18,946 male householders (14,916 living alone)), 20,258 female householders (17,540 living alone)), 8,535 nonrelatives
- In group quarters: 10,157 (1,571 institutionalized population)
52,592 married couples with children.
22,616 single-parent households (3,825 men, 18,791 women).
80.8% of residents of Fort Bragg speak English at home.
12.4% of residents speak Spanish at home (70% speak English very well, 20% speak English well, 9% speak English not well, 1% don't speak English at all).
4.4% of residents speak other Indo-European language at home (70% speak English very well, 23% speak English well, 5% speak English not well, 1% don't speak English at all).
1.7% of residents speak Asian or Pacific Island language at home (57% speak English very well, 33% speak English well, 10% speak English not well).
0.7% of residents speak other language at home (75% speak English very well, 17% speak English well, 9% speak English not well).
Foreign born population: 2,557 (7.9%)
(30.6% of them are naturalized citizens)
| Here: | 5.4 |
| State: | 6.4 |
| Here: | 5.8 |
| State: | 4.4 |
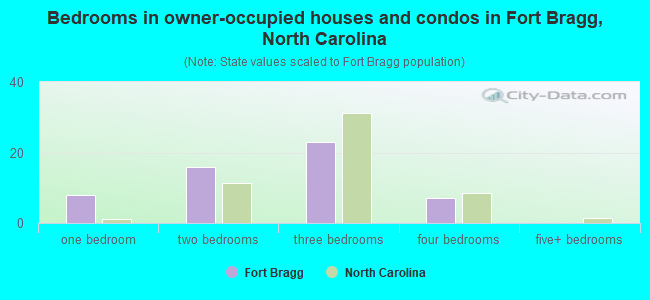
- Bedrooms in owner-occupied houses and condos in Fort Bragg, North Carolina
- 0no bedroom
- 81 bedroom
- 162 bedrooms
- 233 bedrooms
- 74 bedrooms
- 05+ bedrooms
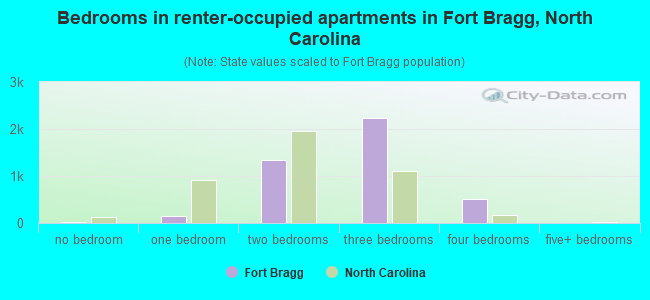
- Bedrooms in renter-occupied apartments in Fort Bragg, North Carolina
- 26no bedroom
- 1481 bedroom
- 1,3502 bedrooms
- 2,2333 bedrooms
- 5094 bedrooms
- 05+ bedrooms
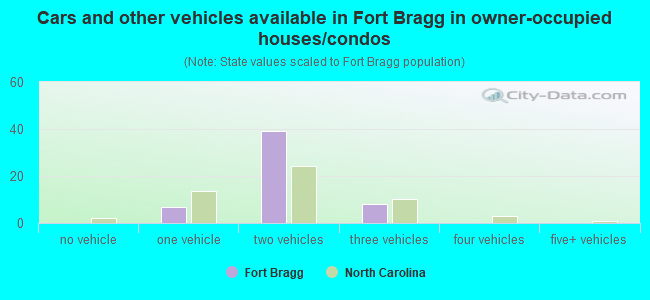
- Cars and other vehicles available in Fort Bragg in owner-occupied houses/condos
- 0no vehicle
- 71 vehicle
- 392 vehicles
- 83 vehicles
- 04 vehicles
- 05+ vehicles
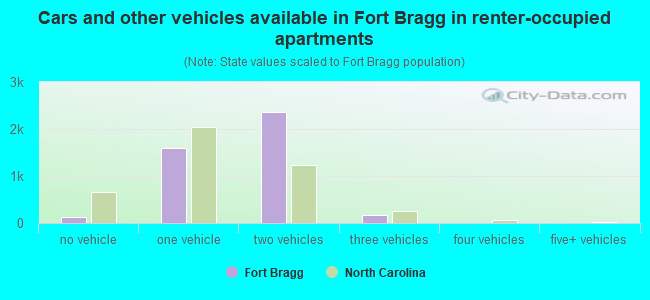
- Cars and other vehicles available in Fort Bragg in renter-occupied apartments
- 127no vehicle
- 1,5991 vehicle
- 2,3642 vehicles
- 1763 vehicles
- 04 vehicles
- 05+ vehicles
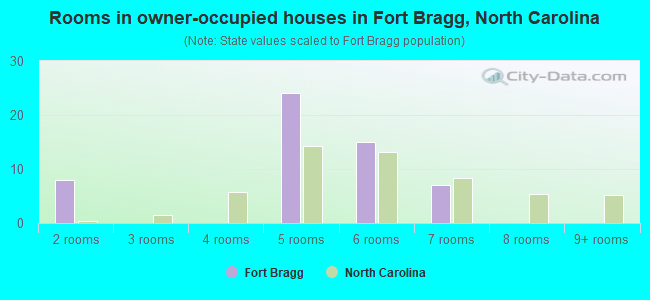
- Rooms in owner-occupied houses in Fort Bragg, North Carolina
- 01 room
- 82 rooms
- 03 rooms
- 04 rooms
- 245 rooms
- 156 rooms
- 77 rooms
- 08 rooms
- 09+ rooms
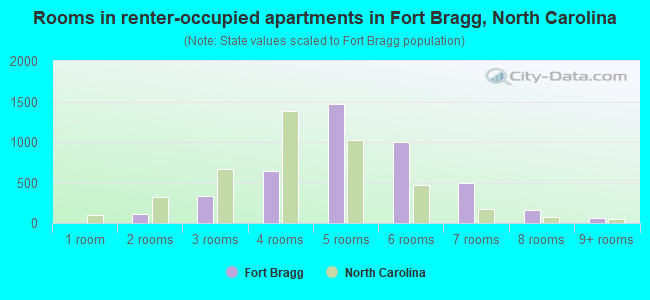
- Rooms in renter-occupied apartments in Fort Bragg, North Carolina
- 61 room
- 1132 rooms
- 3313 rooms
- 6384 rooms
- 1,4675 rooms
- 9946 rooms
- 4927 rooms
- 1628 rooms
- 639+ rooms
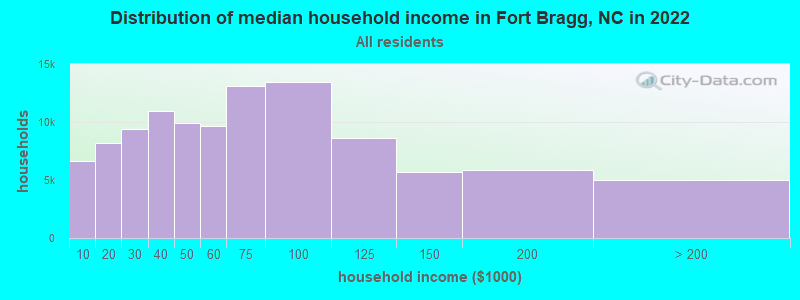
Fort Bragg, NC household income distribution

- 6,633Less than $10,000
- 8,227$10,000 to $19,999
- 9,374$20,000 to $29,999
- 10,924$30,000 to $39,999
- 9,927$40,000 to $49,999
- 9,619$50,000 to $59,999
- 13,081$60,000 to $74,999
- 13,406$75,000 to $99,999
- 8,617$100,000 to $124,999
- 5,692$125,000 to $149,999
- 5,821$150,000 to $199,999
- 5,041$200,000 or more
Percentage of workers working in this county: 94.8%
Number of people working at home: 1,455 (7.5% of all workers)
Travel time to work (commute)
- Less than 5 minutes: 2,798
- 5 to 9 minutes: 5,061
- 10 to 14 minutes: 4,172
- 15 to 19 minutes: 2,239
- 20 to 24 minutes: 1,125
- 25 to 29 minutes: 280
- 30 to 34 minutes: 538
- 35 to 39 minutes: 42
- 40 to 44 minutes: 19
- 45 to 59 minutes: 176
- 60 to 89 minutes: 114
- 90 or more minutes: 112
Means of transportation to work:
- Drove a car alone: 8,462 (47.5%)
- Carpooled: 3,265 (18.3%)
- Bus or trolley bus: 32 (0.2%)
- Ferryboat: 11 (0.1%)
- Motorcycle: 20 (0.1%)
- Bicycle: 60 (0.3%)
- Walked: 4,358 (24.5%)
- Other means: 468 (2.6%)
- Worked at home: 1,128 (6.3%)
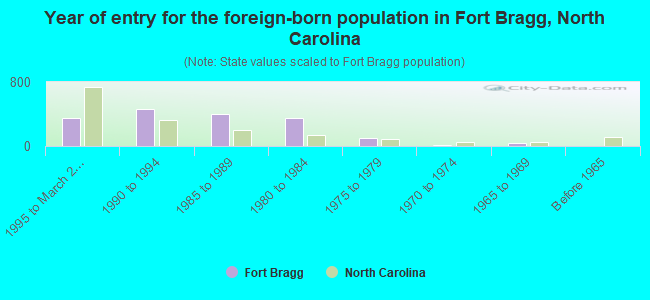
- Year of entry for the foreign-born population in Fort Bragg, North Carolina
- 3461995 to March 2000
- 4571990 to 1994
- 3941985 to 1989
- 3551980 to 1984
- 1021975 to 1979
- 101970 to 1974
- 411965 to 1969
- 0Before 1965
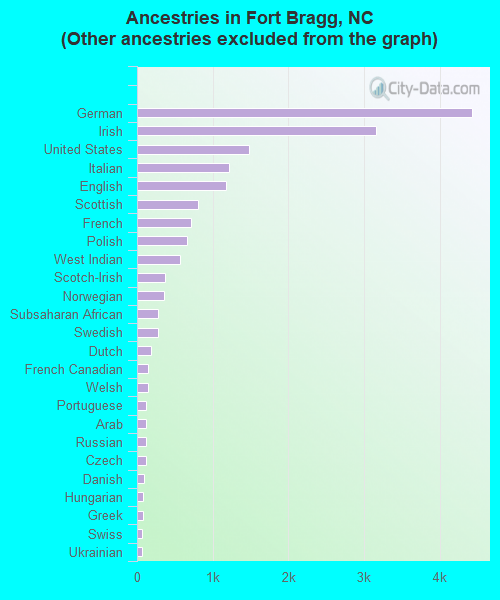
First ancestries reported:
- Other: 14,431 (46.1%)
- German: 4,432 (14.2%)
- Irish: 3,158 (10.1%)
- United States: 1,485 (4.7%)
- Italian: 1,213 (3.9%)
- English: 1,180 (3.8%)
- Scottish: 809 (2.6%)
- French: 709 (2.3%)
- Polish: 661 (2.1%)
- West Indian: 572 (1.8%)
- Scotch-Irish: 369 (1.2%)
- Norwegian: 360 (1.2%)
- Subsaharan African: 281 (0.9%)
- Swedish: 280 (0.9%)
- Dutch: 184 (0.6%)
- French Canadian: 147 (0.5%)
- Welsh: 143 (0.5%)
- Portuguese: 120 (0.4%)
- Arab: 119 (0.4%)
- Russian: 114 (0.4%)
- Czech: 113 (0.4%)
- Danish: 91 (0.3%)
- Hungarian: 85 (0.3%)
- Greek: 81 (0.3%)
- Swiss: 64 (0.2%)
- Ukrainian: 63 (0.2%)
- Slovak: 31 (0.10%)
- Lithuanian: 8 (0.03%)
Most common places of birth for foreign-born residents (%):
| Fort Bragg: | 11.3% (193) |
| North Carolina: | 40.0% (172,065) |
| Fort Bragg: | 7.9% (135) |
| North Carolina: | 3.8% (16,166) |
| Fort Bragg: | 7.9% (134) |
| North Carolina: | 2.3% (9,836) |
| Fort Bragg: | 6.5% (111) |
| North Carolina: | 1.9% (8,237) |
| Fort Bragg: | 5.9% (100) |
| North Carolina: | 0.3% (1,203) |
| Fort Bragg: | 4.3% (74) |
| North Carolina: | 0.6% (2,436) |
| Fort Bragg: | 3.8% (64) |
| North Carolina: | 0.8% (3,443) |
| Fort Bragg: | 3.7% (63) |
| North Carolina: | 0.4% (1,621) |
| Fort Bragg: | 3.1% (53) |
| North Carolina: | 1.3% (5,529) |
| Fort Bragg: | 3.0% (52) |
| North Carolina: | 2.5% (10,559) |
| Fort Bragg: | 2.9% (49) |
| North Carolina: | 3.3% (14,317) |
| Fort Bragg: | 2.6% (44) |
| North Carolina: | 0.7% (2,841) |
| Fort Bragg: | 2.4% (41) |
| North Carolina: | 0.2% (1,034) |
| Fort Bragg: | 2.3% (40) |
| North Carolina: | 0.5% (2,044) |
| Fort Bragg: | 2.1% (36) |
| North Carolina: | 0.4% (1,593) |
| Fort Bragg: | 1.9% (33) |
| North Carolina: | 0.8% (3,334) |
| Fort Bragg: | 1.9% (32) |
| North Carolina: | 0.5% (2,246) |
| Fort Bragg: | 1.8% (30) |
| North Carolina: | 0.3% (1,145) |
| Fort Bragg: | 1.6% (28) |
| North Carolina: | 0.5% (2,068) |
| Fort Bragg: | 1.6% (27) |
| North Carolina: | 0.4% (1,728) |
Place of birth for U.S.-born residents:
- This state: 3,419
- Other state: 21,978
- Northeast: 3,638
- Midwest: 4,503
- South: 9,432
- West: 4,405
11% of Fort Bragg residents lived in the same house 5 years ago.
Out of people who lived in different houses, 10% lived in this county.
Out of people who lived in different counties, 5% lived in North Carolina.
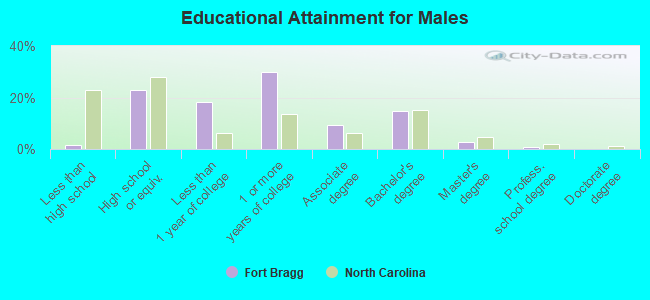
Education attainment for males 25 years and older:
- No schooling: 0
- Nursery to 4th grade: 0
- 5th and 6th grade: 15
- 7th and 8th grade: 9
- 9th grade: 15
- 10th grade: 43
- 11th grade: 0
- 12th grade, no diploma: 23
- High school graduate (or equivalency): 1,459
- Less than 1 year of college: 1,180
- Some college more than 1 year, no degree: 1,915
- Associate degree: 586
- Bachelor's degree: 944
- Master's degree: 170
- Professional school degree: 43
- Doctorate degree: 6
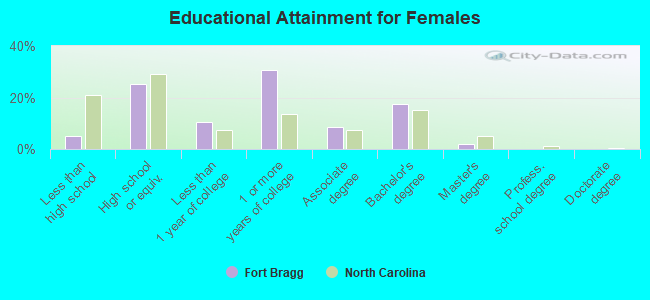
Education attainment for females 25 years and older:
- No schooling: 9
- Nursery to 4th grade: 9
- 5th and 6th grade: 0
- 7th and 8th grade: 22
- 9th grade: 15
- 10th grade: 37
- 11th grade: 12
- 12th grade, no diploma: 74
- High school graduate (or equivalency): 866
- Less than 1 year of college: 365
- Some college more than 1 year, no degree: 1,045
- Associate degree: 295
- Bachelor's degree: 603
- Master's degree: 70
- Professional school degree: 0
- Doctorate degree: 0


Housing units in structures:
- One, detached: 958
- One, attached: 1,706
- Two: 209
- 3 or 4: 686
- 5 to 9: 811
- 10 to 19: 8
- 50 or more: 35
- Mobile homes: 8
Median worth of mobile homes: $20,211
Housing units lacking complete kitchen facilities: 0.7%
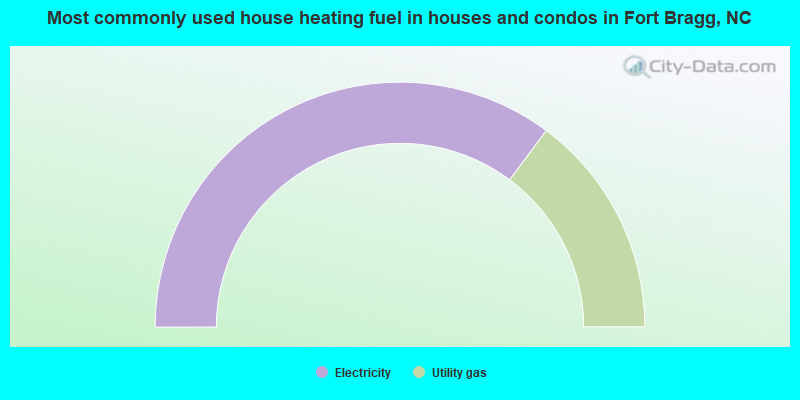
- 70.4%Electricity
- 29.6%Utility gas

- 77.1%Electricity
- 20.5%Utility gas
- 1.0%No fuel used
- 0.6%Bottled, tank, or LP gas
- 0.4%Other fuel
- 0.4%Fuel oil, kerosene, etc.
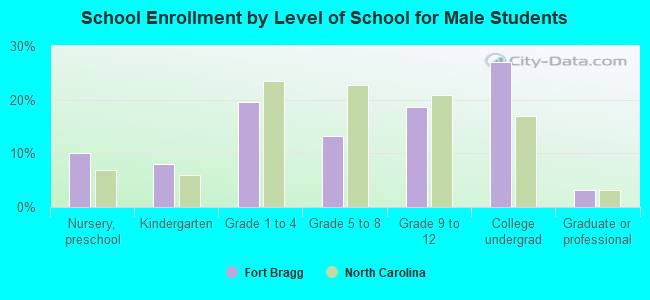
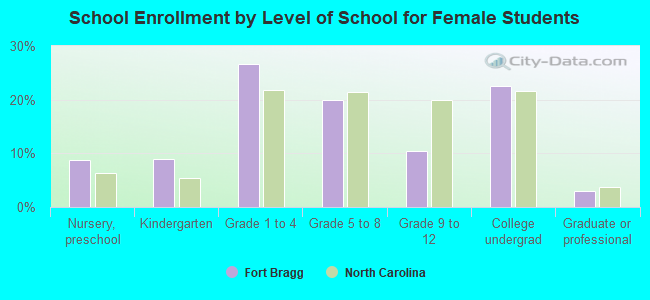
Private vs. public school enrollment:
| Here: | 6.6% |
| North Carolina: | 8.2% |
| Here: | 12.3% |
| North Carolina: | 6.9% |
| Here: | 20.5% |
| North Carolina: | 20.2% |