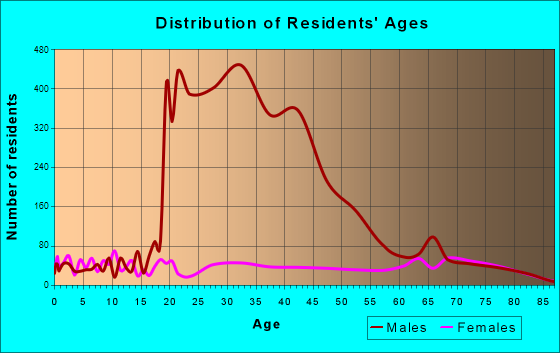
Florence, AZ (Arizona) Houses and Residents
| Florence: | $403,832 |
| Arizona: | $402,800 |
Total population: 26,912 (Urban population: 16,869 (all inside urban clusters), Rural population: 280 (all nonfarm))
Houses: 7,529 (5,999 occupied: 5,083 owner occupied, 1,064 renter occupied)
| % of renters here: | 17% |
| State: | 33% |
Housing density: 908 houses/condos per square mile
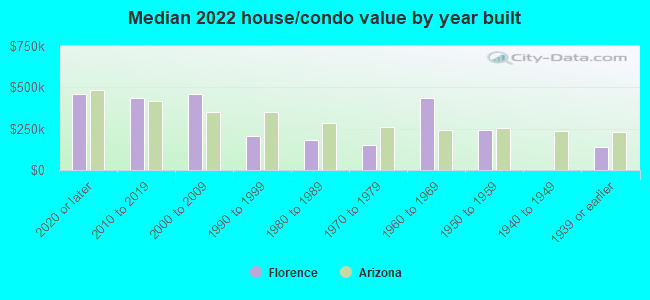
Median price asked for vacant for-sale houses and condos in 2022: $484,579.
Median contract rent in 2022: $1,081 (lower quartile is $677, upper quartile is $1,310)
Median rent asked for vacant for-rent units in 2022: $1,573
Median gross rent in Florence, AZ in 2022: $1,284
Housing units in Florence with a mortgage: 2,868 (248 second mortgage, 0 home equity loan, 95 both second mortgage and home equity loan)
Houses without a mortgage: 36
Median household income for houses/condos with a mortgage: $89,375
Median household income for apartments without a mortgage: $74,671
Median monthly housing costs: $1,066
Compare current foreclosures in Florence, AZ:
| Photo | Address | Area | Beds / Baths | Price | Details |
|---|---|---|---|---|---|

|
#1
N Yucca Dr
Florence, AZ 85132
|
1,541 sq. feet
|
2 baths 3 beds |
show details | |

|
#2
N Mojave Ln
Florence, AZ 85132
|
1,281 sq. feet
|
2 baths 3 beds |
show details | |

|
#3
E Refuge Rd
Florence, AZ 85132
|
2,220 sq. feet
|
3 baths 5 beds |
show details | |

|
#4
N Poseidon Rd
Florence, AZ 85132
|
2,725 sq. feet
|
3 baths 5 beds |
show details | |

|
#5
N Mulberry St
Florence, AZ 85132
|
1,998 sq. feet
|
3 baths 3 beds |
show details | |

|
#6
E Darlene Drive
Florence, AZ 85132
|
2,025 sq. feet
|
2 baths 4 beds |
show details | |

|
#7
E Echo Ln
Florence, AZ 85132
|
1,511 sq. feet
|
2 baths 3 beds |
show details | |

|
#8
E Lupine Ln
Florence, AZ 85132
|
1,540 sq. feet
|
2 baths 3 beds |
show details | |

|
#9
N Nectar Ave
Florence, AZ 85132
|
1,280 sq. feet
|
2 baths 3 beds |
show details | |

|
#10
N Locust St
Florence, AZ 85132
|
1,792 sq. feet
|
- baths - beds |
show details |
| Photo | Address | Area | Beds / Baths | Price | Details |
|---|---|---|---|---|---|

|
#11
W Willow Way
Florence, AZ 85132
|
- sq. feet
|
- baths - beds |
show details | |

|
#12
N Mulberry St
Florence, AZ 85132
|
- sq. feet
|
- baths - beds |
show details | |

|
#13
E Oasis Blvd
Florence, AZ 85132
|
- sq. feet
|
- baths - beds |
show details | |

|
#14
Locust Dr
Florence, AZ 85132
|
- sq. feet
|
- baths - beds |
show details | |

|
#15
S Elizabeth St
Florence, AZ 85132
|
- sq. feet
|
- baths - beds |
show details | |

|
#16
E Aster Ln
Florence, AZ 85132
|
- sq. feet
|
- baths - beds |
show details | |

|
#17
E Lupine Ln
Florence, AZ 85132
|
2,418 sq. feet
|
- baths - beds |
show details | |

|
#18
E San Tan Way
Florence, AZ 85132
|
1,603 sq. feet
|
- baths - beds |
show details | |

|
#19
N White Star Ln
Florence, AZ 85132
|
1,500 sq. feet
|
- baths - beds |
show details | |

|
#20
E Verbina Ln
Florence, AZ 85132
|
- sq. feet
|
- baths - beds |
show details |
| Photo | Address | Area | Beds / Baths | Price | Details |
|---|---|---|---|---|---|

|
#21
N Lost Dutchman Way
Florence, AZ 85132
|
2,172 sq. feet
|
- baths - beds |
show details | |

|
#22
N Good Pasture Ln
Florence, AZ 85132
|
- sq. feet
|
- baths - beds |
show details | |

|
#23
E Chuparosa Ln
Florence, AZ 85132
|
- sq. feet
|
- baths - beds |
show details | |

|
#24
N Huntington Dr
Florence, AZ 85132
|
- sq. feet
|
- baths - beds |
show details | |

|
#25
N Abel Pl
Florence, AZ 85132
|
- sq. feet
|
- baths - beds |
show details | |

|
#26
N Bluegrass St
Florence, AZ 85132
|
- sq. feet
|
- baths - beds |
show details | |

|
#27
N Highway 79, Lot E85
Florence, AZ 85132
|
- sq. feet
|
- baths - beds |
show details | |

|
#28
W Rushmore Way
Florence, AZ 85132
|
- sq. feet
|
- baths - beds |
show details | |

|
#29
N Red Rock Way
Florence, AZ 85132
|
- sq. feet
|
- baths - beds |
show details | |

|
#30
N Mesquite Cir
Florence, AZ 85132
|
2,404 sq. feet
|
- baths - beds |
show details |
| Photo | Address | Area | Beds / Baths | Price | Details |
|---|---|---|---|---|---|

|
#31
N Crestwood Dr
Florence, AZ 85132
|
- sq. feet
|
- baths - beds |
show details | |

|
#32
E Oasis Blvd
Florence, AZ 85132
|
- sq. feet
|
- baths - beds |
show details | |

|
#33
N Yucca Dr
Florence, AZ 85132
|
- sq. feet
|
- baths - beds |
show details | |

|
#34
E Haven Ave
Florence, AZ 85132
|
- sq. feet
|
- baths - beds |
show details | |

|
#35
E Four Peaks Way
Florence, AZ 85132
|
1,510 sq. feet
|
- baths - beds |
show details | |

|
#36
W Georgetown Way
Florence, AZ 85132
|
- sq. feet
|
- baths - beds |
show details | |

|
#37
N Bluegrass St
Florence, AZ 85132
|
- sq. feet
|
- baths - beds |
show details | |

|
#38
W Rushmore Way
Florence, AZ 85132
|
4,110 sq. feet
|
- baths - beds |
show details | |

|
#39
E Silo Rd
Florence, AZ 85132
|
- sq. feet
|
- baths - beds |
show details | |

|
#40
N Comiskey Dr
Florence, AZ 85132
|
- sq. feet
|
- baths - beds |
show details |
| Photo | Address | Area | Beds / Baths | Price | Details |
|---|---|---|---|---|---|

|
#41
N Palo Verde Rd
Florence, AZ 85132
|
1,008 sq. feet
|
- baths - beds |
show details | |

|
#42
E Pine Way
Florence, AZ 85132
|
1,505 sq. feet
|
- baths - beds |
show details | |

|
#43
E Harvest Rd
Florence, AZ 85132
|
- sq. feet
|
- baths - beds |
show details | |

|
#44
W Cedar Ave
Florence, AZ 85132
|
- sq. feet
|
- baths - beds |
show details | |

|
#45
E Barley Rd
Florence, AZ 85132
|
- sq. feet
|
- baths - beds |
show details | |

|
#46
E Lancaster Ct
Florence, AZ 85132
|
- sq. feet
|
- baths - beds |
show details | |

|
#47
N Nectar Ave
Florence, AZ 85132
|
1,280 sq. feet
|
- baths - beds |
show details | |

|
#48
N Oasis Blvd
Florence, AZ 85132
|
2,220 sq. feet
|
- baths - beds |
show details | |

|
#49
W Desert Blossom Way
Florence, AZ 85132
|
- sq. feet
|
- baths - beds |
show details | |

|
Check over 1 million property listings on Foreclosure.com!
|
browse all offers | |||

Latest news about housing in Florence, AZ collected exclusively by city-data.com from local newspapers, TV, and radio stations

 | Phoenix Home of the Low Income (46 replies) |
| Housing Bubble? (170 replies) |
| Mesa/Apache Junction/San Tan Valley areas? (23 replies) |
| Houses for $60-$80k in San Tan Valley??? REALLY?!?!?! (42 replies) |
| Anthem at Merrill Ranch Florence (18 replies) |
| Verrado....gimme your pros and cons PLEASE (65 replies) |
Median year apartment built: 1997
Household type by relationship:
Households: 27,616- Male householders: 2,962 (712 living alone), Female householders: 3,110 (786 living alone)
3,393 spouses (3,385 opposite-sex spouses), 727 unmarried partners, (703 opposite-sex unmarried partners), 2,441 children (2,121 natural, 38 adopted, 280 stepchildren), 357 grandchildren, 87 brothers or sisters, 161 parents, 0 foster children, 298 other relatives, 473 non-relatives
- In group quarters: 13,602
Size of family households: 2,461 2-persons, 559 3-persons, 487 4-persons, 102 5-persons, 173 6-persons, 67 7-or-more-persons.
Size of nonfamily households: 1,624 1-person, 641 2-persons, 30 4-persons.
1,185 married couples with children.
374 single-parent households (224 men, 150 women).
72.1% of residents of Florence speak English at home.
22.8% of residents speak Spanish at home (67% speak English very well, 11% speak English well, 12% speak English not well, 10% don't speak English at all).
2.1% of residents speak other Indo-European language at home (100% speak English very well).
1.4% of residents speak Asian or Pacific Island language at home (79% speak English very well, 7% speak English well, 14% speak English not well).
2.0% of residents speak other language at home (93% speak English very well, 7% speak English well).
Foreign born population: 3,548 (12.8%)
(28.7% of them are naturalized citizens)
| Here: | 5.7 |
| State: | 6.0 |
| Here: | 4.4 |
| State: | 4.1 |
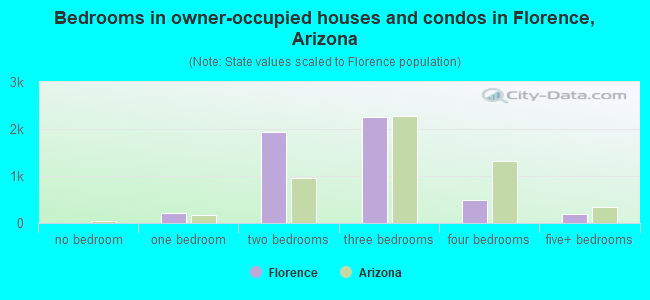
- Bedrooms in owner-occupied houses and condos in Florence, Arizona
- 0no bedroom
- 2221 bedroom
- 1,9452 bedrooms
- 2,2493 bedrooms
- 4814 bedrooms
- 1855+ bedrooms
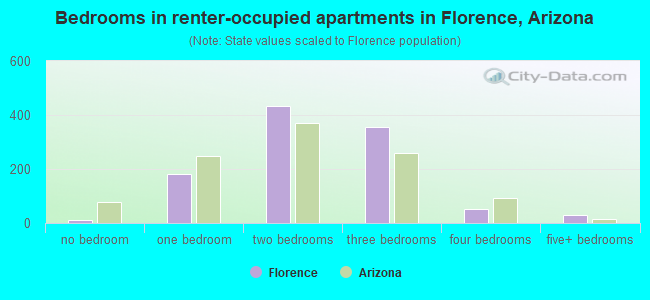
- Bedrooms in renter-occupied apartments in Florence, Arizona
- 10no bedroom
- 1811 bedroom
- 4352 bedrooms
- 3573 bedrooms
- 514 bedrooms
- 315+ bedrooms
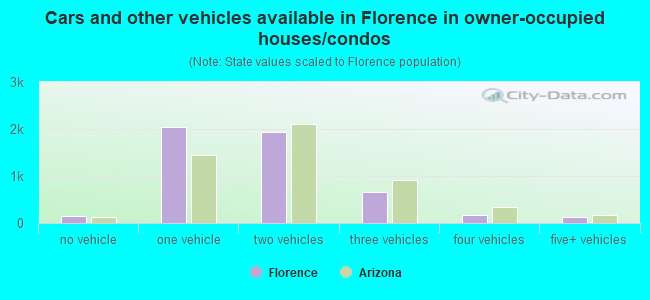
- Cars and other vehicles available in Florence in owner-occupied houses/condos
- 158no vehicle
- 2,0321 vehicle
- 1,9352 vehicles
- 6673 vehicles
- 1604 vehicles
- 1315+ vehicles
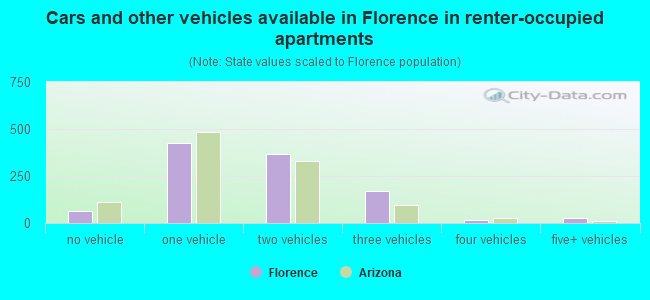
- Cars and other vehicles available in Florence in renter-occupied apartments
- 65no vehicle
- 4231 vehicle
- 3672 vehicles
- 1713 vehicles
- 154 vehicles
- 245+ vehicles
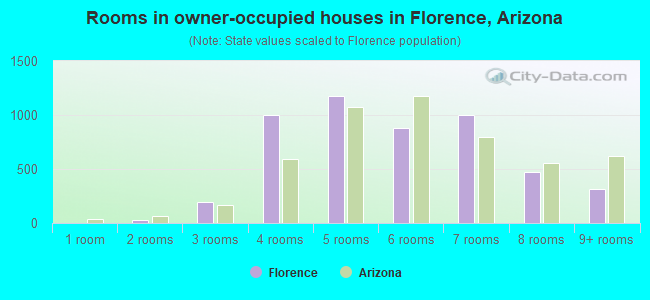
- Rooms in owner-occupied houses in Florence, Arizona
- 01 room
- 302 rooms
- 1963 rooms
- 1,0044 rooms
- 1,1775 rooms
- 8846 rooms
- 1,0037 rooms
- 4758 rooms
- 3149+ rooms
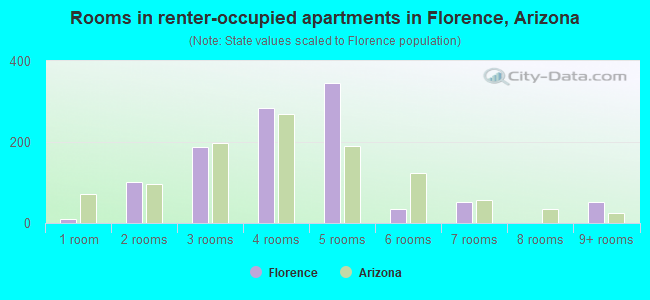
- Rooms in renter-occupied apartments in Florence, Arizona
- 101 room
- 1012 rooms
- 1873 rooms
- 2834 rooms
- 3465 rooms
- 356 rooms
- 517 rooms
- 08 rooms
- 539+ rooms
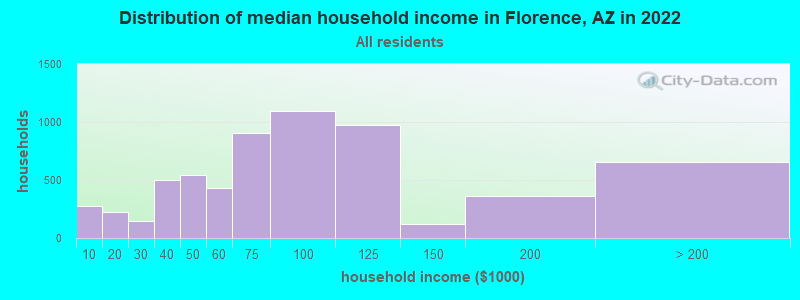
Florence, AZ household income distribution

- 275Less than $10,000
- 226$10,000 to $19,999
- 145$20,000 to $29,999
- 499$30,000 to $39,999
- 545$40,000 to $49,999
- 427$50,000 to $59,999
- 907$60,000 to $74,999
- 1,097$75,000 to $99,999
- 978$100,000 to $124,999
- 124$125,000 to $149,999
- 362$150,000 to $199,999
- 651$200,000 or more
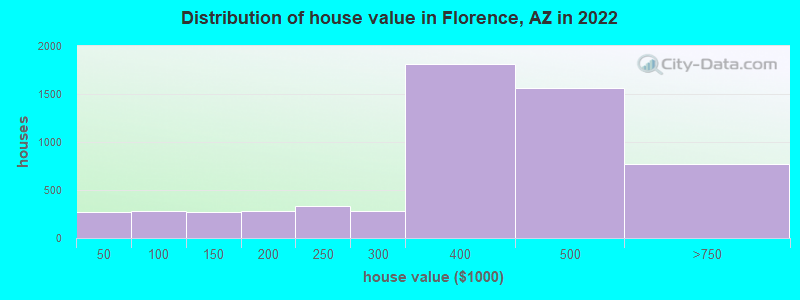
Home value of owner - occupied houses in 2022 in Florence, AZ
-
- 14$10,000 to $14,999
- 18$15,000 to $19,999
- 56$20,000 to $24,999
- 113$35,000 to $39,999
- 64$40,000 to $49,999
- 88$50,000 to $59,999
- 2$60,000 to $69,999
- 50$70,000 to $79,999
- 44$80,000 to $89,999
- 31$90,000 to $99,999
- 200$100,000 to $124,999
- 73$125,000 to $149,999
- 253$150,000 to $174,999
- 31$175,000 to $199,999
- 334$200,000 to $249,999
- 284$250,000 to $299,999
- 1,812$300,000 to $399,999
- 1,559$400,000 to $499,999
- 766$500,000 to $749,999
- 5$1,000,000 to $1,499,999
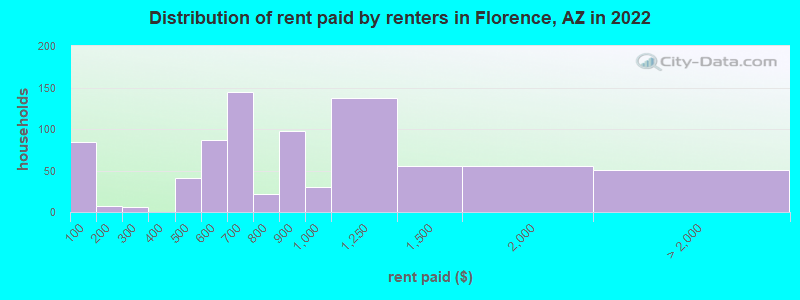
Rent paid by renters in 2022 in Florence, AZ
-
- 84Less than $100
- 7$150 to $199
- 6$200 to $249
- 41$400 to $449
- 83$500 to $549
- 3$550 to $599
- 119$600 to $649
- 25$650 to $699
- 16$700 to $749
- 4$750 to $799
- 97$800 to $899
- 29$900 to $999
- 137$1,000 to $1,249
- 54$1,250 to $1,499
- 55$1,500 to $1,999
- 50No cash rent
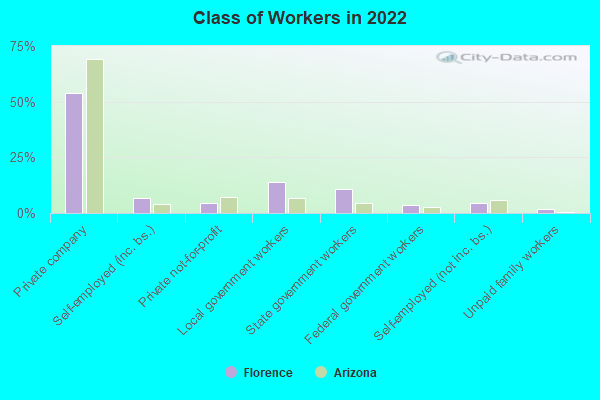
Percentage of workers working in this county: 75.0%
Number of people working at home: 1,060 (20.5% of all workers)
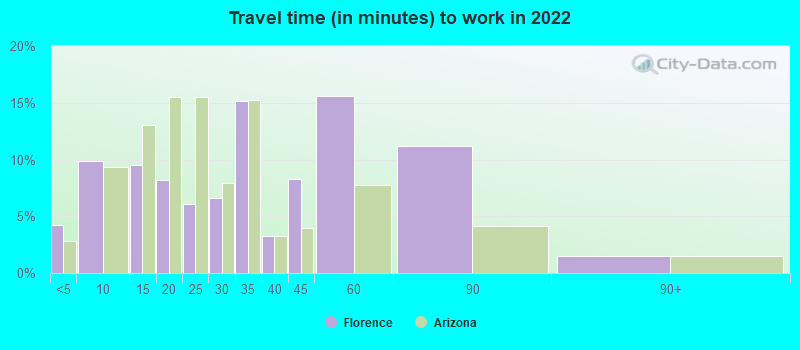
Travel time to work (commute)
- Less than 5 minutes: 251
- 5 to 9 minutes: 943
- 10 to 14 minutes: 436
- 15 to 19 minutes: 226
- 20 to 24 minutes: 159
- 25 to 29 minutes: 132
- 30 to 34 minutes: 127
- 35 to 39 minutes: 141
- 40 to 44 minutes: 253
- 45 to 59 minutes: 561
- 60 to 89 minutes: 733
- 90 or more minutes: 121
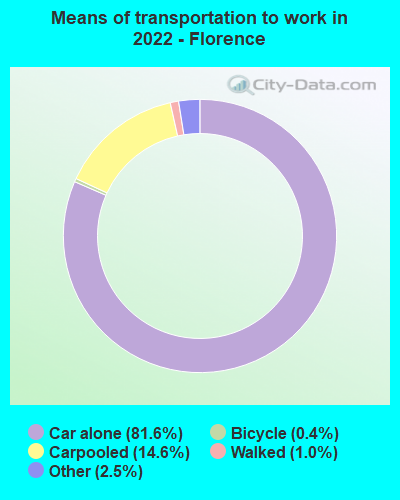
Means of transportation to work:
- Drove a car alone: 6,008 (70.0%)
- Carpooled: 1,129 (13.2%)
- Taxi: 206 (2.4%)
- Bicycle: 22 (0.3%)
- Walked: 78 (0.9%)
- Worked at home: 984 (11.5%)
- Unemployment by race in 2022
- Unemployment rate for White non-Hispanic residents
- 3.1%Males
- 7.8%Females
- Unemployment rate for Black residents
- 1.6%Males
- 29.8%Females
- Unemployment rate for American Indian and Alaska Native residents
- 27.9%Males
- Unemployment rate for two or more race residents
- 41.1%Males
- 27.0%Females
- Unemployment rate for Hispanic or Latino residents
- 10.1%Males
- 1.6%Females
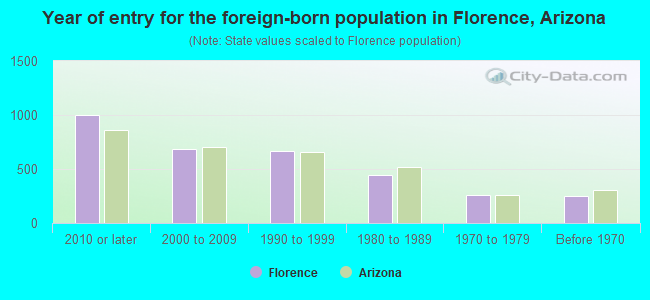
- Year of entry for the foreign-born population in Florence, Arizona
- 1,0002010 or later
- 6872000 to 2009
- 6641990 to 1999
- 4461980 to 1989
- 2581970 to 1979
- 253Before 1970
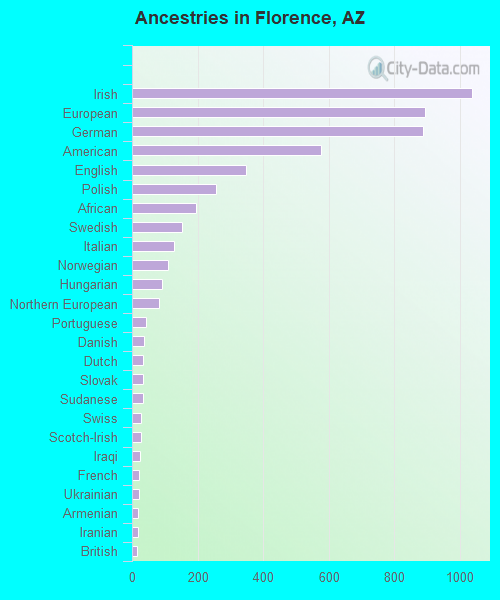
First ancestries reported:
- Irish: 1,038 (6.9%)
- European: 896 (6.0%)
- German: 888 (5.9%)
- American: 576 (3.8%)
- English: 347 (2.3%)
- Polish: 256 (1.7%)
- African: 196 (1.3%)
- Swedish: 153 (1.0%)
- Italian: 128 (0.9%)
- Norwegian: 111 (0.7%)
- Hungarian: 93 (0.6%)
- Northern European: 82 (0.5%)
- Portuguese: 44 (0.3%)
- Danish: 37 (0.2%)
- Dutch: 35 (0.2%)
- Slovak: 35 (0.2%)
- Sudanese: 34 (0.2%)
- Swiss: 29 (0.2%)
- Scotch-Irish: 26 (0.2%)
- Iraqi: 23 (0.2%)
- French: 22 (0.1%)
- Ukrainian: 22 (0.1%)
- Armenian: 19 (0.1%)
- Iranian: 17 (0.1%)
- British: 15 (0.10%)
- Czech: 13 (0.09%)
- Welsh: 12 (0.08%)
- Haitian: 11 (0.07%)
- Ethiopian: 9 (0.06%)
- Greek: 5 (0.03%)
- French Canadian: 4 (0.03%)
- Scottish: 3 (0.02%)
Most common places of birth for foreign-born residents (%):
| Florence: | 72.3% (2,253) |
| Arizona: | 53.4% (500,086) |
| Florence: | 5.5% (171) |
| Arizona: | 4.3% (40,102) |
| Florence: | 3.5% (110) |
| Arizona: | 3.2% (30,378) |
| Florence: | 2.9% (89) |
| Arizona: | 0.2% (1,468) |
| Florence: | 2.2% (69) |
| Arizona: | 1.6% (14,556) |
Place of birth for U.S.-born residents:
- This state: 9,405
- Other state: 14,313
- Northeast: 1,685
- Midwest: 5,031
- South: 1,643
- West: 5,965
81.1% of Florence residents lived in the same house 1 years ago.
Out of people who lived in different houses, 21.6% lived in this county.
Out of people who lived in different counties, 68.0% lived in Arizona.
| Florence: | 81.1% |
| State average: | 86.0% |
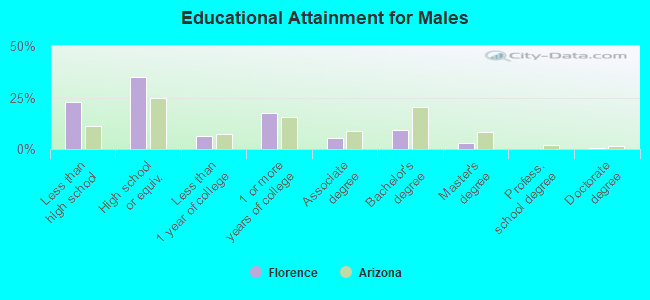
Education attainment for males 25 years and older:
- No schooling: 355
- Nursery to 4th grade: 81
- 5th and 6th grade: 255
- 7th and 8th grade: 840
- 9th grade: 310
- 10th grade: 695
- 11th grade: 868
- 12th grade, no diploma: 632
- High school graduate (or equivalency): 6,113
- Less than 1 year of college: 1,102
- Some college more than 1 year, no degree: 3,078
- Associate degree: 963
- Bachelor's degree: 1,636
- Master's degree: 517
- Professional school degree: 33
- Doctorate degree: 71
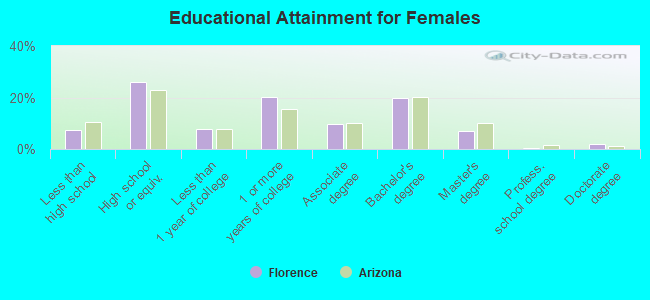
Education attainment for females 25 years and older:
- No schooling: 52
- Nursery to 4th grade: 0
- 5th and 6th grade: 108
- 7th and 8th grade: 88
- 9th grade: 25
- 10th grade: 41
- 11th grade: 87
- 12th grade, no diploma: 22
- High school graduate (or equivalency): 1,490
- Less than 1 year of college: 437
- Some college more than 1 year, no degree: 1,150
- Associate degree: 553
- Bachelor's degree: 1,141
- Master's degree: 412
- Professional school degree: 20
- Doctorate degree: 119
Housing units in structures:
- One, detached: 5,036
- One, attached: 193
- Two: 52
- 3 or 4: 99
- 5 to 9: 278
- 10 to 19: 52
- 20 to 49: 86
- 50 or more: 19
- Mobile homes: 1,673
- Boats, RVs, vans, etc.: 35
Median worth of mobile homes: $128,157
Housing units lacking complete kitchen facilities in 2022: 0.5%
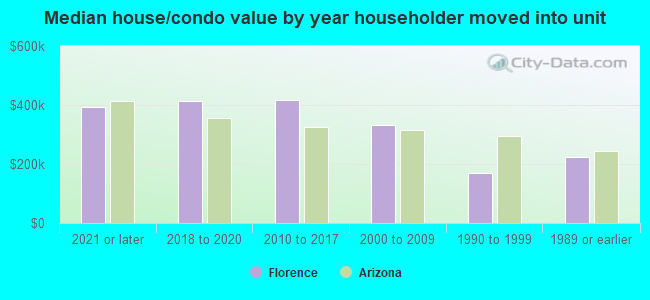
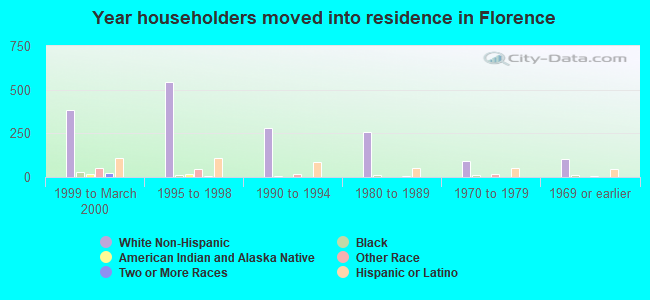
House/condo owner moved in on average 3 years ago
Renter moved in on average 1 years ago
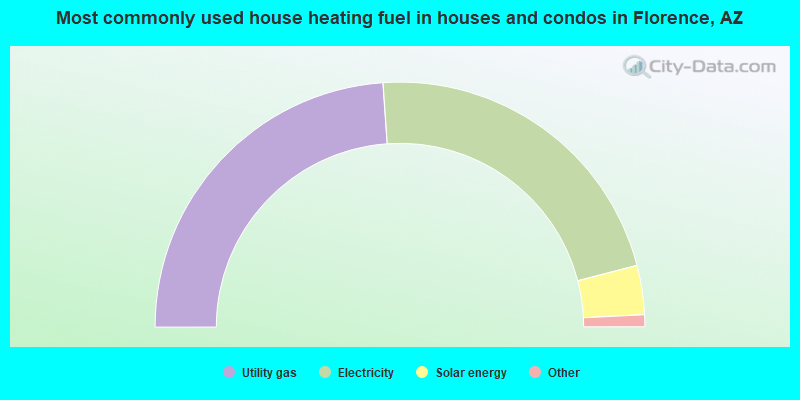
- 47.8%Utility gas
- 44.1%Electricity
- 6.5%Solar energy
- 0.9%Bottled, tank, or LP gas
- 0.7%No fuel used
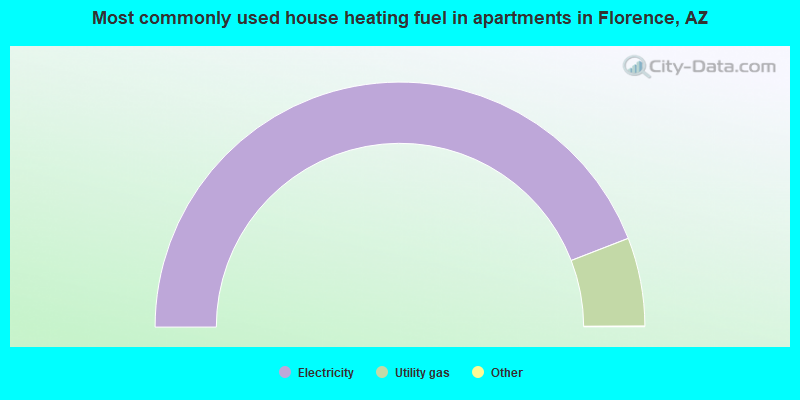
- 88.3%Electricity
- 11.7%Utility gas
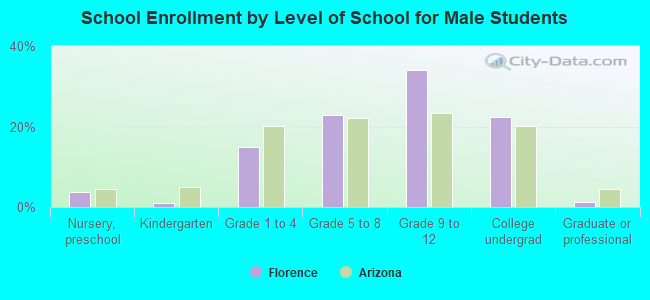
Private vs. public school enrollment:
| Here: | 4.0% |
| Arizona: | 10.4% |
| Here: | 25.0% |
| Arizona: | 8.8% |
| Here: | 6.8% |
| Arizona: | 13.1% |