Housing density: 509 houses/condos per square mile
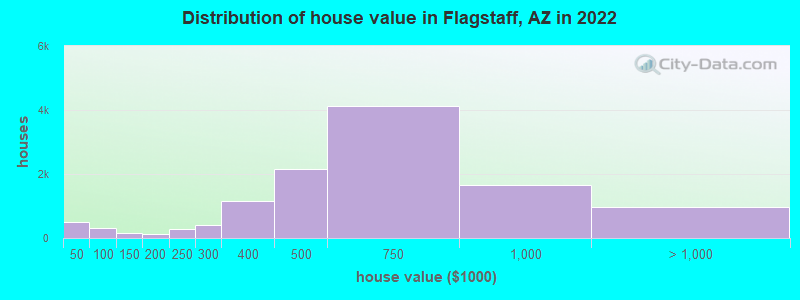
Median price asked for vacant for-sale houses and condos in 2022: $426,644.
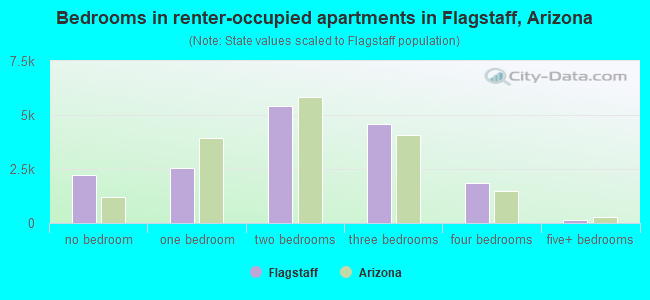
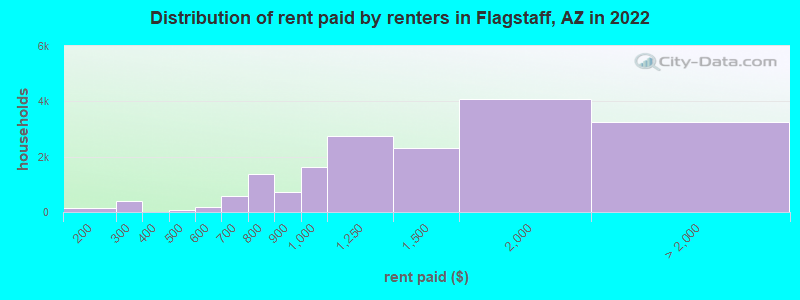
Median contract rent in 2022: $1,301 (lower quartile is $949, upper quartile is $1,810)
Median rent asked for vacant for-rent units in 2022: $2,886
Median gross rent in Flagstaff, AZ in 2022: $1,409
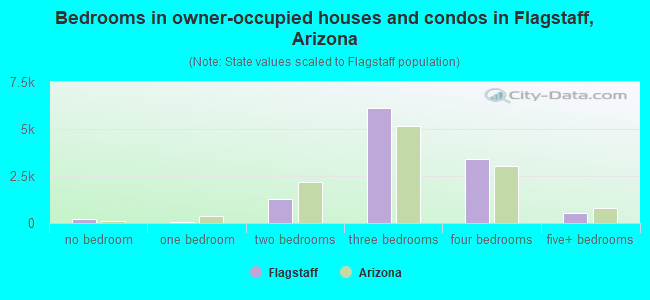
Housing units in Flagstaff with a mortgage: 7,865 (624 second mortgage, 49 home equity loan, 575 both second mortgage and home equity loan) Houses without a mortgage: 500
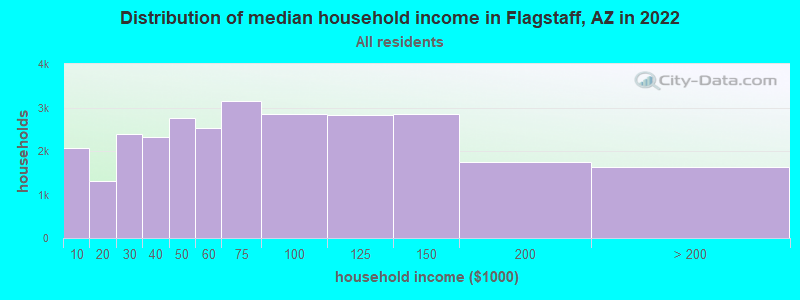
Median household income for houses/condos with a mortgage: $103,674
Median household income for apartments without a mortgage: $75,305
7,124 married couples with children.
3,996 single-parent households (611 men, 3,385 women).
83.0% of residents of Flagstaff speak English at home.
9.0% of residents speak Spanish at home (72% speak English very well, 18% speak English well, 10% speak English not well).
1.8% of residents speak other Indo-European language at home (89% speak English very well, 8% speak English well, 4% don't speak English at all).
1.6% of residents speak Asian or Pacific Island language at home (59% speak English very well, 31% speak English well, 11% speak English not well).
4.3% of residents speak other language at home (77% speak English very well, 9% speak English well, 13% speak English not well, 1% don't speak English at all).
Foreign born population: 5,734 (7.6%)
(45.4% of them are naturalized citizens)
Percentage of workers working in this county: 96.0% Number of people working at home: 4,817 (11.8% of all workers)
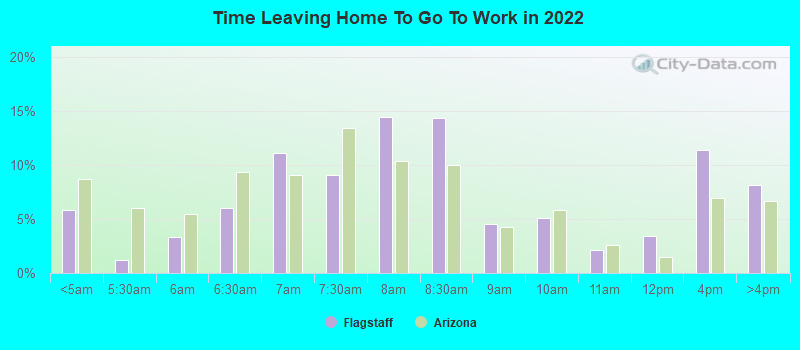
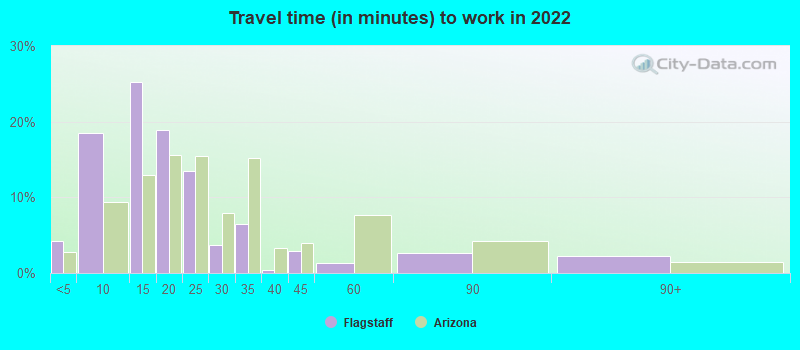
Travel time to work (commute)
Less than 5 minutes: 1,228
5 to 9 minutes: 9,472
10 to 14 minutes: 9,299
15 to 19 minutes: 5,782
20 to 24 minutes: 4,551
25 to 29 minutes: 716
30 to 34 minutes: 2,167
35 to 39 minutes: 131
40 to 44 minutes: 266
45 to 59 minutes: 672
60 to 89 minutes: 1,337
90 or more minutes: 363
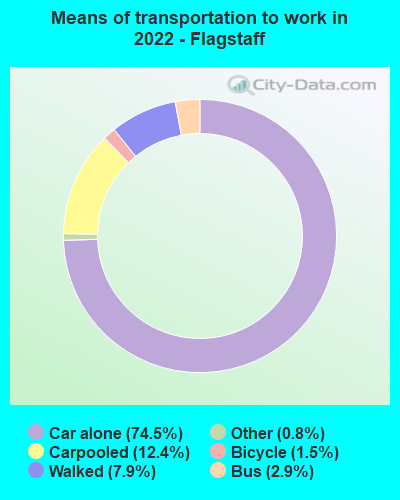
Means of transportation to work:
Drove a car alone: 30,847 (66.7%)
Carpooled: 5,133 (11.1%)
Bus: 1,202 (2.6%)
Taxi: 323 (0.7%)
Bicycle: 634 (1.4%)
Walked: 3,262 (7.1%)
Worked at home: 4,817 (10.4%)
Unemployment by race in 2022
Unemployment rate for White non-Hispanic residents
1.8%Males
3.4%Females
Unemployment rate for Black residents
15.4%Males
14.1%Females
Unemployment rate for American Indian and Alaska Native residents
4.1%Males
0.8%Females
Unemployment rate for Asian residents
2.5%Males
2.4%Females
Unemployment rate for other race residents
2.0%Males
9.7%Females
Unemployment rate for two or more race residents
7.4%Males
9.2%Females
Unemployment rate for Hispanic or Latino residents
5.6%Males
9.8%Females
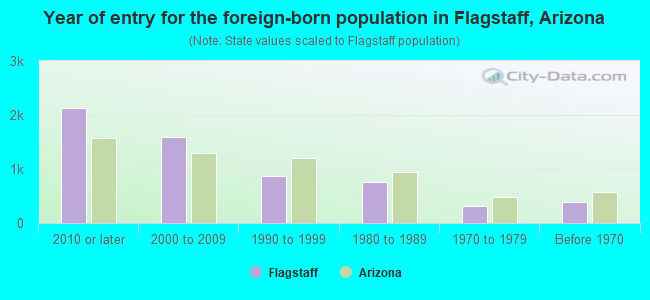
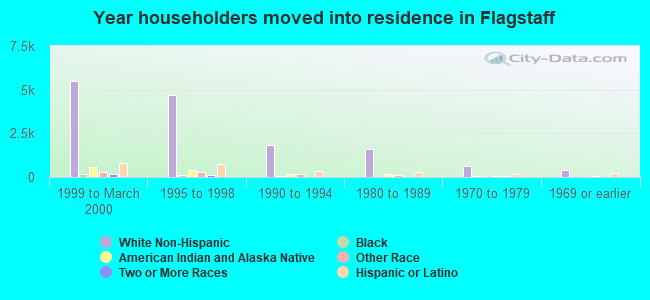
Year of entry for the foreign-born population in Flagstaff, Arizona
2,1362010 or later
1,5952000 to 2009
8651990 to 1999
7661980 to 1989
3241970 to 1979
381Before 1970
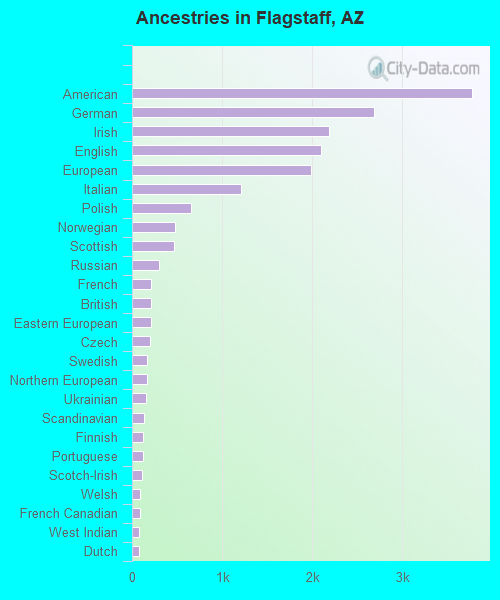
First ancestries reported:
American: 3,775 (9.8%)
German: 2,691 (7.0%)
Irish: 2,191 (5.7%)
English: 2,095 (5.4%)
European: 1,982 (5.1%)
Italian: 1,205 (3.1%)
Polish: 659 (1.7%)
Norwegian: 480 (1.2%)
Scottish: 468 (1.2%)
Russian: 304 (0.8%)
French: 216 (0.6%)
British: 209 (0.5%)
Eastern European: 207 (0.5%)
Czech: 198 (0.5%)
Swedish: 172 (0.4%)
Northern European: 163 (0.4%)
Ukrainian: 152 (0.4%)
Scandinavian: 128 (0.3%)
Finnish: 125 (0.3%)
Portuguese: 122 (0.3%)
Scotch-Irish: 111 (0.3%)
Welsh: 88 (0.2%)
French Canadian: 87 (0.2%)
West Indian: 79 (0.2%)
Dutch: 75 (0.2%)
Lebanese: 74 (0.2%)
Romanian: 74 (0.2%)
Slovak: 69 (0.2%)
Canadian: 62 (0.2%)
Danish: 58 (0.2%)
Brazilian: 58 (0.2%)
Slavic: 44 (0.1%)
Croatian: 42 (0.1%)
Afghan: 42 (0.1%)
Somali: 31 (0.08%)
Iranian: 27 (0.07%)
Jamaican: 27 (0.07%)
Belgian: 27 (0.07%)
Armenian: 25 (0.06%)
Haitian: 23 (0.06%)
Pennsylvania German: 14 (0.04%)
Hungarian: 13 (0.03%)
African: 12 (0.03%)
Swiss: 11 (0.03%)
Lithuanian: 11 (0.03%)
South African: 10 (0.03%)
Serbian: 8 (0.02%)
Greek: 8 (0.02%)
Yugoslavian: 7 (0.02%)
Basque: 5 (0.01%)
Arab: 5 (0.01%)
Czechoslovakian: 3 (0.01%)
Sierra Leonean: 3 (0.01%)
Most common places of birth for foreign-born residents (%):
Mexico
Flagstaff:
27.9% (1,440)
Arizona:
53.4% (500,086)
Philippines
Flagstaff:
6.4% (331)
Arizona:
3.2% (30,378)
Czechoslovakia (includes Czech Republic and Slovakia)
Flagstaff:
6.4% (331)
Arizona:
0.2% (1,678)
Japan
Flagstaff:
5.4% (281)
Arizona:
0.6% (6,077)
China, excluding Hong Kong and Taiwan
Flagstaff:
5.3% (275)
Arizona:
2.3% (21,275)
Guatemala
Flagstaff:
4.0% (205)
Arizona:
1.6% (14,556)
Peru
Flagstaff:
3.7% (189)
Arizona:
0.5% (4,316)
Colombia
Flagstaff:
3.5% (180)
Arizona:
0.6% (6,030)
El Salvador
Flagstaff:
3.2% (167)
Arizona:
1.2% (10,932)
Canada
Flagstaff:
3.2% (166)
Arizona:
4.3% (40,102)
Saudi Arabia
Flagstaff:
2.7% (141)
Arizona:
0.2% (1,456)
Vietnam
Flagstaff:
2.4% (123)
Arizona:
2.1% (19,199)
Brazil
Flagstaff:
2.3% (118)
Arizona:
0.4% (3,365)
India
Flagstaff:
2.3% (118)
Arizona:
4.5% (41,719)
Korea
Flagstaff:
2.1% (107)
Arizona:
1.2% (11,275)
Russia
Flagstaff:
1.9% (98)
Arizona:
0.4% (3,763)
France
Flagstaff:
1.6% (82)
Arizona:
0.4% (3,628)
Place of birth for U.S.-born residents:
This state: 32,838
Other state: 36,329
Northeast: 4,138
Midwest: 7,066
South: 6,171
West: 18,954
74.1% of Flagstaff residents lived in the same house 1 years ago. Out of people who lived in different houses, 27.5% lived in this county. Out of people who lived in different counties, 56.9% lived in Arizona.
Flagstaff:
74.1%
State average:
86.0%
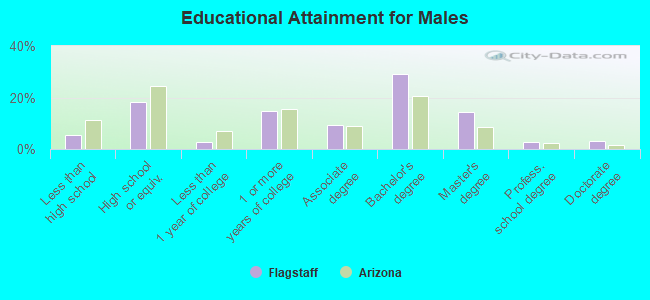
Education attainment for males 25 years and older:
No schooling: 0
Nursery to 4th grade: 0
5th and 6th grade: 231
7th and 8th grade: 0
9th grade: 74
10th grade: 369
11th grade: 49
12th grade, no diploma: 473
High school graduate (or equivalency): 3,944
Less than 1 year of college: 595
Some college more than 1 year, no degree: 3,139
Associate degree: 2,030
Bachelor's degree: 6,255
Master's degree: 3,108
Professional school degree: 573
Doctorate degree: 673
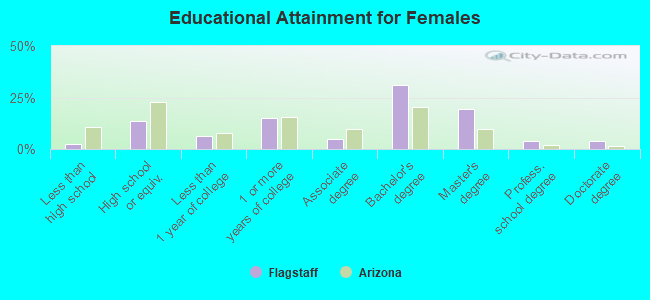
Education attainment for females 25 years and older:
No schooling: 127
Nursery to 4th grade: 0
5th and 6th grade: 178
7th and 8th grade: 0
9th grade: 21
10th grade: 0
11th grade: 40
12th grade, no diploma: 84
High school graduate (or equivalency): 2,609
Less than 1 year of college: 1,158
Some college more than 1 year, no degree: 2,834
Associate degree: 923
Bachelor's degree: 5,886
Master's degree: 3,697
Professional school degree: 748
Doctorate degree: 740
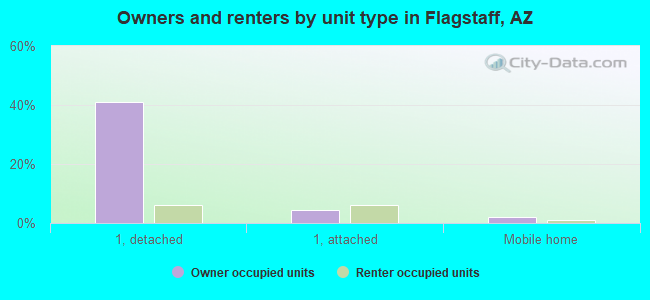
Housing units in structures:
One, detached: 13,705
One, attached: 3,334
Two: 1,381
3 or 4: 2,492
5 to 9: 2,385
10 to 19: 3,382
20 to 49: 1,098
50 or more: 2,577
Mobile homes: 2,020
Median worth of mobile homes: $122,000
Housing units lacking complete plumbing facilities in 2022: 1.1%
Housing units lacking complete kitchen facilities in 2022: 3.2%