Fisherville, TN (Tennessee) Houses and Residents
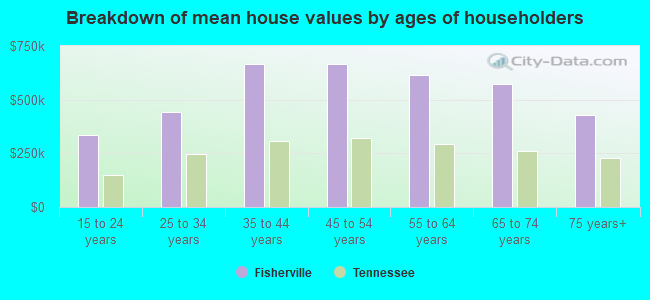
| Fisherville: | $578,617 |
| Tennessee: | $284,800 |
Total population: 6,906 (Urban population: 1,455, Rural population: 5,339 (131 farm, 5,208 nonfarm))
Houses: 2,432 (2,275 occupied: 2,106 owner occupied, 169 renter occupied)
| % of renters here: | 7% |
| State: | 33% |
Housing density: 51 houses/condos per square mile
Median price asked for vacant for-sale houses and condos in 2022 in this county: $203,919.
Median contract rent in 2022: $619 (lower quartile is $571, upper quartile is $1,001)
Median rent asked for vacant for-rent units in 2022: $980
Median gross rent in Fisherville, TN in 2022: $1,001
Housing units in Fisherville with a mortgage: 1,533 (201 second mortgage, 199 home equity loan, 0 both second mortgage and home equity loan)
Houses without a mortgage: 327
Compare current foreclosures near Fisherville, TN:
| Photo | Address | Area | Beds / Baths | Price | Details |
|---|---|---|---|---|---|

|
#1
University St
Memphis, TN 38127
|
1,152 sq. feet
|
2 baths 2 beds |
$31,750
|
show details |

|
#2
S Greer St
Memphis, TN 38111
|
820 sq. feet
|
1 baths 2 beds |
$120,000
|
show details |

|
#3
Gates Cv
Memphis, TN 38115
|
1,221 sq. feet
|
1 baths 2 beds |
$64,000
|
show details |

|
#4
Wood Mills Dr W
Cordova, TN 38016
|
- sq. feet
|
2 baths 3 beds |
show details | |

|
#5
Riggan Dr
Olive Branch, MS 38654
|
1,158 sq. feet
|
2 baths 3 beds |
show details | |

|
#6
Narcissus Dr
Memphis, TN 38135
|
2,600 sq. feet
|
2 baths 3 beds |
show details | |

|
#7
Old Brownsville Rd
Arlington, TN 38002
|
2,236 sq. feet
|
2 baths 4 beds |
show details | |

|
#8
Gracie Cv
Oakland, TN 38060
|
1,306 sq. feet
|
2 baths 3 beds |
show details | |

|
#9
Santa Cruz Cv
Memphis, TN 38133
|
1,791 sq. feet
|
2 baths 3 beds |
show details | |

|
#10
Isabelle St
Memphis, TN 38122
|
941 sq. feet
|
1 baths 2 beds |
show details |
| Photo | Address | Area | Beds / Baths | Price | Details |
|---|---|---|---|---|---|

|
#11
Partridge Cv
Memphis, TN 38128
|
1,843 sq. feet
|
2 baths 3 beds |
show details | |

|
#12
Addison Park Cv
Cordova, TN 38016
|
2,535 sq. feet
|
2 baths 3 beds |
show details | |

|
#13
Ginger Cir
Memphis, TN 38118
|
2,096 sq. feet
|
2 baths 3 beds |
show details | |

|
#14
Rockford Rd
Millington, TN 38053
|
875 sq. feet
|
1 baths 3 beds |
show details | |

|
#15
Hunters Creek Dr
Olive Branch, MS 38654
|
3,183 sq. feet
|
3 baths 4 beds |
show details | |

|
#16
Spring Morning Ct
Memphis, TN 38125
|
1,413 sq. feet
|
2 baths 3 beds |
show details | |

|
#17
Lenta Cv
Memphis, TN 38127
|
996 sq. feet
|
1 baths 3 beds |
show details | |

|
#18
Eagle Valley Cv
Memphis, TN 38135
|
2,651 sq. feet
|
2 baths 4 beds |
show details | |

|
#19
Queen Sinclair Cir
Millington, TN 38053
|
1,797 sq. feet
|
2 baths 3 beds |
show details | |

|
#20
E Mclemore Ave
Memphis, TN 38114
|
1,415 sq. feet
|
1 baths 3 beds |
show details |
| Photo | Address | Area | Beds / Baths | Price | Details |
|---|---|---|---|---|---|

|
#21
Tanglewood St
Memphis, TN 38104
|
964 sq. feet
|
1 baths 2 beds |
show details | |

|
#22
Llano Ave
Memphis, TN 38134
|
1,236 sq. feet
|
2 baths 3 beds |
show details | |

|
#23
Rappahannock Dr
Memphis, TN 38134
|
2,027 sq. feet
|
2 baths 4 beds |
show details | |

|
#24
Gaylord Ln
Memphis, TN 38118
|
1,116 sq. feet
|
1 baths 3 beds |
show details | |

|
#25
Battle Creek Dr
Memphis, TN 38134
|
2,176 sq. feet
|
2 baths 4 beds |
show details | |

|
#26
Montgomery Rd
Millington, TN 38053
|
1,370 sq. feet
|
2 baths 3 beds |
show details | |

|
#27
Lloydminster Cv
Memphis, TN 38141
|
1,304 sq. feet
|
2 baths 3 beds |
show details | |

|
#28
Capri St
Memphis, TN 38117
|
1,358 sq. feet
|
1 baths 3 beds |
show details | |

|
#29
Shadowlawn Rd
Arlington, TN 38002
|
2,785 sq. feet
|
2 baths 4 beds |
show details | |

|
#30
Birch Glen Dr
Memphis, TN 38115
|
1,553 sq. feet
|
2 baths 3 beds |
show details |
| Photo | Address | Area | Beds / Baths | Price | Details |
|---|---|---|---|---|---|

|
#31
Dothan St
Memphis, TN 38118
|
- sq. feet
|
2 baths 3 beds |
show details | |

|
#32
Felix Ave
Memphis, TN 38111
|
1,189 sq. feet
|
1 baths 3 beds |
show details | |

|
#33
Long Creek Rd
Memphis, TN 38125
|
2,472 sq. feet
|
2 baths 3 beds |
show details | |

|
#34
Wildflower Ln
Memphis, TN 38125
|
2,730 sq. feet
|
2 baths 4 beds |
show details | |

|
#35
N Mclean Blvd
Memphis, TN 38107
|
1,829 sq. feet
|
2 baths 3 beds |
show details | |

|
#36
Harrell Dr
Arlington, TN 38002
|
1,425 sq. feet
|
1 baths 3 beds |
show details | |

|
#37
Schanna Dr
Memphis, TN 38135
|
1,924 sq. feet
|
2 baths 3 beds |
show details | |

|
#38
Chimneyrock Blvd
Cordova, TN 38016
|
3,011 sq. feet
|
2 baths 4 beds |
show details | |

|
#39
Northknoll Ave
Millington, TN 38053
|
1,182 sq. feet
|
2 baths 3 beds |
show details | |

|
#40
Faxon Ave
Memphis, TN 38122
|
1,771 sq. feet
|
2 baths 2 beds |
show details |
| Photo | Address | Area | Beds / Baths | Price | Details |
|---|---|---|---|---|---|

|
#41
Friars Pl
Cordova, TN 38016
|
2,402 sq. feet
|
2 baths 4 beds |
show details | |

|
#42
Millington Arlington Rd
Millington, TN 38053
|
2,007 sq. feet
|
2 baths 3 beds |
show details | |

|
#43
N Lakewood Dr
Memphis, TN 38128
|
2,712 sq. feet
|
2 baths 3 beds |
show details | |

|
#44
S Perkins Rd
Memphis, TN 38117
|
1,249 sq. feet
|
1 baths 3 beds |
show details | |

|
#45
Craven Rd
Arlington, TN 38002
|
2,650 sq. feet
|
2 baths 3 beds |
show details | |

|
#46
Kings Arms St
Memphis, TN 38115
|
1,555 sq. feet
|
2 baths 3 beds |
show details | |

|
#47
Hilltop Rd
Memphis, TN 38135
|
1,840 sq. feet
|
2 baths 3 beds |
show details | |

|
#48
Park Ave
Memphis, TN 38119
|
1,128 sq. feet
|
1 baths 2 beds |
show details | |

|
#49
Grove Rd
Collierville, TN 38017
|
2,068 sq. feet
|
2 baths 5 beds |
show details | |

|
Check over 1 million property listings on Foreclosure.com!
|
browse all offers | |||

Household type by relationship:
Households: 909,315- In family households: 763,349 (130,277 male householders, 101,130 female householders)
135,865 spouses, 288,562 children (268,691 natural, 6,442 adopted, 13,429 stepchildren), 34,868 grandchildren, 15,859 brothers or sisters, 9,522 parents, foster children, 20,027 other relatives, 22,996 non-relatives
- In nonfamily households: 145,966 (55,407 male householders (43,999 living alone)), 64,157 female householders (55,496 living alone)), 26,402 nonrelatives
- In group quarters: 18,329 (11,592 institutionalized population)
126,592 married couples with children.
88,773 single-parent households (11,723 men, 77,050 women).
94.4% of residents of Fisherville speak English at home.
1.9% of residents speak Spanish at home (93% speak English very well, 7% speak English well).
2.2% of residents speak other Indo-European language at home (68% speak English very well, 32% speak English well).
1.5% of residents speak Asian or Pacific Island language at home (39% speak English very well, 43% speak English well, 8% speak English not well, 10% don't speak English at all).
Foreign born population: 331 (4.8%)
(52.0% of them are naturalized citizens)
| Here: | 8.1 |
| State: | 6.5 |
| Here: | 5.9 |
| State: | 4.4 |
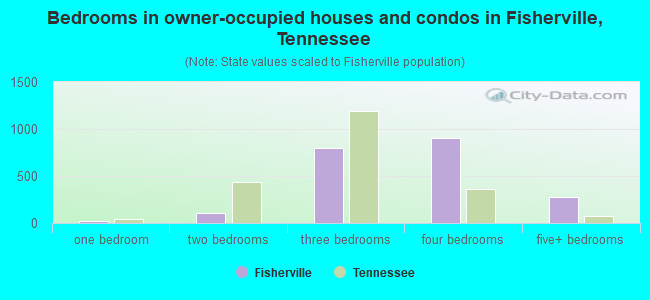
- Bedrooms in owner-occupied houses and condos in Fisherville, Tennessee
- 0no bedroom
- 251 bedroom
- 1052 bedrooms
- 7993 bedrooms
- 9034 bedrooms
- 2745+ bedrooms
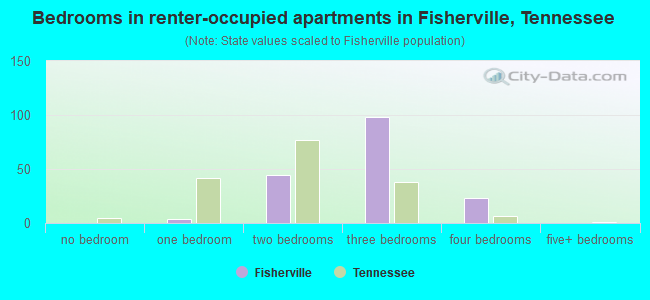
- Bedrooms in renter-occupied apartments in Fisherville, Tennessee
- 0no bedroom
- 41 bedroom
- 442 bedrooms
- 983 bedrooms
- 234 bedrooms
- 05+ bedrooms
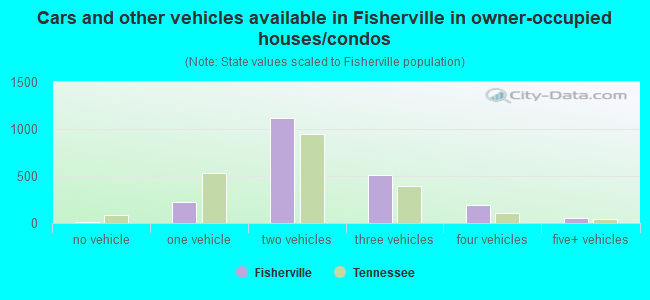
- Cars and other vehicles available in Fisherville in owner-occupied houses/condos
- 9no vehicle
- 2241 vehicle
- 1,1182 vehicles
- 5113 vehicles
- 1914 vehicles
- 535+ vehicles
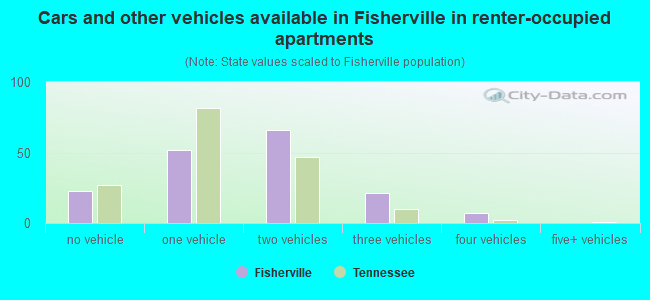
- Cars and other vehicles available in Fisherville in renter-occupied apartments
- 23no vehicle
- 521 vehicle
- 662 vehicles
- 213 vehicles
- 74 vehicles
- 05+ vehicles
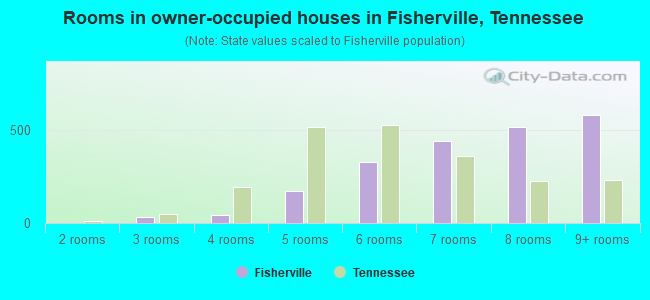
- Rooms in owner-occupied houses in Fisherville, Tennessee
- 01 room
- 02 rooms
- 333 rooms
- 414 rooms
- 1725 rooms
- 3286 rooms
- 4417 rooms
- 5128 rooms
- 5799+ rooms
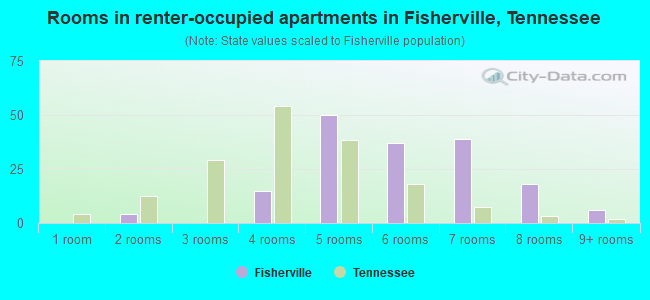
- Rooms in renter-occupied apartments in Fisherville, Tennessee
- 01 room
- 42 rooms
- 03 rooms
- 154 rooms
- 505 rooms
- 376 rooms
- 397 rooms
- 188 rooms
- 69+ rooms
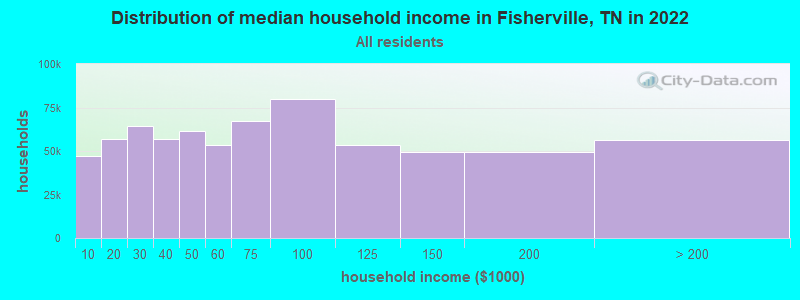
Fisherville, TN household income distribution

- 47,196Less than $10,000
- 56,841$10,000 to $19,999
- 64,436$20,000 to $29,999
- 57,091$30,000 to $39,999
- 61,522$40,000 to $49,999
- 53,393$50,000 to $59,999
- 67,399$60,000 to $74,999
- 79,996$75,000 to $99,999
- 53,587$100,000 to $124,999
- 49,390$125,000 to $149,999
- 49,486$150,000 to $199,999
- 56,564$200,000 or more
Percentage of workers working in this county: 95.1%
Number of people working at home: 455 (12.1% of all workers)
Travel time to work (commute)
- Less than 5 minutes: 32
- 5 to 9 minutes: 128
- 10 to 14 minutes: 311
- 15 to 19 minutes: 469
- 20 to 24 minutes: 699
- 25 to 29 minutes: 292
- 30 to 34 minutes: 664
- 35 to 39 minutes: 170
- 40 to 44 minutes: 170
- 45 to 59 minutes: 349
- 60 to 89 minutes: 36
- 90 or more minutes: 71
Means of transportation to work:
- Drove a car alone: 3,162 (89.6%)
- Carpooled: 183 (5.2%)
- Walked: 13 (0.4%)
- Other means: 33 (0.9%)
- Worked at home: 139 (3.9%)
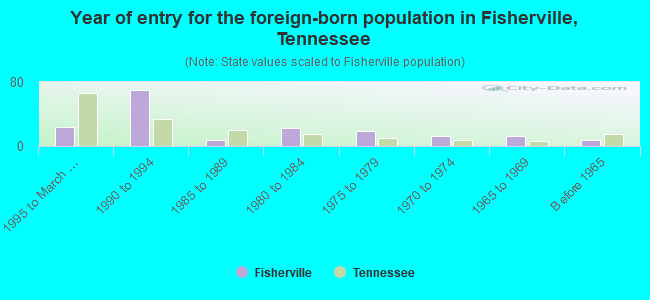
- Year of entry for the foreign-born population in Fisherville, Tennessee
- 241995 to March 2000
- 701990 to 1994
- 71985 to 1989
- 221980 to 1984
- 191975 to 1979
- 121970 to 1974
- 121965 to 1969
- 7Before 1965
Most common places of birth for foreign-born residents (%):
| Fisherville: | 19.1% (33) |
| Tennessee: | 0.7% (1,046) |
| Fisherville: | 15.6% (27) |
| Tennessee: | 2.7% (4,288) |
| Fisherville: | 12.1% (21) |
| Tennessee: | 3.6% (5,726) |
| Fisherville: | 9.8% (17) |
| Tennessee: | 0.6% (1,012) |
| Fisherville: | 9.2% (16) |
| Tennessee: | 28.1% (44,682) |
| Fisherville: | 8.7% (15) |
| Tennessee: | 1.1% (1,694) |
| Fisherville: | 6.9% (12) |
| Tennessee: | 0.4% (599) |
| Fisherville: | 5.8% (10) |
| Tennessee: | 0.3% (504) |
| Fisherville: | 5.2% (9) |
| Tennessee: | 1.1% (1,705) |
| Fisherville: | 4.0% (7) |
| Tennessee: | 0.5% (766) |
| Fisherville: | 3.5% (6) |
| Tennessee: | 5.2% (8,316) |
Place of birth for U.S.-born residents:
- This state: 4,131
- Other state: 2,407
- Northeast: 220
- Midwest: 505
- South: 1,445
- West: 237
50% of Fisherville residents lived in the same house 5 years ago.
Out of people who lived in different houses, 69% lived in this county.
Out of people who lived in different counties, 21% lived in Tennessee.
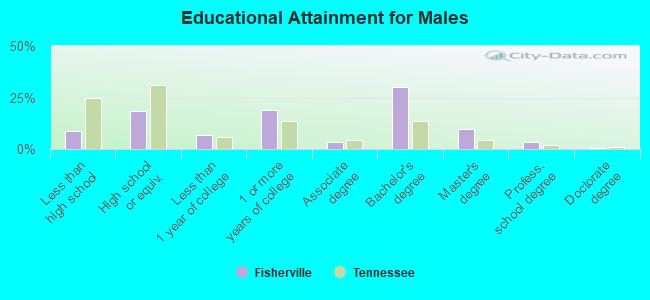
Education attainment for males 25 years and older:
- No schooling: 8
- Nursery to 4th grade: 0
- 5th and 6th grade: 23
- 7th and 8th grade: 57
- 9th grade: 11
- 10th grade: 41
- 11th grade: 26
- 12th grade, no diploma: 21
- High school graduate (or equivalency): 387
- Less than 1 year of college: 146
- Some college more than 1 year, no degree: 396
- Associate degree: 71
- Bachelor's degree: 626
- Master's degree: 199
- Professional school degree: 72
- Doctorate degree: 11
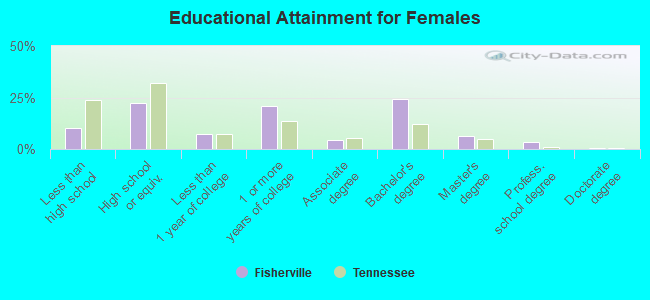
Education attainment for females 25 years and older:
- No schooling: 7
- Nursery to 4th grade: 7
- 5th and 6th grade: 0
- 7th and 8th grade: 49
- 9th grade: 9
- 10th grade: 76
- 11th grade: 31
- 12th grade, no diploma: 51
- High school graduate (or equivalency): 503
- Less than 1 year of college: 159
- Some college more than 1 year, no degree: 473
- Associate degree: 95
- Bachelor's degree: 549
- Master's degree: 146
- Professional school degree: 79
- Doctorate degree: 15
Housing units in structures:
- One, detached: 2,375
- One, attached: 29
- Mobile homes: 28
Median worth of mobile homes: $488,490
Housing units lacking complete kitchen facilities: 0.2%
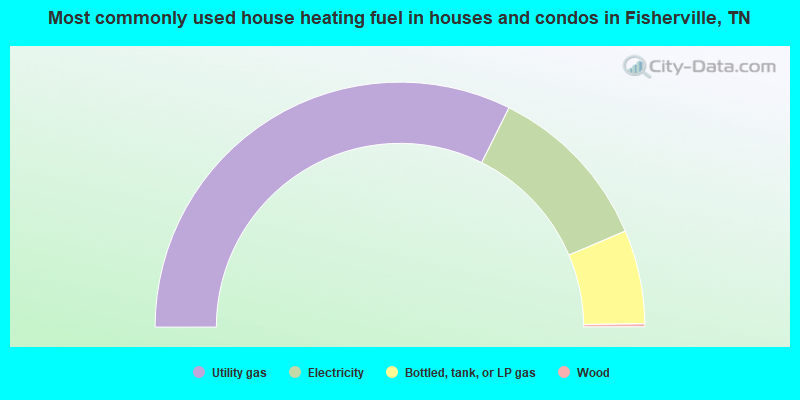
- 64.7%Utility gas
- 22.5%Electricity
- 12.4%Bottled, tank, or LP gas
- 0.4%Wood
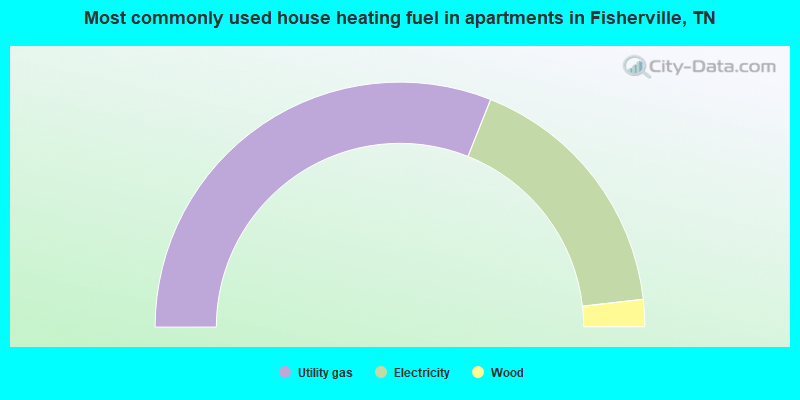
- 62.1%Utility gas
- 34.3%Electricity
- 3.6%Wood
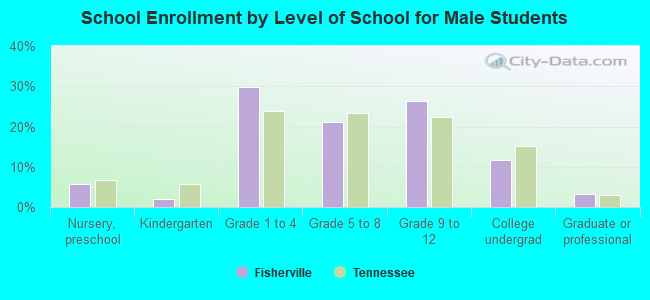
Private vs. public school enrollment:
| Here: | 18.4% |
| Tennessee: | 9.5% |
| Here: | 26.3% |
| Tennessee: | 10.4% |
| Here: | 29.3% |
| Tennessee: | 22.8% |