Federal Way, WA (Washington) Houses and Residents
| Federal Way: | $570,500 |
| Washington: | $569,500 |
Mean price in 2022:
Detached houses: $638,893
Here: $638,893 State: $734,307 Townhouses or other attached units: $326,641
Here: $326,641 State: $657,697 In 3-to-4-unit structures: $309,643
Here: $309,643 State: $510,239 In 5-or-more-unit structures: $226,254
Here: $226,254 State: $503,183 Mobile homes: $171,729
Here: $171,729 State: $218,362
Total population: 93,425 (Urban population: 83,233, Rural population: 0)
Houses: 37,514 (36,005 occupied: 20,354 owner occupied, 15,651 renter occupied)
| % of renters here: | 43% |
| State: | 36% |
Housing density: 1,784 houses/condos per square mile
Median price asked for vacant for-sale houses and condos in 2022: $398,207.
Median contract rent in 2022: $1,458 (lower quartile is $1,051, upper quartile is $1,837)
Median rent asked for vacant for-rent units in 2022: $1,913
Median gross rent in Federal Way, WA in 2022: $1,602
Housing units in Federal Way with a mortgage: 13,545 (1,384 second mortgage, 0 home equity loan, 1,026 both second mortgage and home equity loan)
Houses without a mortgage: 119
Median household income for houses/condos with a mortgage: $106,856
Median household income for apartments without a mortgage: $103,860
Median monthly housing costs: $1,618
Compare current foreclosures in Federal Way, WA:
| Photo | Address | Area | Beds / Baths | Price | Details |
|---|---|---|---|---|---|

|
#1
S 359th St
Federal Way, WA 98003
|
1,096 sq. feet
|
1 baths 2 beds |
show details | |

|
#2
S 365th Pl
Federal Way, WA 98003
|
1,010 sq. feet
|
2 baths 3 beds |
show details | |

|
#3
9th Ave S
Federal Way, WA 98003
|
1,000 sq. feet
|
1 baths 3 beds |
show details | |

|
#4
4th Ave S
Federal Way, WA 98003
|
2,120 sq. feet
|
3 baths 5 beds |
show details | |

|
#5
1st Ave S
Federal Way, WA 98003
|
5,280 sq. feet
|
3 baths 4 beds |
show details | |

|
#6
19th Ave SW
Federal Way, WA 98023
|
1,600 sq. feet
|
2 baths 3 beds |
show details | |

|
#7
SW 338th St
Federal Way, WA 98023
|
1,620 sq. feet
|
1 baths 3 beds |
show details | |

|
#8
20th Ave S
Federal Way, WA 98003
|
1,970 sq. feet
|
2 baths 3 beds |
show details | |

|
#9
26th Pl SW
Federal Way, WA 98023
|
970 sq. feet
|
1 baths 3 beds |
show details | |

|
#10
SW 339th St
Federal Way, WA 98023
|
1,480 sq. feet
|
1 baths 3 beds |
show details |
| Photo | Address | Area | Beds / Baths | Price | Details |
|---|---|---|---|---|---|

|
#11
S 315th St
Federal Way, WA 98003
|
1,580 sq. feet
|
1 baths 3 beds |
show details | |

|
#12
SW 295th Pl
Federal Way, WA 98023
|
6,370 sq. feet
|
6 baths 4 beds |
show details | |

|
#13
23rd Ave SW
Federal Way, WA 98023
|
1,320 sq. feet
|
1 baths 3 beds |
show details | |

|
#14
S 316th St
Federal Way, WA 98003
|
1,480 sq. feet
|
2 baths 3 beds |
show details | |

|
#15
S 278th St
Federal Way, WA 98003
|
1,370 sq. feet
|
2 baths 3 beds |
show details | |

|
#16
10th Ave SW
Federal Way, WA 98023
|
2,000 sq. feet
|
2 baths 3 beds |
show details | |

|
#17
30th Ave SW
Federal Way, WA 98023
|
1,890 sq. feet
|
2 baths 3 beds |
show details | |

|
#18
Marine View Dr SW
Federal Way, WA 98023
|
3,582 sq. feet
|
3 baths 4 beds |
show details | |

|
#19
23rd Ave S
Federal Way, WA 98003
|
1,490 sq. feet
|
2 baths 3 beds |
show details | |

|
#20
3rd Ave S
Federal Way, WA 98003
|
970 sq. feet
|
1 baths 3 beds |
show details |
| Photo | Address | Area | Beds / Baths | Price | Details |
|---|---|---|---|---|---|

|
#21
SW Dash Point Rd
Federal Way, WA 98023
|
1,900 sq. feet
|
3 baths 3 beds |
show details | |

|
#22
SW 328th Pl
Federal Way, WA 98023
|
1,650 sq. feet
|
2 baths 3 beds |
show details | |

|
#23
S 354th St
Federal Way, WA 98003
|
1,650 sq. feet
|
3 baths 4 beds |
show details | |

|
#24
13th Ave SW
Federal Way, WA 98023
|
2,200 sq. feet
|
2 baths 3 beds |
show details | |

|
#25
S 299th Pl
Federal Way, WA 98003
|
1,660 sq. feet
|
1 baths 3 beds |
show details | |

|
#26
2nd Pl SW
Federal Way, WA 98023
|
1,570 sq. feet
|
2 baths 3 beds |
show details | |

|
#27
19th Pl SW
Federal Way, WA 98023
|
1,640 sq. feet
|
2 baths 3 beds |
show details | |

|
#28
SW 309th St
Federal Way, WA 98023
|
2,050 sq. feet
|
4 baths 5 beds |
show details | |

|
#29
14th Pl SW
Federal Way, WA 98023
|
1,880 sq. feet
|
2 baths 4 beds |
show details | |

|
#30
S 320th St Apt 27
Federal Way, WA 98003
|
1,088 sq. feet
|
1 baths 2 beds |
show details |
| Photo | Address | Area | Beds / Baths | Price | Details |
|---|---|---|---|---|---|

|
#31
35th Ave SW
Federal Way, WA 98023
|
2,550 sq. feet
|
2 baths 3 beds |
show details | |

|
#32
47th Pl SW
Federal Way, WA 98023
|
1,790 sq. feet
|
2 baths 3 beds |
show details | |

|
#33
8th Ave S
Federal Way, WA 98003
|
2,480 sq. feet
|
1 baths 4 beds |
show details | |

|
#34
17th Ave SW
Federal Way, WA 98023
|
1,970 sq. feet
|
2 baths 3 beds |
show details | |

|
#35
7th Ave S
Federal Way, WA 98003
|
1,410 sq. feet
|
1 baths 4 beds |
show details | |

|
#36
SW 318th Pl # 12-A
Federal Way, WA 98023
|
1,135 sq. feet
|
1 baths 2 beds |
show details | |

|
#37
9th Pl SW
Federal Way, WA 98023
|
1,200 sq. feet
|
1 baths 3 beds |
show details | |

|
#38
21st Ln S
Federal Way, WA 98003
|
3,930 sq. feet
|
2 baths 4 beds |
show details | |

|
#39
28th Pl SW
Federal Way, WA 98023
|
1,620 sq. feet
|
1 baths 3 beds |
show details | |

|
#40
SW 326th St
Federal Way, WA 98023
|
1,750 sq. feet
|
2 baths 3 beds |
show details |
| Photo | Address | Area | Beds / Baths | Price | Details |
|---|---|---|---|---|---|

|
#41
24th Pl S
Federal Way, WA 98003
|
2,700 sq. feet
|
3 baths 6 beds |
show details | |

|
#42
4th Ave S
Federal Way, WA 98003
|
2,120 sq. feet
|
2 baths 5 beds |
show details | |

|
#43
2nd Pl SW
Federal Way, WA 98023
|
2,130 sq. feet
|
2 baths 5 beds |
show details | |

|
#44
SW 306th Pl
Federal Way, WA 98023
|
1,840 sq. feet
|
2 baths 3 beds |
show details | |

|
#45
SW 313th St
Federal Way, WA 98023
|
1,200 sq. feet
|
1 baths 3 beds |
show details | |

|
#46
SW 325th St
Federal Way, WA 98023
|
2,710 sq. feet
|
3 baths 4 beds |
show details | |

|
#47
19th Pl SW
Federal Way, WA 98023
|
1,840 sq. feet
|
2 baths 3 beds |
show details | |

|
#48
SW 328th St
Federal Way, WA 98023
|
1,298 sq. feet
|
1 baths 3 beds |
show details | |

|
#49
6th Ave SW
Federal Way, WA 98023
|
1,410 sq. feet
|
1 baths 3 beds |
show details | |

|
Check over 1 million property listings on Foreclosure.com!
|
browse all offers | |||


 | This rental home search is starting to feel hopeless! (49 replies) |
| Condo/townhome purchase (4 replies) |
| home search (4 replies) |
| Good Apartment/Townhomes in South King Couty? (3 replies) |
| Seattle is boring, and I'm a transplant - Don't move here (83 replies) |
| How Microsoft is Tackling Homelessness in the Seattle area (20 replies) |

Median year apartment built: 1985
Household type by relationship:
Households: 97,863- Male householders: 17,429 (4,365 living alone), Female householders: 18,576 (5,659 living alone)
16,369 spouses (16,289 opposite-sex spouses), 1,795 unmarried partners, (1,680 opposite-sex unmarried partners), 27,926 children (25,840 natural, 940 adopted, 1,146 stepchildren), 1,258 grandchildren, 1,773 brothers or sisters, 3,025 parents, 0 foster children, 2,667 other relatives, 5,940 non-relatives
- In group quarters: 1,105
Size of family households: 9,627 2-persons, 4,460 3-persons, 4,221 4-persons, 1,146 5-persons, 1,748 6-persons, 1,158 7-or-more-persons.
Size of nonfamily households: 10,024 1-person, 2,166 2-persons, 1,360 3-persons, 95 4-persons.
14,089 married couples with children.
4,000 single-parent households (429 men, 3,571 women).
60.6% of residents of Federal Way speak English at home.
14.0% of residents speak Spanish at home (56% speak English very well, 22% speak English well, 18% speak English not well, 3% don't speak English at all).
6.7% of residents speak other Indo-European language at home (52% speak English very well, 29% speak English well, 17% speak English not well, 2% don't speak English at all).
14.9% of residents speak Asian or Pacific Island language at home (49% speak English very well, 27% speak English well, 20% speak English not well, 4% don't speak English at all).
4.6% of residents speak other language at home (69% speak English very well, 28% speak English well, 3% speak English not well).
Foreign born population: 31,841 (32.5%)
(42.0% of them are naturalized citizens)
| Here: | 6.4 |
| State: | 6.5 |
| Here: | 3.9 |
| State: | 3.9 |

- Bedrooms in owner-occupied houses and condos in Federal Way, Washington
- 340no bedroom
- 4111 bedroom
- 3,1352 bedrooms
- 8,6553 bedrooms
- 5,9904 bedrooms
- 1,8235+ bedrooms

- Bedrooms in renter-occupied apartments in Federal Way, Washington
- 980no bedroom
- 4,4681 bedroom
- 5,6632 bedrooms
- 3,4263 bedrooms
- 8874 bedrooms
- 2275+ bedrooms

- Cars and other vehicles available in Federal Way in owner-occupied houses/condos
- 607no vehicle
- 3,9611 vehicle
- 9,4052 vehicles
- 3,2873 vehicles
- 1,6774 vehicles
- 1,4175+ vehicles

- Cars and other vehicles available in Federal Way in renter-occupied apartments
- 2,118no vehicle
- 7,5301 vehicle
- 3,9522 vehicles
- 1,4583 vehicles
- 5934 vehicles
- 05+ vehicles

- Rooms in owner-occupied houses in Federal Way, Washington
- 3401 room
- 1762 rooms
- 7383 rooms
- 2,2354 rooms
- 2,1825 rooms
- 4,7606 rooms
- 2,3757 rooms
- 2,9078 rooms
- 4,6419+ rooms

- Rooms in renter-occupied apartments in Federal Way, Washington
- 9801 room
- 5062 rooms
- 4,7793 rooms
- 3,9394 rooms
- 2,4455 rooms
- 2,0796 rooms
- 5197 rooms
- 3538 rooms
- 519+ rooms


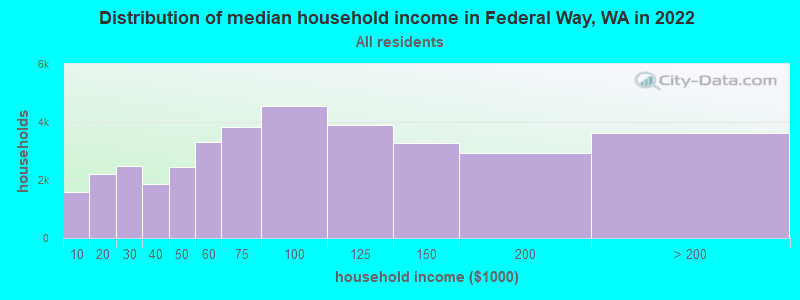
Federal Way, WA household income distribution

- 1,603Less than $10,000
- 2,201$10,000 to $19,999
- 2,485$20,000 to $29,999
- 1,876$30,000 to $39,999
- 2,437$40,000 to $49,999
- 3,302$50,000 to $59,999
- 3,813$60,000 to $74,999
- 4,560$75,000 to $99,999
- 3,906$100,000 to $124,999
- 3,276$125,000 to $149,999
- 2,922$150,000 to $199,999
- 3,624$200,000 or more
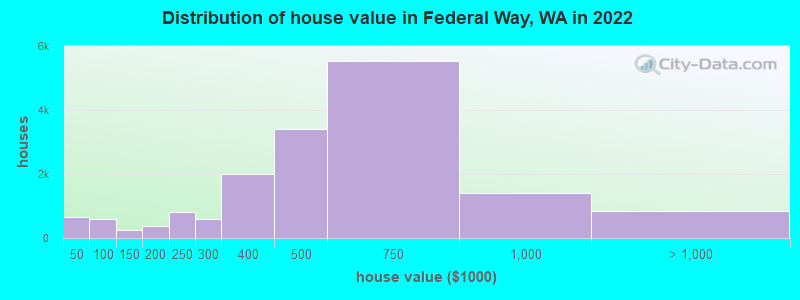
Home value of owner - occupied houses in 2022 in Federal Way, WA
-
- 316Less than $10,000
- 30$10,000 to $14,999
- 105$15,000 to $19,999
- 61$20,000 to $24,999
- 21$25,000 to $29,999
- 26$30,000 to $34,999
- 17$35,000 to $39,999
- 73$40,000 to $49,999
- 104$50,000 to $59,999
- 54$60,000 to $69,999
- 150$70,000 to $79,999
- 147$80,000 to $89,999
- 72$90,000 to $99,999
- 92$100,000 to $124,999
- 154$125,000 to $149,999
- 225$150,000 to $174,999
- 143$175,000 to $199,999
- 822$200,000 to $249,999
- 589$250,000 to $299,999
- 1,997$300,000 to $399,999
- 3,401$400,000 to $499,999
- 5,530$500,000 to $749,999
- 1,394$750,000 to $999,999
- 620$1,000,000 to $1,499,999
- 39$1,500,000 to $1,999,999
- 174$2,000,000 or more
Rent paid by renters in 2022 in Federal Way, WA
-
- 181Less than $100
- 47$100 to $149
- 211$150 to $199
- 143$200 to $249
- 239$250 to $299
- 153$350 to $399
- 10$400 to $449
- 103$450 to $499
- 146$500 to $549
- 94$550 to $599
- 48$600 to $649
- 41$650 to $699
- 56$700 to $749
- 28$750 to $799
- 285$800 to $899
- 414$900 to $999
- 2,567$1,000 to $1,249
- 3,645$1,250 to $1,499
- 5,402$1,500 to $1,999
- 1,973$2,000 to $2,499
- 296$2,500 to $2,999
- 258$3,000 to $3,499
- 119$3,500 or more
- 476No cash rent


Percentage of workers working in this county: 83.8%
Number of people working at home: 7,156 (14.6% of all workers)
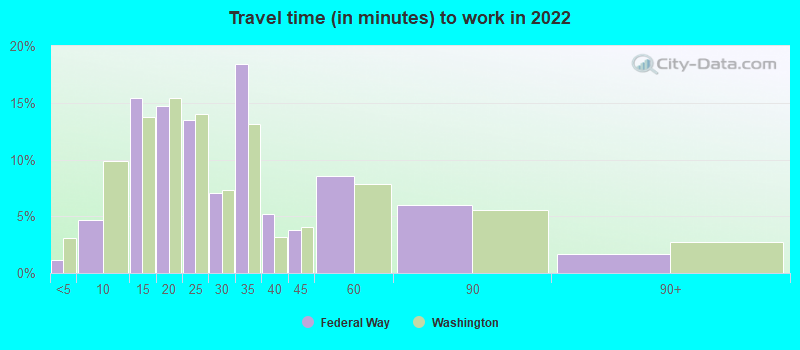
Travel time to work (commute)
- Less than 5 minutes: 751
- 5 to 9 minutes: 1,027
- 10 to 14 minutes: 4,665
- 15 to 19 minutes: 4,245
- 20 to 24 minutes: 4,323
- 25 to 29 minutes: 4,051
- 30 to 34 minutes: 7,155
- 35 to 39 minutes: 1,357
- 40 to 44 minutes: 2,301
- 45 to 59 minutes: 5,283
- 60 to 89 minutes: 4,186
- 90 or more minutes: 1,286
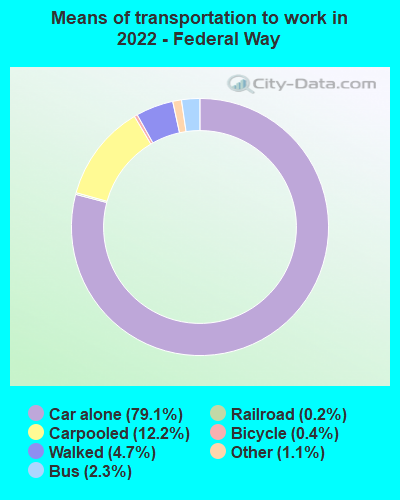
Means of transportation to work:
- Drove a car alone: 22,189 (64.4%)
- Carpooled: 3,278 (9.5%)
- Bus: 405 (1.2%)
- Long-distance train or commuter rail: 3 (0.0%)
- Light rail, streetcar or trolley: 66 (0.2%)
- Taxi: 274 (0.8%)
- Bicycle: 97 (0.3%)
- Walked: 1,173 (3.4%)
- Worked at home: 7,156 (20.8%)

- Unemployment by race in 2022
- Unemployment rate for White non-Hispanic residents
- 3.4%Males
- 2.4%Females
- Unemployment rate for Black residents
- 7.0%Males
- 3.4%Females
- Unemployment rate for American Indian and Alaska Native residents
- 17.9%Males
- 10.2%Females
- Unemployment rate for Asian residents
- 10.4%Males
- Unemployment rate for other race residents
- 4.7%Males
- 2.2%Females
- Unemployment rate for two or more race residents
- 4.6%Males
- 7.1%Females
- Unemployment rate for Hispanic or Latino residents
- 4.1%Males
- 3.6%Females

- Year of entry for the foreign-born population in Federal Way, Washington
- 11,5582010 or later
- 6,8552000 to 2009
- 5,2491990 to 1999
- 4,0231980 to 1989
- 1,8071970 to 1979
- 1,410Before 1970

First ancestries reported:
- American: 2,482 (4.6%)
- German: 1,894 (3.5%)
- European: 1,662 (3.1%)
- English: 1,404 (2.6%)
- Ukrainian: 1,339 (2.5%)
- African: 1,206 (2.3%)
- Turkish: 1,035 (1.9%)
- Kenyan: 877 (1.6%)
- Irish: 845 (1.6%)
- Italian: 680 (1.3%)
- Norwegian: 601 (1.1%)
- Nigerian: 585 (1.1%)
- Ethiopian: 575 (1.1%)
- Russian: 526 (1.0%)
- Ghanaian: 302 (0.6%)
- Dutch: 261 (0.5%)
- Polish: 245 (0.5%)
- Ugandan: 224 (0.4%)
- British: 199 (0.4%)
- Scottish: 196 (0.4%)
- Swedish: 170 (0.3%)
- French: 167 (0.3%)
- Armenian: 166 (0.3%)
- French Canadian: 158 (0.3%)
- Romanian: 155 (0.3%)
- Scandinavian: 152 (0.3%)
- Afghan: 152 (0.3%)
- Somali: 142 (0.3%)
- Danish: 140 (0.3%)
- Canadian: 117 (0.2%)
- Serbian: 108 (0.2%)
- Liberian: 88 (0.2%)
- Slavic: 87 (0.2%)
- Northern European: 86 (0.2%)
- Brazilian: 80 (0.1%)
- Austrian: 79 (0.1%)
- Iranian: 76 (0.1%)
- Jamaican: 75 (0.1%)
- Eastern European: 73 (0.1%)
- Yugoslavian: 57 (0.1%)
- Haitian: 53 (0.10%)
- Portuguese: 48 (0.09%)
- Guyanese: 48 (0.09%)
- Welsh: 48 (0.09%)
- Swiss: 46 (0.09%)
- Greek: 45 (0.08%)
- Barbadian: 45 (0.08%)
- Hungarian: 44 (0.08%)
- Scotch-Irish: 41 (0.08%)
- Assyrian: 34 (0.06%)
- Lebanese: 31 (0.06%)
- Croatian: 29 (0.05%)
- Latvian: 28 (0.05%)
- Lithuanian: 27 (0.05%)
- Maltese: 25 (0.05%)
- Czech: 22 (0.04%)
- Slovak: 18 (0.03%)
- Slovene: 18 (0.03%)
- Israeli: 17 (0.03%)
- Icelander: 14 (0.03%)
- Czechoslovakian: 13 (0.02%)
- Finnish: 12 (0.02%)
- South African: 9 (0.02%)
- Celtic: 7 (0.01%)
Most common places of birth for foreign-born residents (%):
| Federal Way: | 16.1% (4,646) |
| Washington: | 21.1% (241,655) |
| Federal Way: | 10.6% (3,074) |
| Washington: | 4.3% (48,886) |
| Federal Way: | 9.5% (2,749) |
| Washington: | 6.3% (71,661) |
| Federal Way: | 7.7% (2,234) |
| Washington: | 1.1% (12,735) |
| Federal Way: | 6.9% (2,003) |
| Washington: | 5.4% (62,003) |
| Federal Way: | 3.3% (953) |
| Washington: | 7.4% (84,470) |
| Federal Way: | 3.1% (908) |
| Washington: | 0.6% (6,500) |
| Federal Way: | 3.1% (896) |
| Washington: | 3.1% (35,872) |
| Federal Way: | 2.2% (639) |
| Washington: | 1.9% (21,540) |
| Federal Way: | 2.2% (630) |
| Washington: | 0.2% (2,695) |
| Federal Way: | 2.0% (592) |
| Washington: | 0.4% (4,144) |
| Federal Way: | 2.0% (585) |
| Washington: | 1.2% (13,855) |
| Federal Way: | 1.9% (544) |
| Washington: | 1.6% (17,938) |
Place of birth for U.S.-born residents:
- This state: 42,375
- Other state: 22,323
- Northeast: 1,952
- Midwest: 5,232
- South: 3,806
- West: 11,333
88.9% of Federal Way residents lived in the same house 1 years ago.
Out of people who lived in different houses, 35.6% lived in this county.
Out of people who lived in different counties, 70.6% lived in Washington.
| Federal Way: | 88.9% |
| State average: | 85.2% |
Education attainment for males 25 years and older:
- No schooling: 846
- Nursery to 4th grade: 130
- 5th and 6th grade: 465
- 7th and 8th grade: 0
- 9th grade: 711
- 10th grade: 174
- 11th grade: 558
- 12th grade, no diploma: 385
- High school graduate (or equivalency): 9,710
- Less than 1 year of college: 2,598
- Some college more than 1 year, no degree: 6,465
- Associate degree: 2,111
- Bachelor's degree: 6,854
- Master's degree: 2,241
- Professional school degree: 667
- Doctorate degree: 298

Education attainment for females 25 years and older:
- No schooling: 929
- Nursery to 4th grade: 400
- 5th and 6th grade: 142
- 7th and 8th grade: 211
- 9th grade: 511
- 10th grade: 195
- 11th grade: 821
- 12th grade, no diploma: 373
- High school graduate (or equivalency): 8,887
- Less than 1 year of college: 3,333
- Some college more than 1 year, no degree: 5,470
- Associate degree: 3,332
- Bachelor's degree: 7,237
- Master's degree: 2,896
- Professional school degree: 266
- Doctorate degree: 367


Housing units in structures:
- One, detached: 17,791
- One, attached: 852
- Two: 471
- 3 or 4: 4,115
- 5 to 9: 4,248
- 10 to 19: 3,659
- 20 to 49: 1,367
- 50 or more: 3,278
- Mobile homes: 1,733
Median worth of mobile homes: $87,700
House/condo owner moved in on average 11 years ago
Renter moved in on average 3 years ago

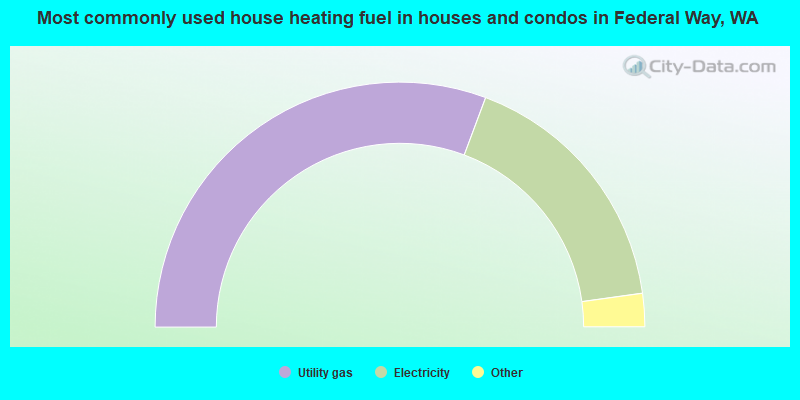
- 61.4%Utility gas
- 34.2%Electricity
- 1.6%Bottled, tank, or LP gas
- 1.4%Fuel oil, kerosene, etc.
- 0.9%Wood
- 0.4%No fuel used
- 0.1%Other fuel
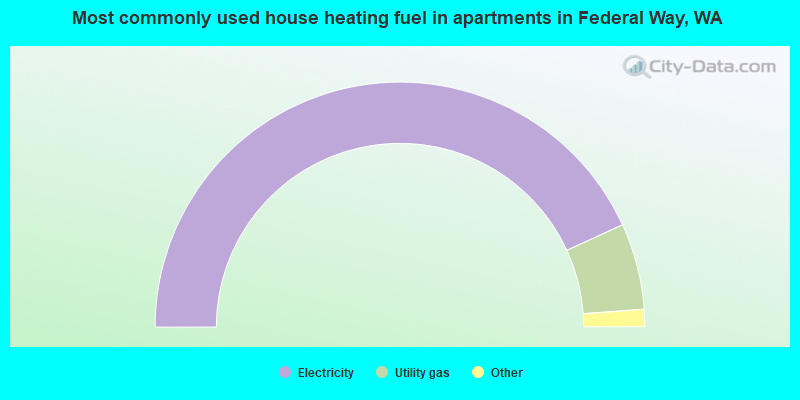
- 86.3%Electricity
- 11.4%Utility gas
- 0.7%Wood
- 0.6%Bottled, tank, or LP gas
- 0.4%Fuel oil, kerosene, etc.
- 0.4%Other fuel
- 0.2%No fuel used
Private vs. public school enrollment:
| Here: | 15.2% |
| Washington: | 12.4% |
| Here: | 3.4% |
| Washington: | 9.2% |
| Here: | 12.2% |
| Washington: | 16.5% |


