Housing density: 1,047 houses/condos per square mile
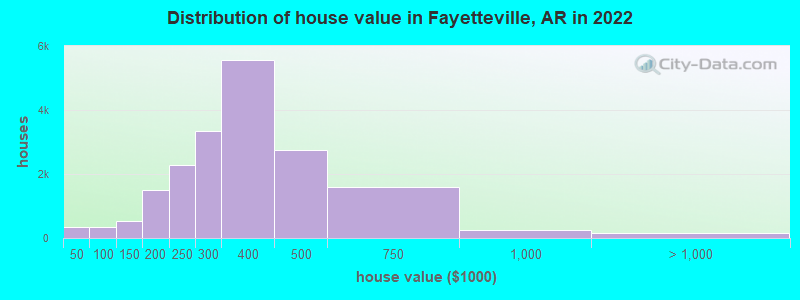
Median price asked for vacant for-sale houses and condos in 2022: $372,713.
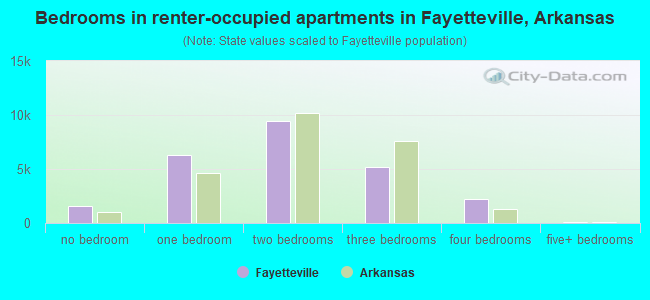
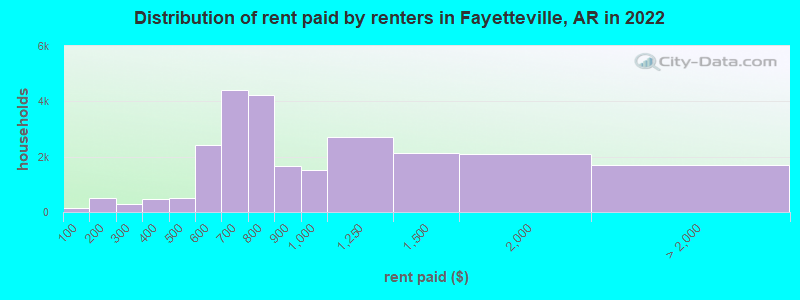
Median contract rent in 2022: $775 (lower quartile is $641, upper quartile is $1,163)
Median rent asked for vacant for-rent units in 2022: $755
Median gross rent in Fayetteville, AR in 2022: $927
Housing units in Fayetteville with a mortgage: 11,380 (447 second mortgage, 34 home equity loan, 329 both second mortgage and home equity loan) Houses without a mortgage: 466
Median household income for houses/condos with a mortgage: $99,717
Median household income for apartments without a mortgage: $57,860
10,964 married couples with children.
3,980 single-parent households (1,222 men, 2,758 women).
91.3% of residents of Fayetteville speak English at home.
4.6% of residents speak Spanish at home (69% speak English very well, 13% speak English well, 10% speak English not well, 7% don't speak English at all).
1.9% of residents speak other Indo-European language at home (91% speak English very well, 7% speak English well, 2% speak English not well).
1.6% of residents speak Asian or Pacific Island language at home (66% speak English very well, 24% speak English well, 7% speak English not well, 3% don't speak English at all).
0.6% of residents speak other language at home (73% speak English very well, 21% speak English well, 6% speak English not well).
Foreign born population: 5,467 (5.5%)
(23.8% of them are naturalized citizens)
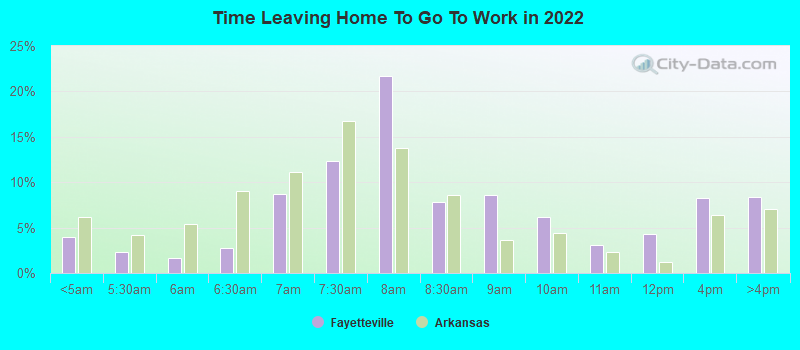
Percentage of workers working in this county: 83.6% Number of people working at home: 7,373 (14.5% of all workers)
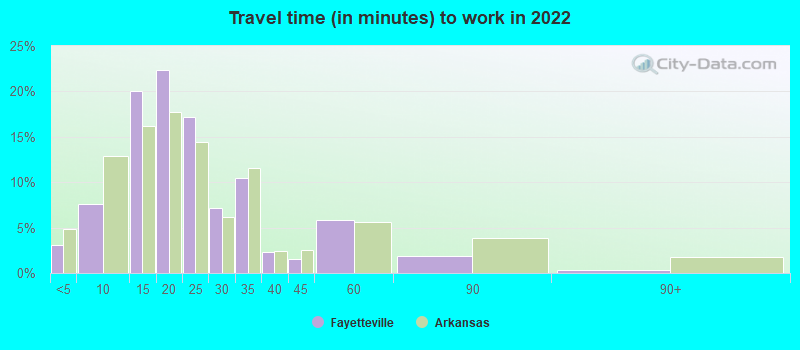
Travel time to work (commute)
Less than 5 minutes: 1,293
5 to 9 minutes: 3,894
10 to 14 minutes: 10,569
15 to 19 minutes: 11,179
20 to 24 minutes: 4,487
25 to 29 minutes: 3,895
30 to 34 minutes: 4,171
35 to 39 minutes: 330
40 to 44 minutes: 319
45 to 59 minutes: 1,044
60 to 89 minutes: 573
90 or more minutes: 454
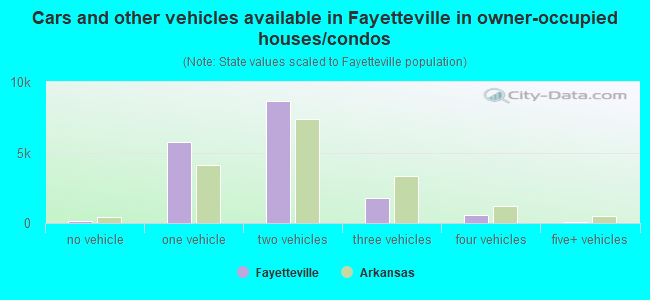
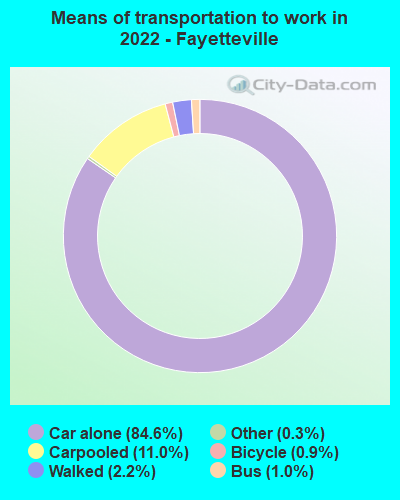
Means of transportation to work:
Drove a car alone: 47,398 (76.4%)
Carpooled: 4,818 (7.8%)
Bus: 713 (1.1%)
Ferryboat: 21 (0.0%)
Taxi: 187 (0.3%)
Bicycle: 370 (0.6%)
Walked: 1,579 (2.5%)
Worked at home: 7,373 (11.9%)
Unemployment by race in 2022
Unemployment rate for White non-Hispanic residents
6.1%Males
9.2%Females
Unemployment rate for Black residents
3.1%Males
2.3%Females
Unemployment rate for American Indian and Alaska Native residents
4.2%Males
9.6%Females
Unemployment rate for Asian residents
2.3%Males
1.3%Females
Unemployment rate for other race residents
12.6%Males
1.9%Females
Unemployment rate for two or more race residents
6.3%Males
2.4%Females
Unemployment rate for Hispanic or Latino residents
4.8%Males
0.8%Females
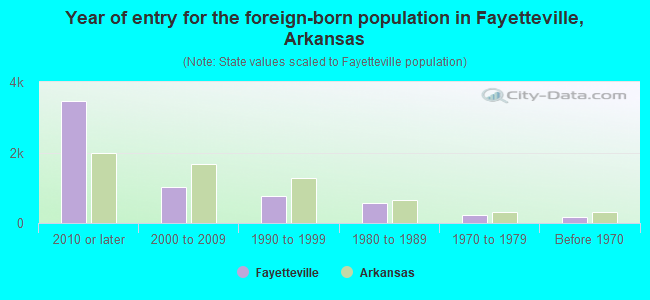
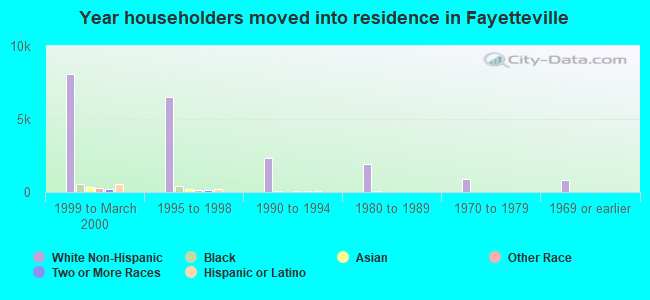
Year of entry for the foreign-born population in Fayetteville, Arkansas
3,4622010 or later
1,0092000 to 2009
7691990 to 1999
5721980 to 1989
2131970 to 1979
165Before 1970
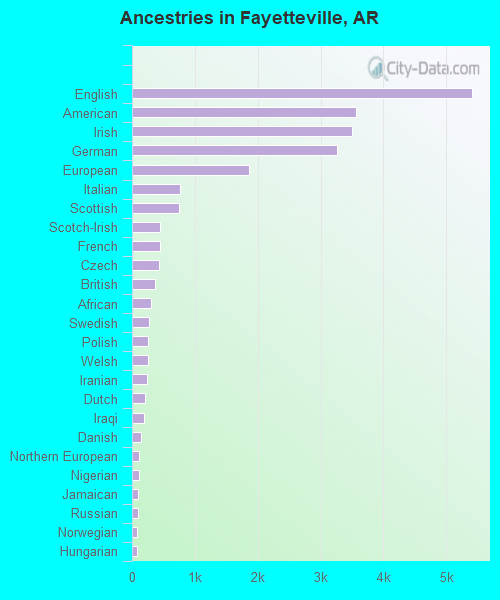
First ancestries reported:
English: 5,409 (14.2%)
American: 3,557 (9.4%)
Irish: 3,496 (9.2%)
German: 3,257 (8.6%)
European: 1,868 (4.9%)
Italian: 768 (2.0%)
Scottish: 740 (1.9%)
Scotch-Irish: 446 (1.2%)
French: 444 (1.2%)
Czech: 431 (1.1%)
British: 362 (1.0%)
African: 308 (0.8%)
Swedish: 270 (0.7%)
Polish: 253 (0.7%)
Welsh: 253 (0.7%)
Iranian: 233 (0.6%)
Dutch: 214 (0.6%)
Iraqi: 183 (0.5%)
Danish: 139 (0.4%)
Northern European: 105 (0.3%)
Nigerian: 104 (0.3%)
Jamaican: 92 (0.2%)
Russian: 89 (0.2%)
Norwegian: 83 (0.2%)
Hungarian: 82 (0.2%)
Greek: 81 (0.2%)
Scandinavian: 74 (0.2%)
Finnish: 70 (0.2%)
Brazilian: 67 (0.2%)
Turkish: 65 (0.2%)
Ukrainian: 65 (0.2%)
Zimbabwean: 63 (0.2%)
Palestinian: 52 (0.1%)
Swiss: 49 (0.1%)
French Canadian: 46 (0.1%)
Canadian: 44 (0.1%)
Kenyan: 41 (0.1%)
Romanian: 40 (0.1%)
Portuguese: 39 (0.1%)
South African: 32 (0.08%)
Lithuanian: 31 (0.08%)
Afghan: 31 (0.08%)
Austrian: 29 (0.08%)
Jordanian: 27 (0.07%)
Slavic: 22 (0.06%)
Bulgarian: 19 (0.05%)
Eastern European: 19 (0.05%)
Serbian: 16 (0.04%)
Czechoslovakian: 15 (0.04%)
Bahamian: 5 (0.01%)
Most common places of birth for foreign-born residents (%):
Mexico
Fayetteville:
16.4% (941)
Arkansas:
40.2% (61,075)
China, excluding Hong Kong and Taiwan
Fayetteville:
8.1% (461)
Arkansas:
2.3% (3,503)
Brazil
Fayetteville:
5.3% (304)
Arkansas:
1.0% (1,447)
Bangladesh
Fayetteville:
4.6% (263)
Arkansas:
0.4% (618)
Cameroon
Fayetteville:
3.9% (221)
Arkansas:
0.2% (275)
Guatemala
Fayetteville:
3.7% (211)
Arkansas:
3.5% (5,376)
Other Eastern Africa
Fayetteville:
3.1% (177)
Arkansas:
0.2% (317)
Iran
Fayetteville:
2.9% (167)
Arkansas:
0.3% (487)
Canada
Fayetteville:
2.9% (165)
Arkansas:
1.4% (2,174)
Iraq
Fayetteville:
2.7% (157)
Arkansas:
0.2% (250)
India
Fayetteville:
2.7% (156)
Arkansas:
6.1% (9,278)
Japan
Fayetteville:
2.3% (133)
Arkansas:
0.4% (603)
Philippines
Fayetteville:
2.1% (119)
Arkansas:
2.7% (4,128)
Germany
Fayetteville:
2.1% (119)
Arkansas:
1.8% (2,721)
Panama
Fayetteville:
1.9% (107)
Arkansas:
0.4% (563)
Jordan
Fayetteville:
1.7% (99)
Arkansas:
0.2% (271)
Nigeria
Fayetteville:
1.7% (95)
Arkansas:
0.4% (627)
Marshall Islands
Fayetteville:
1.6% (94)
Arkansas:
4.3% (6,456)
England
Fayetteville:
1.5% (88)
Arkansas:
0.9% (1,434)
Place of birth for U.S.-born residents:
This state: 42,996
Other state: 49,513
Northeast: 3,119
Midwest: 14,776
South: 23,183
West: 8,435
73.4% of Fayetteville residents lived in the same house 1 years ago. Out of people who lived in different houses, 31.6% lived in this county. Out of people who lived in different counties, 52.0% lived in Arkansas.
Fayetteville:
73.4%
State average:
87.0%
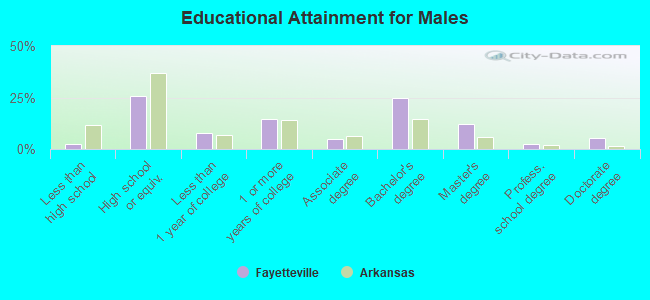
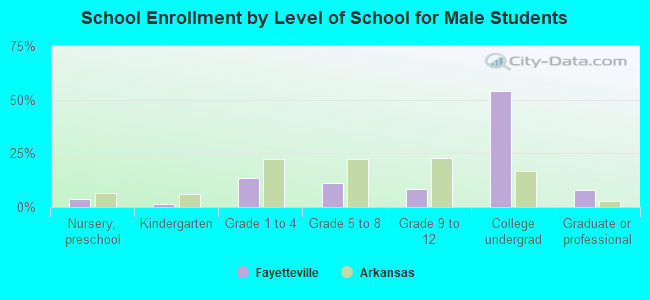
Education attainment for males 25 years and older:
No schooling: 0
Nursery to 4th grade: 0
5th and 6th grade: 168
7th and 8th grade: 97
9th grade: 0
10th grade: 72
11th grade: 240
12th grade, no diploma: 26
High school graduate (or equivalency): 6,938
Less than 1 year of college: 2,092
Some college more than 1 year, no degree: 3,962
Associate degree: 1,262
Bachelor's degree: 6,687
Master's degree: 3,213
Professional school degree: 633
Doctorate degree: 1,497
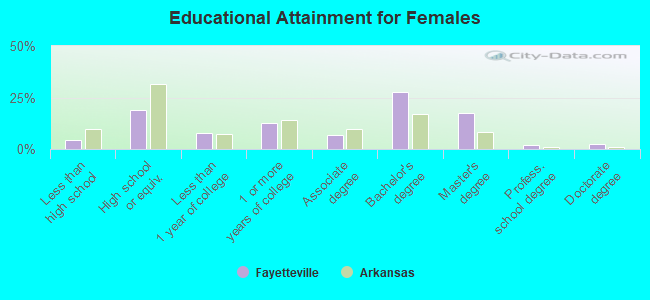
Education attainment for females 25 years and older:
No schooling: 59
Nursery to 4th grade: 6
5th and 6th grade: 0
7th and 8th grade: 248
9th grade: 57
10th grade: 291
11th grade: 376
12th grade, no diploma: 217
High school graduate (or equivalency): 5,510
Less than 1 year of college: 2,277
Some college more than 1 year, no degree: 3,700
Associate degree: 1,947
Bachelor's degree: 8,021
Master's degree: 5,126
Professional school degree: 562
Doctorate degree: 726
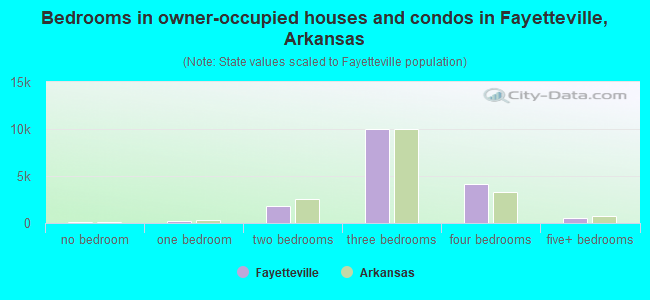
Housing units in structures:
One, detached: 22,769
One, attached: 2,505
Two: 1,902
3 or 4: 2,272
5 to 9: 3,574
10 to 19: 6,535
20 to 49: 2,516
50 or more: 2,909
Mobile homes: 497
Housing units lacking complete plumbing facilities in 2022: 0.3%
Housing units lacking complete kitchen facilities in 2022: 1.4%