Farragut, TN (Tennessee) Houses and Residents
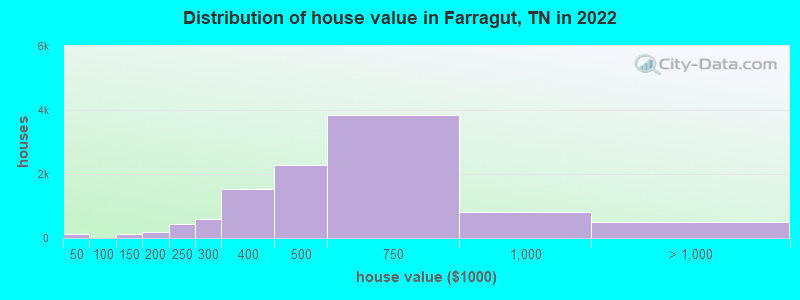
Estimated median house or condo value in 2022: $570,072 (it was $191,400 in 2000 )
Farragut:
$570,072Tennessee:
$284,800
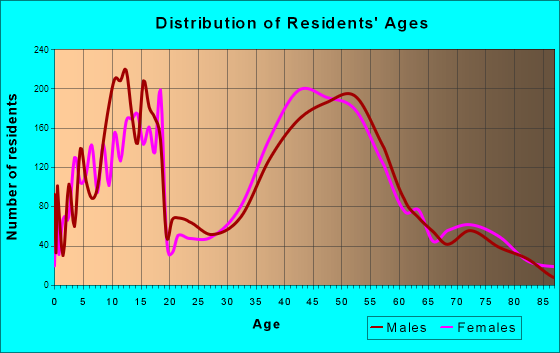
Lower value quartile - upper value quartile: $408,730 - $770,750Total population: 21,687 (Urban population: 17,858, Rural population: 21 (all nonfarm) )
Houses: 9,216 (9,043 occupied: 7,859 owner occupied, 1,256 renter occupied )
% of renters here:
14%State:
33%
Housing density: 573 houses/condos per square mile
Median price asked for vacant for-sale houses and condos in 2022: $3,254,588.
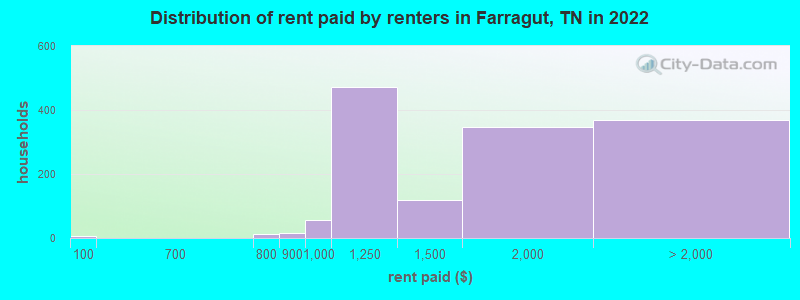
Median contract rent in 2022: $1,286 (lower quartile is $1,170, upper quartile is $1,885)
Median rent asked for vacant for-rent units in 2022: $1,395
Median gross rent in Farragut, TN in 2022: $1,573
Housing units in Farragut with a mortgage: 4,771 (623 second mortgage, 0 home equity loan, 573 both second mortgage and home equity loan )Houses without a mortgage: 72
Median household income for houses/condos with a mortgage: $160,708
Median household income for apartments without a mortgage: $125,335
Median monthly housing costs: $1,553
Data:
Median house or condo value ($)
Median house or condo value ($ change since 2000)
Median house or condo value ($) - White
Median house or condo value ($) - Black or African American
Median house or condo value ($) - Asian
Median house or condo value ($) - Hispanic or Latino
Median house or condo value ($) - American Indian and Alaska Native
Median house or condo value ($) - Multirace
Median house or condo value ($) - Other Race
Median price asked for mobile homes ($)
Household density (households per square mile)
Mean house or condo value by units in structure - 1, detached ($)
Mean house or condo value by units in structure - 1, attached ($)
Mean house or condo value by units in structure - 2 ($)
Mean house or condo value by units in structure by units in structure - 3 or 4 ($)
Mean house or condo value by units in structure - 5 or more ($)
Mean house or condo value by units in structure - Boat, RV, van, etc. ($)
Mean house or condo value by units in structure - Mobile home ($)
Median contract rent ($)
Median contract rent - Lower quartile ($)
Median contract rent - Upper quartile ($)
Median gross rent ($)
Urban houses (%)
Rural houses (%)
Houses occupied (%)
Houses occupied (% change since 2000)
Houses owner occupied (%)
Houses owner occupied (% change since 2000)
Houses renter occupied (%)
Houses renter occupied (% change since 2000)
Vacant housing units - For rent (%)
Vacant housing units - For rent (% change since 2000)
Vacant housing units - For sale only (%)
Vacant housing units - For sale only (% change since 2000)
Vacant housing units - Rented or sold, not occupied (%)
Vacant housing units - Rented or sold, not occupied (% change since 2000)
Vacant housing units - For seasonal, recreational, or occasional use (%)
Vacant housing units - For seasonal, recreational, or occasional use (% change since 2000)
Vacant housing units - For migrant workers (%)
Vacant housing units - For migrant workers (% change since 2000)
Vacant housing units - Other vacant (%)
Vacant housing units - Other vacant (% change since 2000)
Median monthly housing costs ($)
Median household income for houses/condos with a mortgage ($)
Median household income for houses/condos without a mortgage ($)
Median household income ($)
Median household income ($) - White
Median household income ($) - Black or African American
Median household income ($) - Asian
Median household income ($) - Hispanic or Latino
Median household income ($) - American Indian and Alaska Native
Median household income ($) - Multirace
Median household income ($) - Other Race
Mortgage status - with mortgage (%)
Mortgage status - with second mortgage (%)
Mortgage status - with home equity loan (%)
Mortgage status - with both second mortgage and home equity loan (%)
Mortgage status - without a mortgage (%)
Median year house/condo built
Median year apartment built
Household type by relationship - Male householder living alone (%)
Household type by relationship - Male householder not living alone (%)
Household type by relationship - Female householder living alone (%)
Household type by relationship - Female householder not living alone (%)
Household type by relationship - Opposite-Sex spouse (%)
Household type by relationship - Same-Sex spouse (%)
Household type by relationship - Opposite-Sex unmarried partner (%)
Household type by relationship - Same-Sex unmarried partner (%)
Household type by relationship - In group quarters (%)
Size of family households - 2-person household (%)
Size of family households - 3-person household (%)
Size of family households - 4-person household (%)
Size of family households - 5-person household (%)
Size of family households - 6-person household (%)
Size of family households - 7-or-more-person household (%)
Size of nonfamily households - 1-person household (%)
Size of nonfamily households - 2-person household (%)
Size of nonfamily households - 3-person household (%)
Size of nonfamily households - 4-person household (%)
Size of nonfamily households - 5-person household (%)
Size of nonfamily households - 6-person household (%)
Size of nonfamily households - 7-or-moreperson household (%)
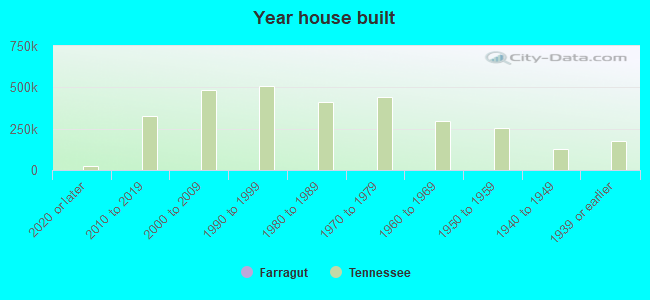
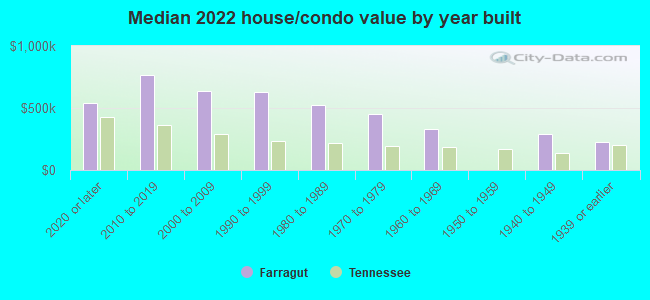
Year house built - Built 2010 or later (%)
Year house built - Built 2000 to 2009 (%)
Year house built - Built 1990 to 1999 (%)
Year house built - Built 1980 to 1989 (%)
Year house built - Built 1970 to 1979 (%)
Year house built - Built 1960 to 1969 (%)
Year house built - Built 1950 to 1959 (%)
Year house built - Built 1940 to 1949 (%)
Year house built - Built 1939 or earlier (%)
Median number of rooms in houses and condos
Median number of rooms in apartments
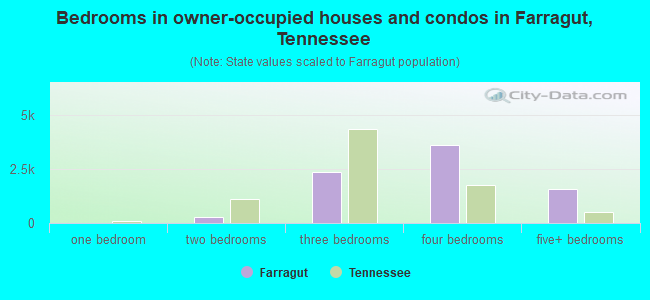
Median number of bedrooms in owner occupied houses
Mean number of bedrooms in owner occupied houses
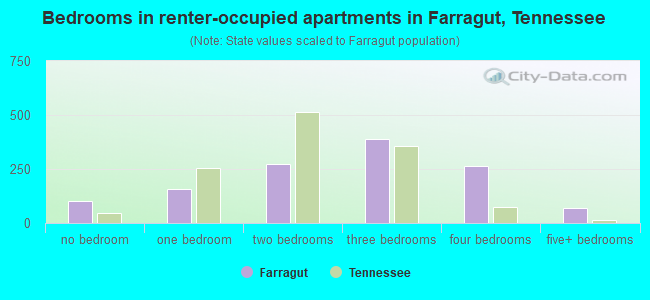
Median number of bedrooms in renter occupied houses
Mean number of bedrooms in renter occupied houses
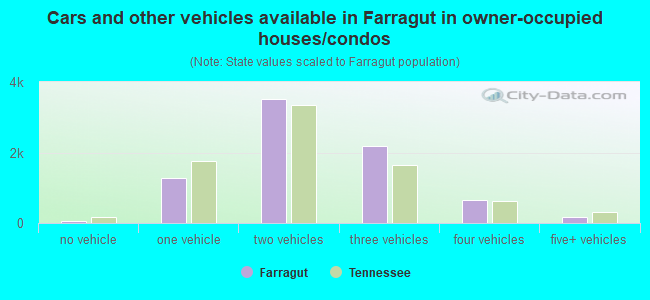
Median number of vehichles in owner occupied houses
Mean number of vehichles in owner occupied houses
Median number of vehichles in renter occupied houses
Mean number of vehichles in renter occupied houses
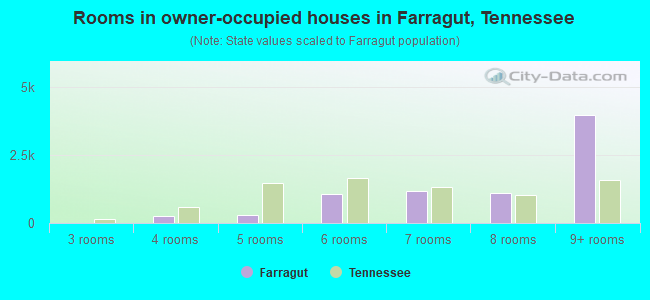
Rooms in owner-occupied houses - 1 room (%)
Rooms in owner-occupied houses - 2 rooms (%)
Rooms in owner-occupied houses - 3 rooms (%)
Rooms in owner-occupied houses - 4 rooms (%)
Rooms in owner-occupied houses - 5 rooms (%)
Rooms in owner-occupied houses - 6 rooms (%)
Rooms in owner-occupied houses - 7 rooms (%)
Rooms in owner-occupied houses - 8 rooms (%)
Rooms in owner-occupied houses - 9+ rooms (%)
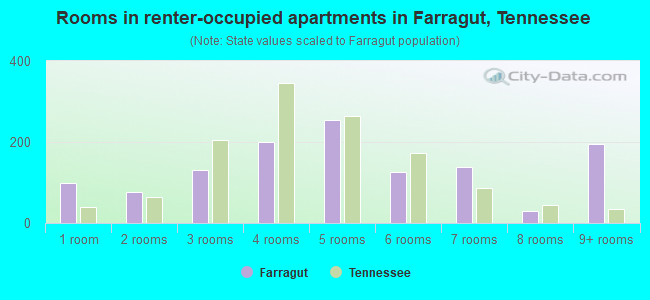
Rooms in renter-occupied houses - 1 room (%)
Rooms in renter-occupied houses - 2 rooms (%)
Rooms in renter-occupied houses - 3 rooms (%)
Rooms in renter-occupied houses - 4 rooms (%)
Rooms in renter-occupied houses - 5 rooms (%)
Rooms in renter-occupied houses - 6 rooms (%)
Rooms in renter-occupied houses - 7 rooms (%)
Rooms in renter-occupied houses - 8 rooms (%)
Rooms in renter-occupied houses - 9+ rooms (%)
Bedrooms in owner-occupied houses - no bedrooms (%)
Bedrooms in owner-occupied houses - 1 bedroom (%)
Bedrooms in owner-occupied houses - 2 bedrooms (%)
Bedrooms in owner-occupied houses - 3 bedrooms (%)
Bedrooms in owner-occupied houses - 4 bedrooms (%)
Bedrooms in owner-occupied houses - 5+ bedrooms (%)
Bedrooms in renter-occupied houses - no bedrooms (%)
Bedrooms in renter-occupied houses - 1 bedroom (%)
Bedrooms in renter-occupied houses - 2 bedrooms (%)
Bedrooms in renter-occupied houses - 3 bedrooms (%)
Bedrooms in renter-occupied houses - 4 bedrooms (%)
Bedrooms in renter-occupied houses - 5+ bedrooms (%)
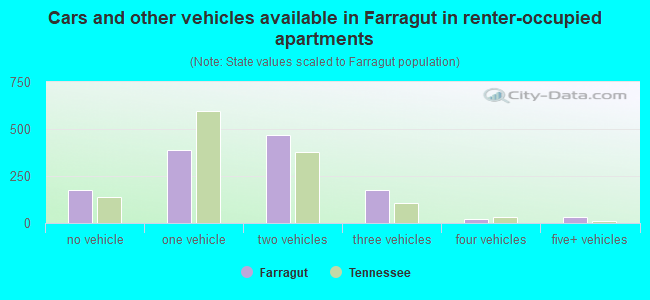
Vehicles available in owner-occupied houses - no vehicle available (%)
Vehicles available in owner-occupied houses - 1 vehicle available(%)
Vehicles available in owner-occupied houses - 2 Vehicles available (%)
Vehicles available in owner-occupied houses - 3 Vehicles available (%)
Vehicles available in owner-occupied houses - 4 Vehicles available (%)
Vehicles available in owner-occupied houses - 5+ Vehicles available (%)
Vehicles available in renter-occupied houses - no vehicle available (%)
Vehicles available in renter-occupied houses - 1 vehicle available (%)
Vehicles available in renter-occupied houses - 2 Vehicles available (%)
Vehicles available in renter-occupied houses - 3 Vehicles available (%)
Vehicles available in renter-occupied houses - 4 Vehicles available (%)
Vehicles available in renter-occupied houses - 5+ Vehicles available (%)
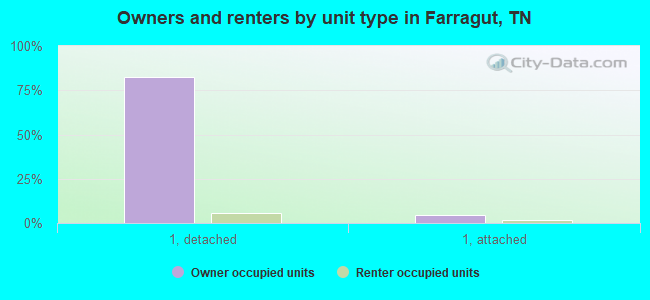
Housing units in structures - 1, detached (%)
Housing units in structures - 1, attached (%)
Housing units in structures - 2 (%)
Housing units in structures - 3 or 4 (%)
Housing units in structures - 5 to 9 (%)
Housing units in structures - 10 to 19 (%)
Housing units in structures - 20 to 49 (%)
Housing units in structures - 50 or more (%)
Housing units in structures - Mobile home (%)
Housing units in structures - Boat, RV, van, etc. (%)
Housing units in structures - Owners - 1, detached (%)
Housing units in structures - Owners - 1, attached (%)
Housing units in structures - Owners - 2 (%)
Housing units in structures - Owners - 3 or 4 (%)
Housing units in structures - Owners - 5 to 9 (%)
Housing units in structures - Owners - 10 to 19 (%)
Housing units in structures - Owners - 20 to 49 (%)
Housing units in structures - Owners - 50 or more (%)
Housing units in structures - Owners - Mobile home (%)
Housing units in structures - Owners - Boat, RV, van, etc. (%)
Housing units in structures - Renters - 1, detached (%)
Housing units in structures - Renters - 1, attached (%)
Housing units in structures - Renters - 2 (%)
Housing units in structures - Renters - 3 or 4 (%)
Housing units in structures - Renters - 5 to 9 (%)
Housing units in structures - Renters - 10 to 19 (%)
Housing units in structures - Renters - 20 to 49 (%)
Housing units in structures - Renters - 50 or more (%)
Housing units in structures - Renters - Mobile home (%)
Housing units in structures - Renters - Boat, RV, van, etc. (%)
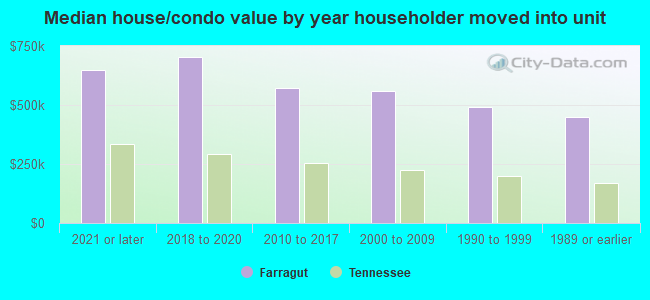
House/condo owner moved in on average (years ago)
Renter moved in on average (years ago)
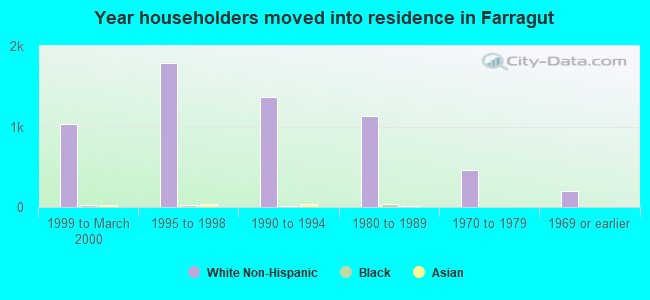
Year householder moved into unit - Moved in 1999 to March 2000 (%)
Year householder moved into unit - Moved in 1999 to March 2000 (%) - White
Year householder moved into unit - Moved in 1999 to March 2000 (%) - Black or African American
Year householder moved into unit - Moved in 1999 to March 2000 (%) - Asian
Year householder moved into unit - Moved in 1999 to March 2000 (%) - Hispanic or Latino
Year householder moved into unit - Moved in 1999 to March 2000 (%) - American Indian and Alaska Native
Year householder moved into unit - Moved in 1999 to March 2000 (%) - Multirace
Year householder moved into unit - Moved in 1999 to March 2000 (%) - Other Race
Year householder moved into unit - Moved in 1995 to 1998 (%)
Year householder moved into unit - Moved in 1995 to 1998 (%) - White
Year householder moved into unit - Moved in 1995 to 1998 (%) - Black or African American
Year householder moved into unit - Moved in 1995 to 1998 (%) - Asian
Year householder moved into unit - Moved in 1995 to 1998 (%) - Hispanic or Latino
Year householder moved into unit - Moved in 1995 to 1998 (%) - American Indian and Alaska Native
Year householder moved into unit - Moved in 1995 to 1998 (%) - Multirace
Year householder moved into unit - Moved in 1995 to 1998 (%) - Other Race
Year householder moved into unit - Moved in 1990 to 1994 (%)
Year householder moved into unit - Moved in 1990 to 1994 (%) - White
Year householder moved into unit - Moved in 1990 to 1994 (%) - Black or African American
Year householder moved into unit - Moved in 1990 to 1994 (%) - Asian
Year householder moved into unit - Moved in 1990 to 1994 (%) - Hispanic or Latino
Year householder moved into unit - Moved in 1990 to 1994 (%) - American Indian and Alaska Native
Year householder moved into unit - Moved in 1990 to 1994 (%) - Multirace
Year householder moved into unit - Moved in 1990 to 1994 (%) - Other Race
Year householder moved into unit - Moved in 1980 to 1989 (%)
Year householder moved into unit - Moved in 1980 to 1989 (%) - White
Year householder moved into unit - Moved in 1980 to 1989 (%) - Black or African American
Year householder moved into unit - Moved in 1980 to 1989 (%) - Asian
Year householder moved into unit - Moved in 1980 to 1989 (%) - Hispanic or Latino
Year householder moved into unit - Moved in 1980 to 1989 (%) - American Indian and Alaska Native
Year householder moved into unit - Moved in 1980 to 1989 (%) - Multirace
Year householder moved into unit - Moved in 1980 to 1989 (%) - Other Race
Year householder moved into unit - Moved in 1970 to 1979 (%)
Year householder moved into unit - Moved in 1970 to 1979 (%) - White
Year householder moved into unit - Moved in 1970 to 1979 (%) - Black or African American
Year householder moved into unit - Moved in 1970 to 1979 (%) - Asian
Year householder moved into unit - Moved in 1970 to 1979 (%) - Hispanic or Latino
Year householder moved into unit - Moved in 1970 to 1979 (%) - American Indian and Alaska Native
Year householder moved into unit - Moved in 1970 to 1979 (%) - Multirace
Year householder moved into unit - Moved in 1970 to 1979 (%) - Other Race
Year householder moved into unit - Moved in 1969 or earlier (%)
Year householder moved into unit - Moved in 1969 or earlier (%) - White
Year householder moved into unit - Moved in 1969 or earlier (%) - Black or African American
Year householder moved into unit - Moved in 1969 or earlier (%) - Asian
Year householder moved into unit - Moved in 1969 or earlier (%) - Hispanic or Latino
Year householder moved into unit - Moved in 1969 or earlier (%) - American Indian and Alaska Native
Year householder moved into unit - Moved in 1969 or earlier (%) - Multirace
Year householder moved into unit - Moved in 1969 or earlier (%) - Other Race
Housing units lacking complete plumbing facilities (%)
Housing units lacking complete kitchen facilities (%)
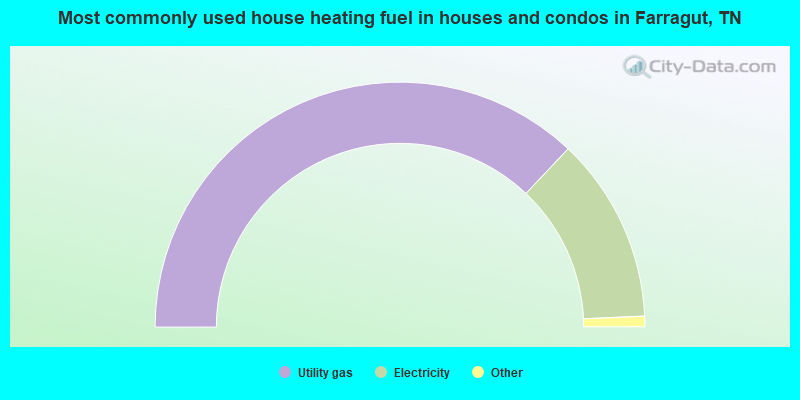
House heating fuel used in houses and condos - Utility gas (%)
House heating fuel used in houses and condos - Bottled, tank, or LP gas (%)
House heating fuel used in houses and condos - Electricity (%)
House heating fuel used in houses and condos - Fuel oil, kerosene, etc. (%)
House heating fuel used in houses and condos - Coal or coke (%)
House heating fuel used in houses and condos - Wood (%)
House heating fuel used in houses and condos - Solar energy (%)
House heating fuel used in houses and condos - Other fuel (%)
House heating fuel used in houses and condos - No fuel used (%)
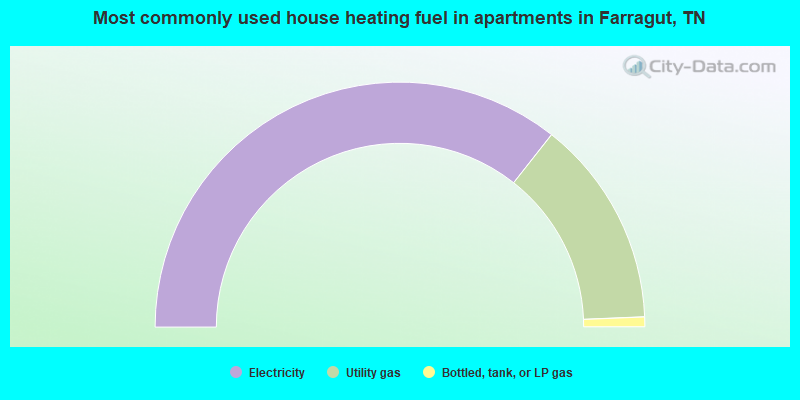
House heating fuel used in apartments - Utility gas (%)
House heating fuel used in apartments - Bottled, tank, or LP gas (%)
House heating fuel used in apartments - Electricity (%)
House heating fuel used in apartments - Fuel oil, kerosene, etc. (%)
House heating fuel used in apartments - Coal or coke (%)
House heating fuel used in apartments - Wood (%)
House heating fuel used in apartments - Solar energy (%)
House heating fuel used in apartments - Other fuel (%)
House heating fuel used in apartments - No fuel used (%)
Latest news about housing in Farragut, TN collected exclusively by city-data.com from local newspapers, TV, and radio stations
Median year house/condo built: 1993Median year apartment built: 1994Household type by relationship:
Households: 24,445
Male householders: 4,988 (642 living alone ), Female householders: 4,080 (1,204 living alone )6,210 spouses (6,130 opposite-sex spouses ), 237 unmarried partners , (201 opposite-sex unmarried partners ), 7,400 children (6,762 natural , 214 adopted , 423 stepchildren ), 246 grandchildren , 36 brothers or sisters , 346 parents , 63 foster children , 172 other relatives , 358 non-relatives In group quarters: 304
Size of family households: 3,326 2-persons , 1,882 3-persons , 1,201 4-persons , 457 5-persons , 186 6-persons , 26 7-or-more-persons .
Size of nonfamily households: 1,868 1-person , 137 2-persons , 75 3-persons .
4,261 married couples with children. single-parent households (190 men , 466 women ).
92.7% of residents of Farragut speak English at home. of residents speak Spanish at home (82% speak English very well , 14% speak English well , 3% speak English not well ).of residents speak other Indo-European language at home (85% speak English very well , 4% speak English well , 12% speak English not well ).of residents speak Asian or Pacific Island language at home (65% speak English very well , 25% speak English well , 10% speak English not well ).of residents speak other language at home (48% speak English very well , 52% speak English well ).
Foreign born population: 1,686 (6.9%)of them are naturalized citizens )
Median number of rooms in houses and condos:
Median number of rooms in apartments
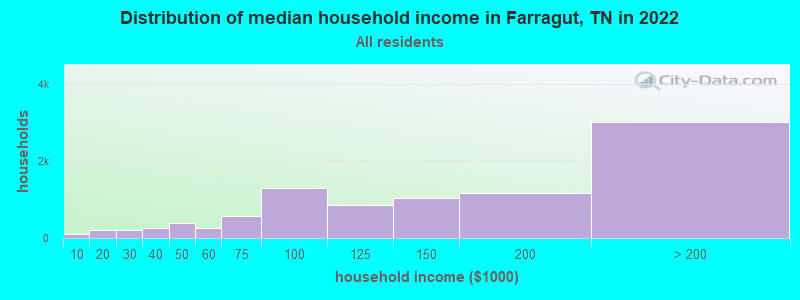
Farragut, TN household income distribution 116 Less than $10,000207 $10,000 to $19,999202 $20,000 to $29,999248 $30,000 to $39,999394 $40,000 to $49,999260 $50,000 to $59,999573 $60,000 to $74,9991,292 $75,000 to $99,999854 $100,000 to $124,9991,049 $125,000 to $149,9991,171 $150,000 to $199,9993,015 $200,000 or more
Home value of owner - occupied houses in 2022 in Farragut, TN 28 Less than $10,0003 $15,000 to $19,99966 $25,000 to $29,99922 $35,000 to $39,99911 $80,000 to $89,9996 $100,000 to $124,999106 $125,000 to $149,99942 $150,000 to $174,999136 $175,000 to $199,999445 $200,000 to $249,999600 $250,000 to $299,9991,517 $300,000 to $399,9992,288 $400,000 to $499,9993,856 $500,000 to $749,999796 $750,000 to $999,999363 $1,000,000 to $1,499,99999 $1,500,000 to $1,999,99951 $2,000,000 or moreRent paid by renters in 2022 in Farragut, TN 7 Less than $10011 $700 to $74915 $800 to $89954 $900 to $999470 $1,000 to $1,249119 $1,250 to $1,499347 $1,500 to $1,999181 $2,000 to $2,49916 $2,500 to $2,99925 $3,000 to $3,49913 $3,500 or more133 No cash rent
Percentage of workers working in this county: 77.7%Number of people working at home: 2,953 (24.0% of all workers )
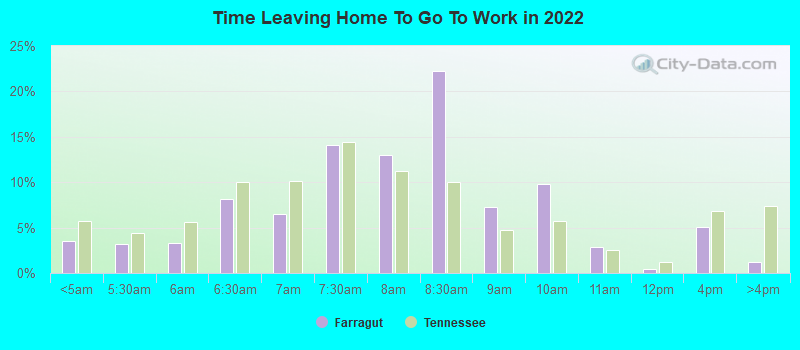
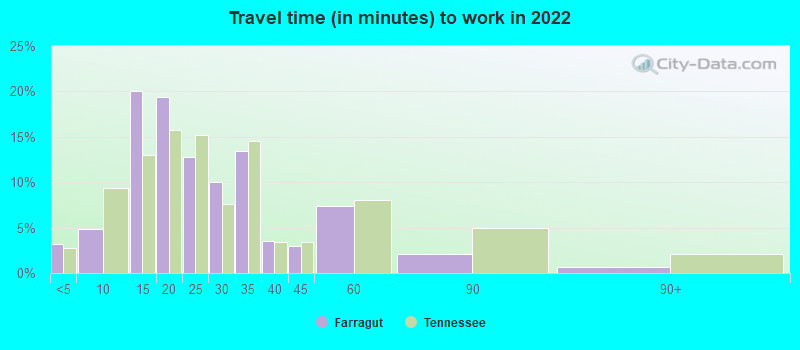
Travel time to work (commute)
Less than 5 minutes: 3755 to 9 minutes: 54510 to 14 minutes: 1,41515 to 19 minutes: 1,99720 to 24 minutes: 1,76725 to 29 minutes: 83630 to 34 minutes: 1,69035 to 39 minutes: 20940 to 44 minutes: 26545 to 59 minutes: 17960 to 89 minutes: 16090 or more minutes: 127
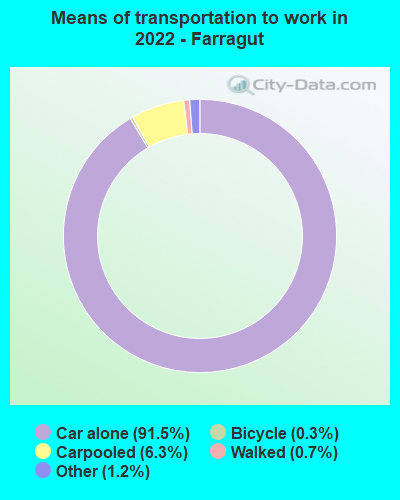
Means of transportation to work:
Drove a car alone: 7,588 (69.2%)Carpooled: 562 (5.1%)Taxi: 121 (1.1%)Bicycle: 38 (0.3%)Walked: 58 (0.5%)Worked at home: 2,953 (26.9%)
Unemployment by race in 2022
Unemployment rate for White non-Hispanic residents 1.5% Males0.8% FemalesUnemployment rate for American Indian and Alaska Native residents 50.4% FemalesUnemployment rate for Hispanic or Latino residents 12.8% Males
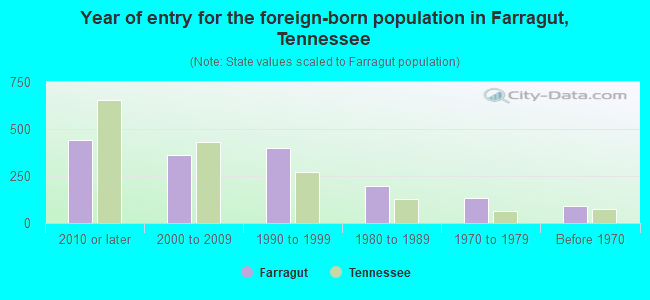
Year of entry for the foreign-born population in Farragut, Tennessee
443 2010 or later 363 2000 to 2009 398 1990 to 1999 197 1980 to 1989 134 1970 to 1979 88 Before 1970
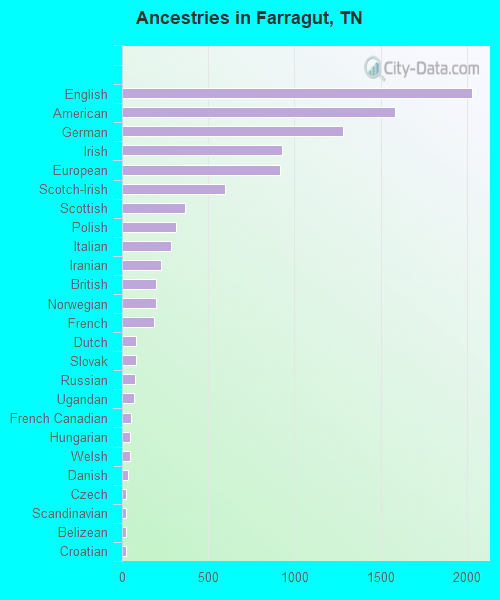
First ancestries reported:
English: 2,027 (16.7%)
American: 1,583 (13.1%)
German: 1,284 (10.6%)
Irish: 927 (7.7%)
European: 915 (7.6%)
Scotch-Irish: 598 (4.9%)
Scottish: 368 (3.0%)
Polish: 313 (2.6%)
Italian: 284 (2.3%)
Iranian: 227 (1.9%)
British: 197 (1.6%)
Norwegian: 195 (1.6%)
French: 187 (1.5%)
Dutch: 84 (0.7%)
Slovak: 80 (0.7%)
Russian: 73 (0.6%)
Ugandan: 67 (0.6%)
French Canadian: 50 (0.4%)
Hungarian: 46 (0.4%)
Welsh: 46 (0.4%)
Danish: 32 (0.3%)
Czech: 26 (0.2%)
Scandinavian: 26 (0.2%)
Belizean: 26 (0.2%)
Croatian: 25 (0.2%)
Belgian: 22 (0.2%)
Greek: 22 (0.2%)
Eastern European: 21 (0.2%)
Romanian: 16 (0.1%)
Swedish: 16 (0.1%)
Brazilian: 15 (0.1%)
Swiss: 12 (0.10%)
Austrian: 11 (0.09%)
Macedonian: 7 (0.06%)
Jordanian: 6 (0.05%)
Australian: 4 (0.03%) Most common places of birth for foreign-born residents (%): India Farragut:
17.6% (276)Tennessee:
6.1% (23,079)
China, excluding Hong Kong and Taiwan Farragut:
13.9% (218)Tennessee:
3.3% (12,582)
Bosnia and Herzegovina Farragut:
10.5% (165)Tennessee:
0.3% (1,183)
Pakistan Farragut:
6.4% (100)Tennessee:
0.5% (2,053)
Canada Farragut:
6.1% (95)Tennessee:
2.7% (10,295)
Iran Farragut:
5.7% (89)Tennessee:
0.8% (2,872)
Poland Farragut:
5.2% (82)Tennessee:
0.4% (1,632)
Congo Farragut:
4.5% (71)Tennessee:
0.3% (1,075)
Korea Farragut:
4.2% (66)Tennessee:
2.3% (8,490)
Uganda Farragut:
3.7% (58)Tennessee:
0.1% (251)
Colombia Farragut:
2.9% (46)Tennessee:
1.0% (3,879)
Russia Farragut:
2.7% (42)Tennessee:
0.7% (2,448)
Germany Farragut:
2.7% (42)Tennessee:
2.2% (8,261)
Hungary Farragut:
2.3% (36)Tennessee:
0.1% (470)
Bangladesh Farragut:
1.7% (27)Tennessee:
0.2% (931)
Place of birth for U.S.-born residents:
This state: 10,715Other state: 11,295Northeast: 2,129Midwest: 2,556South: 5,480West: 1,074 90.1% of Farragut residents lived in the same house 1 years ago.
Out of people who lived in different houses, 30.9% lived in this county.
Out of people who lived in different counties, 43.8% lived in Tennessee.
Farragut:
90.1%State average:
87.0%
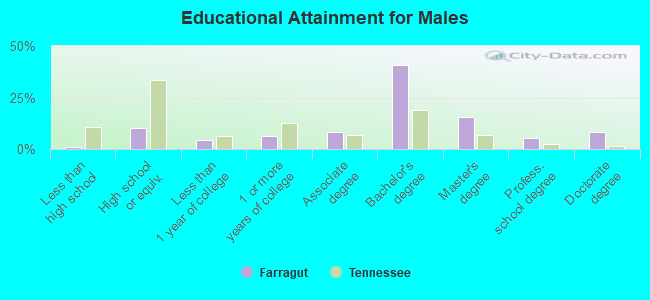
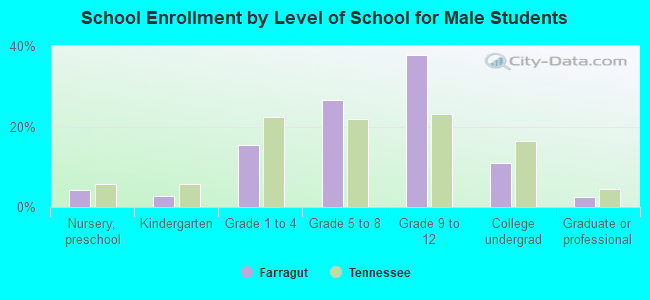
Education attainment for males 25 years and older:
No schooling: 0Nursery to 4th grade: 185th and 6th grade: 07th and 8th grade: 09th grade: 3710th grade: 2211th grade: 012th grade, no diploma: 11High school graduate (or equivalency): 822Less than 1 year of college: 345Some college more than 1 year, no degree: 538Associate degree: 671Bachelor's degree: 3,374Master's degree: 1,292Professional school degree: 447Doctorate degree: 668
Education attainment for females 25 years and older:
No schooling: 16Nursery to 4th grade: 45th and 6th grade: 57th and 8th grade: 299th grade: 410th grade: 911th grade: 3412th grade, no diploma: 40High school graduate (or equivalency): 1,062Less than 1 year of college: 317Some college more than 1 year, no degree: 848Associate degree: 1,056Bachelor's degree: 3,610Master's degree: 1,394Professional school degree: 428Doctorate degree: 168
Housing units in structures:
One, detached: 8,094One, attached: 491Two: 353 or 4: 2135 to 9: 16910 to 19: 1820 to 49: 1650 or more: 174Mobile homes: 3Housing units lacking complete kitchen facilities in 2022: 2.1%House/condo owner moved in on average 9 years ago
Renter moved in on average 1 years ago
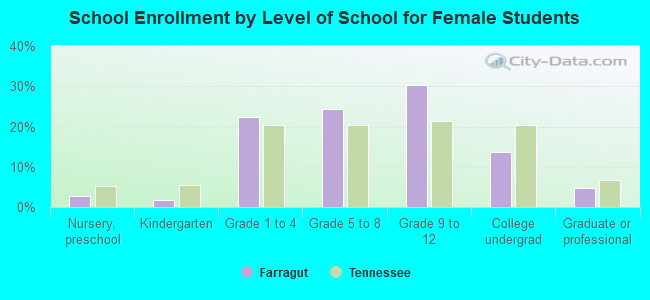
Private vs. public school enrollment:
Students in private schools in grades 1 to 8 (elementary and middle school): 656 Here:
25.6%Tennessee:
15.0%
Students in private schools in grades 9 to 12 (high school): 301 Here:
15.5%Tennessee:
16.2%
Students in private undergraduate colleges: 138 Here:
19.8%Tennessee:
23.5%