Farmingville, NY (New York) Houses and Residents
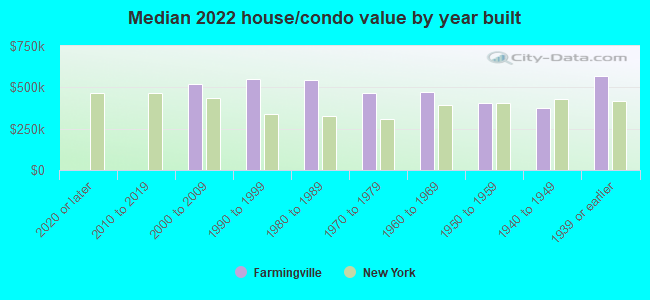
| Farmingville: | $471,761 |
| New York: | $400,400 |
Total population: 15,481 (All urban)
Houses: 5,197 (4,903 occupied: 4,323 owner occupied, 577 renter occupied)
| % of renters here: | 12% |
| State: | 46% |
Housing density: 1,150 houses/condos per square mile
Median price asked for vacant for-sale houses and condos in 2022: $613,522.
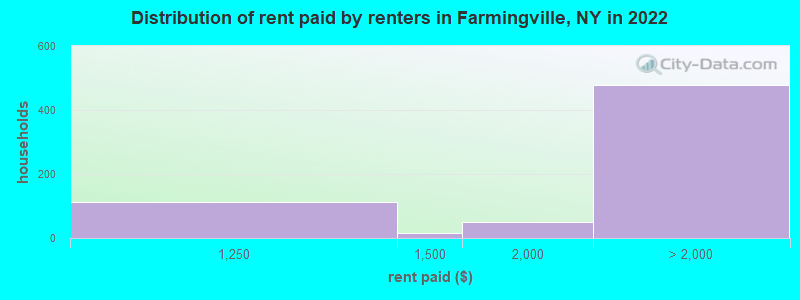
Median contract rent in 2022: over $2,000 (lower quartile is $1,682, upper quartile is over $2,000)
Median rent asked for vacant for-rent units in 2022: $3,830
Median gross rent in Farmingville, NY in 2022: over $2,000
Housing units in Farmingville with a mortgage: 3,254 (324 second mortgage, 0 home equity loan, 274 both second mortgage and home equity loan)
Houses without a mortgage: 146
Median household income for houses/condos with a mortgage: $141,839
Median household income for apartments without a mortgage: $88,138
Median monthly housing costs: $2,477
Compare current foreclosures near Farmingville, NY:
| Photo | Address | Area | Beds / Baths | Price | Details |
|---|---|---|---|---|---|

|
#1
Granny Rd
Farmingville, NY 11738
|
1,593 sq. feet
|
1 baths 4 beds |
show details | |

|
#2
Waverly Ave
Farmingville, NY 11738
|
2,139 sq. feet
|
2 baths 5 beds |
show details | |

|
#3
Horizon View Dr
Farmingville, NY 11738
|
- sq. feet
|
- baths - beds |
show details | |

|
#4
Overlook Dr
Farmingville, NY 11738
|
- sq. feet
|
- baths - beds |
show details | |

|
#5
Overlook Dr
Farmingville, NY 11738
|
- sq. feet
|
- baths - beds |
show details | |

|
#6
N Ocean Ave
Farmingville, NY 11738
|
- sq. feet
|
- baths - beds |
show details | |

|
#7
Jillit Dr
Smithtown, NY 11787
|
1,480 sq. feet
|
1 baths 3 beds |
$775,000
|
show details |

|
#8
Albright Rd
Coram, NY 11727
|
15,246 sq. feet
|
2 baths 4 beds |
$549,900
|
show details |

|
#9
Rocky Point Yaphank Rd
Rocky Point, NY 11778
|
850 sq. feet
|
1 baths 1 beds |
$192,900
|
show details |

|
#10
Rocky Point Yaphank Rd
Rocky Point, NY 11778
|
1,000 sq. feet
|
1 baths 2 beds |
$189,900
|
show details |
| Photo | Address | Area | Beds / Baths | Price | Details |
|---|---|---|---|---|---|

|
#11
Laurel Ln
Shirley, NY 11967
|
1,032 sq. feet
|
1 baths 3 beds |
$479,900
|
show details |

|
#12
Bayview Ave
Patchogue, NY 11772
|
1,488 sq. feet
|
1 baths 4 beds |
$585,000
|
show details |

|
#13
Silverleaf Ln
Islandia, NY 11749
|
1,932 sq. feet
|
3 baths 3 beds |
$667,900
|
show details |

|
#14
Houston Ct
Coram, NY 11727
|
650 sq. feet
|
1 baths 1 beds |
$219,900
|
show details |

|
#15
Lorring St
Patchogue, NY 11772
|
1,230 sq. feet
|
2 baths 3 beds |
$342,400
|
show details |

|
#16
Greg Ln
Brentwood, NY 11717
|
1,425 sq. feet
|
2 baths 3 beds |
$519,900
|
show details |

|
#17
Timber Ridge Dr
Commack, NY 11725
|
2,564 sq. feet
|
2 baths 4 beds |
$884,000
|
show details |

|
#18
John Dr
Farmingville, NY 11738
|
- sq. feet
|
- baths - beds |
show details | |

|
#19
Chestnut Ave
Farmingville, NY 11738
|
- sq. feet
|
- baths - beds |
show details | |

|
#20
Ramsy Ln
Farmingville, NY 11738
|
- sq. feet
|
- baths - beds |
show details |
| Photo | Address | Area | Beds / Baths | Price | Details |
|---|---|---|---|---|---|

|
#21
Beech Ave
Farmingville, NY 11738
|
- sq. feet
|
- baths - beds |
show details | |

|
#22
Rosemont Ave
Farmingville, NY 11738
|
- sq. feet
|
- baths - beds |
show details | |

|
#23
Mount Rainier Ave
Farmingville, NY 11738
|
- sq. feet
|
- baths - beds |
show details | |

|
#24
Powell Ave
Farmingville, NY 11738
|
- sq. feet
|
- baths - beds |
show details | |

|
#25
Greentree Ave
Farmingville, NY 11738
|
- sq. feet
|
- baths - beds |
show details | |

|
#26
Berkshire Dr
Farmingville, NY 11738
|
- sq. feet
|
- baths - beds |
show details | |

|
#27
Abner Dr
Farmingville, NY 11738
|
- sq. feet
|
- baths - beds |
show details | |

|
#28
Ridgedale Ave
Farmingville, NY 11738
|
- sq. feet
|
- baths - beds |
show details | |

|
#29
Neil Ct
Farmingville, NY 11738
|
- sq. feet
|
- baths - beds |
show details | |

|
#30
Woodmont Pl
Farmingville, NY 11738
|
- sq. feet
|
- baths - beds |
show details |
| Photo | Address | Area | Beds / Baths | Price | Details |
|---|---|---|---|---|---|

|
#31
Hayfield Ct
Commack, NY 11725
|
- sq. feet
|
1 baths 3 beds |
$603,250
|
show details |

|
#32
Falcon Ave
Medford, NY 11763
|
- sq. feet
|
1 baths 3 beds |
$409,900
|
show details |

|
#33
Monet Ct
Middle Island, NY 11953
|
- sq. feet
|
1 baths 1 beds |
$189,900
|
show details |

|
#34
Rocky Point Yaphank Rd Apt 146
Rocky Point, NY 11778
|
- sq. feet
|
1 baths 1 beds |
$199,900
|
show details |

|
#35
Mill Dr
Mastic Beach, NY 11951
|
- sq. feet
|
1 baths 3 beds |
$244,900
|
show details |

|
#36
Leaf Ave
Central Islip, NY 11722
|
- sq. feet
|
3 baths 5 beds |
$420,000
|
show details |

|
#37
Meadowbrook Dr
Sound Beach, NY 11789
|
- sq. feet
|
1 baths 3 beds |
$249,900
|
show details |

|
#38
Kirby Ln
Central Islip, NY 11722
|
- sq. feet
|
1 baths 3 beds |
$395,200
|
show details |

|
#39
Lincoln Blvd
Bay Shore, NY 11706
|
- sq. feet
|
2 baths 3 beds |
$490,000
|
show details |

|
#40
Clark St
Patchogue, NY 11772
|
2,929 sq. feet
|
2 baths 5 beds |
show details |
| Photo | Address | Area | Beds / Baths | Price | Details |
|---|---|---|---|---|---|

|
#41
Claywood Dr
Brentwood, NY 11717
|
1,222 sq. feet
|
2 baths 3 beds |
show details | |

|
#42
Mastic Blvd W
Shirley, NY 11967
|
- sq. feet
|
1 baths 3 beds |
show details | |

|
#43
E Farmingdale St
Islip Terrace, NY 11752
|
2,092 sq. feet
|
2 baths 5 beds |
show details | |

|
#44
Whittier Dr
Mastic Beach, NY 11951
|
- sq. feet
|
1 baths 2 beds |
show details | |

|
#45
Jefferson Dr
Mastic Beach, NY 11951
|
1,557 sq. feet
|
2 baths 3 beds |
show details | |

|
#46
Nebraska Ave
Bay Shore, NY 11706
|
- sq. feet
|
1 baths 3 beds |
show details | |

|
#47
Nevada Ave
Medford, NY 11763
|
1,830 sq. feet
|
2 baths 3 beds |
show details | |

|
#48
Alcolade Dr E
Shirley, NY 11967
|
1,140 sq. feet
|
1 baths 3 beds |
show details | |

|
#49
Cranford Blvd
Mastic, NY 11950
|
1,952 sq. feet
|
2 baths 4 beds |
show details | |

|
Check over 1 million property listings on Foreclosure.com!
|
browse all offers | |||

Latest news about housing in Farmingville, NY collected exclusively by city-data.com from local newspapers, TV, and radio stations

 | Farmingville All Cash Home $110k (68 replies) |
| Migrants on Long Island (98 replies) |
| Buying a home 2021 (7 replies) |
| Renting a house in selden (12 replies) |
| Christmas Light Houses in North West Brookhaven? (0 replies) |
| real estate taxes (22 replies) |

Median year apartment built: 1976
Household type by relationship:
Households: 16,899- Male householders: 2,928 (360 living alone), Female householders: 1,963 (226 living alone)
3,027 spouses (3,022 opposite-sex spouses), 336 unmarried partners, (336 opposite-sex unmarried partners), 6,029 children (5,835 natural, 36 adopted, 158 stepchildren), 155 grandchildren, 178 brothers or sisters, 380 parents, 268 foster children, 939 other relatives, 490 non-relatives
- In group quarters: 202
Size of family households: 1,213 2-persons, 683 3-persons, 1,214 4-persons, 616 5-persons, 176 6-persons, 143 7-or-more-persons.
Size of nonfamily households: 590 1-person, 188 2-persons, 15 3-persons, 25 4-persons.
2,434 married couples with children.
575 single-parent households (292 men, 283 women).
73.6% of residents of Farmingville speak English at home.
11.9% of residents speak Spanish at home (49% speak English very well, 43% speak English well, 8% speak English not well).
10.6% of residents speak other Indo-European language at home (76% speak English very well, 16% speak English well, 6% speak English not well, 2% don't speak English at all).
3.1% of residents speak Asian or Pacific Island language at home (65% speak English very well, 16% speak English well, 17% speak English not well, 2% don't speak English at all).
0.3% of residents speak other language at home (100% speak English very well).
Foreign born population: 3,022 (17.9%)
(79.9% of them are naturalized citizens)
| Here: | 6.6 |
| State: | 6.3 |
| Here: | 5.5 |
| State: | 3.8 |
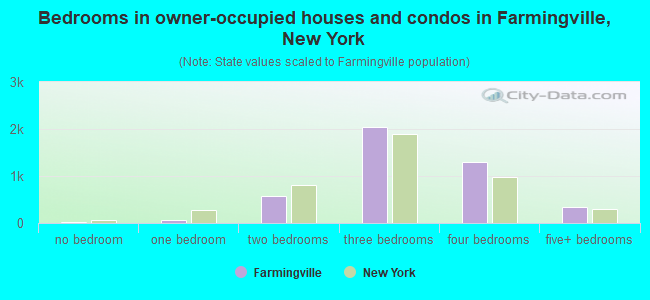
- Bedrooms in owner-occupied houses and condos in Farmingville, New York
- 20no bedroom
- 571 bedroom
- 5702 bedrooms
- 2,0373 bedrooms
- 1,3084 bedrooms
- 3315+ bedrooms
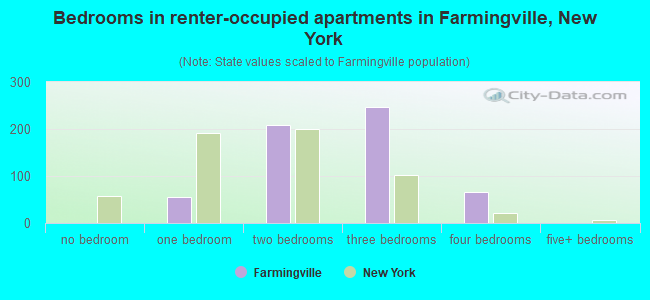
- Bedrooms in renter-occupied apartments in Farmingville, New York
- 0no bedroom
- 551 bedroom
- 2092 bedrooms
- 2473 bedrooms
- 674 bedrooms
- 05+ bedrooms
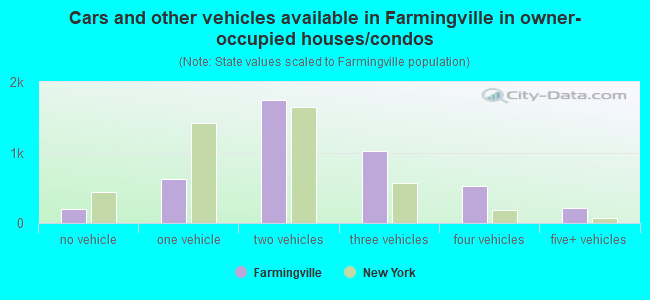
- Cars and other vehicles available in Farmingville in owner-occupied houses/condos
- 204no vehicle
- 6251 vehicle
- 1,7422 vehicles
- 1,0183 vehicles
- 5284 vehicles
- 2085+ vehicles
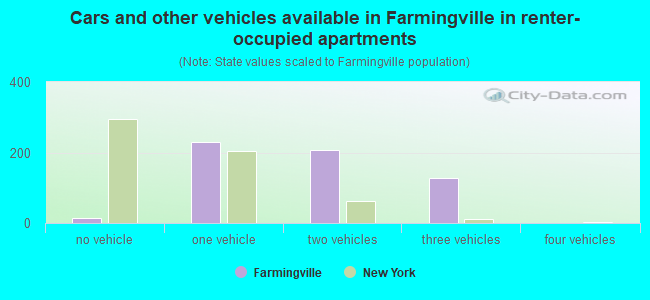
- Cars and other vehicles available in Farmingville in renter-occupied apartments
- 13no vehicle
- 2311 vehicle
- 2062 vehicles
- 1283 vehicles
- 04 vehicles
- 05+ vehicles
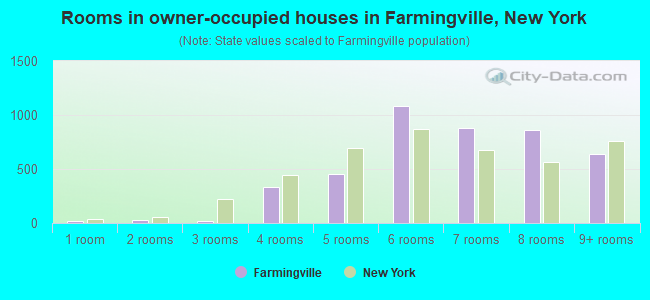
- Rooms in owner-occupied houses in Farmingville, New York
- 201 room
- 262 rooms
- 213 rooms
- 3364 rooms
- 4565 rooms
- 1,0846 rooms
- 8807 rooms
- 8648 rooms
- 6379+ rooms
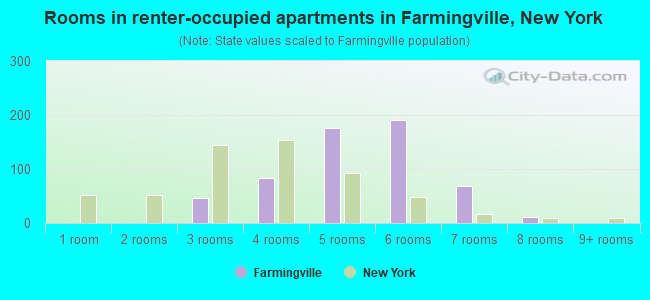
- Rooms in renter-occupied apartments in Farmingville, New York
- 01 room
- 02 rooms
- 463 rooms
- 834 rooms
- 1765 rooms
- 1916 rooms
- 687 rooms
- 128 rooms
- 09+ rooms
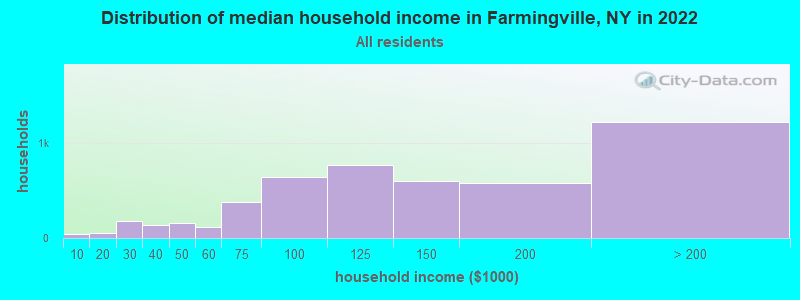
Farmingville, NY household income distribution

- 39Less than $10,000
- 48$10,000 to $19,999
- 175$20,000 to $29,999
- 135$30,000 to $39,999
- 163$40,000 to $49,999
- 120$50,000 to $59,999
- 377$60,000 to $74,999
- 646$75,000 to $99,999
- 766$100,000 to $124,999
- 600$125,000 to $149,999
- 583$150,000 to $199,999
- 1,224$200,000 or more
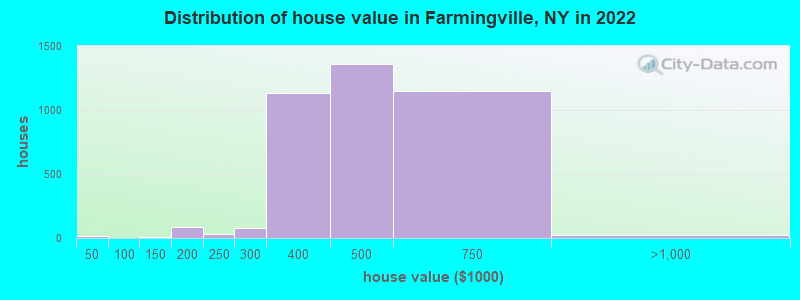
Home value of owner - occupied houses in 2022 in Farmingville, NY
-
- 6Less than $10,000
- 8$20,000 to $24,999
- 2$25,000 to $29,999
- 4$125,000 to $149,999
- 84$150,000 to $174,999
- 27$200,000 to $249,999
- 81$250,000 to $299,999
- 1,129$300,000 to $399,999
- 1,355$400,000 to $499,999
- 1,148$500,000 to $749,999
- 15$750,000 to $999,999
- 9$1,500,000 to $1,999,999
Rent paid by renters in 2022 in Farmingville, NY
-
- 114$1,000 to $1,249
- 16$1,250 to $1,499
- 50$1,500 to $1,999
- 123$2,000 to $2,499
- 243$2,500 to $2,999
- 32$3,000 to $3,499
- 55$3,500 or more
- 23No cash rent
Percentage of workers working in this county: 84.7%
Number of people working at home: 689 (7.3% of all workers)
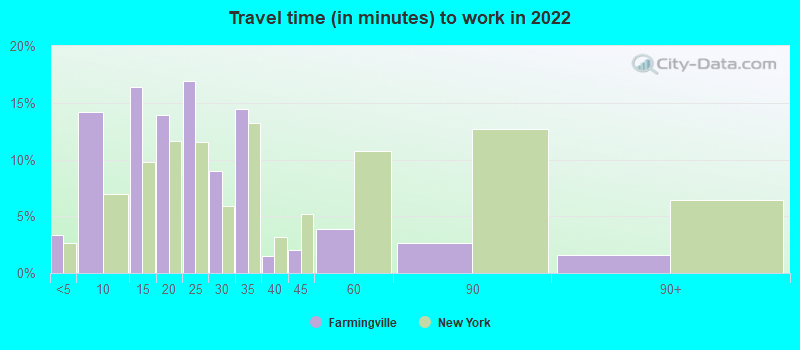
Travel time to work (commute)
- Less than 5 minutes: 60
- 5 to 9 minutes: 1,031
- 10 to 14 minutes: 804
- 15 to 19 minutes: 1,004
- 20 to 24 minutes: 1,168
- 25 to 29 minutes: 686
- 30 to 34 minutes: 1,558
- 35 to 39 minutes: 41
- 40 to 44 minutes: 489
- 45 to 59 minutes: 607
- 60 to 89 minutes: 465
- 90 or more minutes: 687

Means of transportation to work:
- Drove a car alone: 2,537 (68.1%)
- Carpooled: 365 (9.8%)
- Bus: 8 (0.2%)
- Long-distance train or commuter rail: 6 (0.2%)
- Taxi: 62 (1.7%)
- Walked: 116 (3.1%)
- Worked at home: 689 (18.5%)
- Unemployment by race in 2022
- Unemployment rate for White non-Hispanic residents
- 4.8%Males
- 1.8%Females
- Unemployment rate for Black residents
- 3.1%Males
- 17.1%Females
- Unemployment rate for other race residents
- 10.1%Females
- Unemployment rate for Hispanic or Latino residents
- 1.3%Males
- 4.4%Females
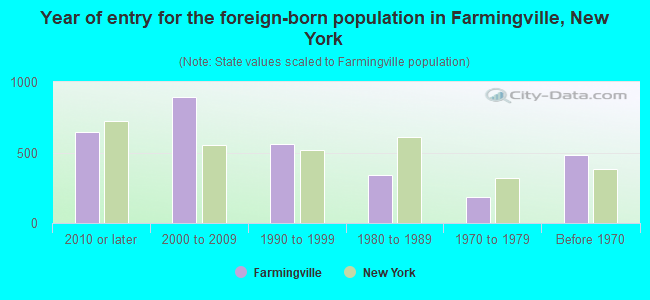
- Year of entry for the foreign-born population in Farmingville, New York
- 6452010 or later
- 8952000 to 2009
- 5571990 to 1999
- 3391980 to 1989
- 1861970 to 1979
- 482Before 1970
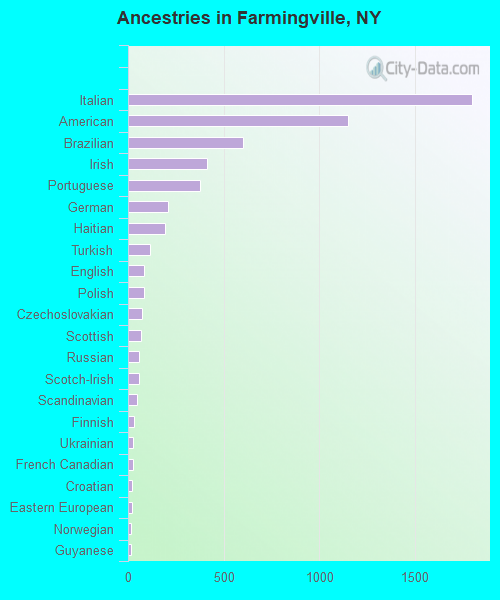
First ancestries reported:
- Italian: 1,798 (20.7%)
- American: 1,151 (13.2%)
- Brazilian: 600 (6.9%)
- Irish: 414 (4.8%)
- Portuguese: 374 (4.3%)
- German: 211 (2.4%)
- Haitian: 192 (2.2%)
- Turkish: 117 (1.3%)
- English: 82 (0.9%)
- Polish: 82 (0.9%)
- Czechoslovakian: 73 (0.8%)
- Scottish: 69 (0.8%)
- Russian: 56 (0.6%)
- Scotch-Irish: 56 (0.6%)
- Scandinavian: 48 (0.6%)
- Finnish: 31 (0.4%)
- Ukrainian: 27 (0.3%)
- French Canadian: 25 (0.3%)
- Croatian: 20 (0.2%)
- Eastern European: 20 (0.2%)
- Norwegian: 18 (0.2%)
- Guyanese: 17 (0.2%)
- Greek: 14 (0.2%)
- Slovak: 9 (0.1%)
- Swedish: 9 (0.1%)
Most common places of birth for foreign-born residents (%):
| Farmingville: | 12.9% (359) |
| New York: | 1.2% (54,759) |
| Farmingville: | 10.3% (286) |
| New York: | 2.4% (108,067) |
| Farmingville: | 9.6% (267) |
| New York: | 0.7% (30,658) |
| Farmingville: | 9.1% (254) |
| New York: | 11.1% (501,040) |
| Farmingville: | 8.7% (244) |
| New York: | 0.2% (10,519) |
| Farmingville: | 8.2% (228) |
| New York: | 1.4% (62,442) |
| Farmingville: | 4.9% (137) |
| New York: | 2.0% (91,070) |
| Farmingville: | 3.7% (103) |
| New York: | 0.3% (14,949) |
| Farmingville: | 3.5% (98) |
| New York: | 0.5% (21,009) |
| Farmingville: | 3.0% (85) |
| New York: | 4.8% (214,559) |
| Farmingville: | 2.5% (70) |
| New York: | 2.8% (126,936) |
| Farmingville: | 2.3% (64) |
| New York: | 2.6% (117,288) |
| Farmingville: | 2.1% (59) |
| New York: | 0.5% (23,058) |
| Farmingville: | 1.9% (53) |
| New York: | 0.3% (11,801) |
| Farmingville: | 1.8% (49) |
| New York: | 1.8% (82,786) |
| Farmingville: | 1.5% (42) |
| New York: | 1.8% (81,374) |
Place of birth for U.S.-born residents:
- This state: 12,992
- Other state: 770
- Northeast: 254
- Midwest: 68
- South: 354
- West: 57
95.1% of Farmingville residents lived in the same house 1 years ago.
Out of people who lived in different houses, 38.3% lived in this county.
Out of people who lived in different counties, 70.2% lived in New York.
| Farmingville: | 95.1% |
| State average: | 89.6% |
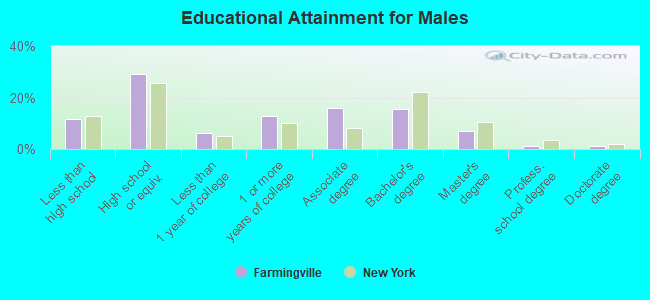
Education attainment for males 25 years and older:
- No schooling: 177
- Nursery to 4th grade: 73
- 5th and 6th grade: 0
- 7th and 8th grade: 98
- 9th grade: 43
- 10th grade: 33
- 11th grade: 20
- 12th grade, no diploma: 249
- High school graduate (or equivalency): 1,747
- Less than 1 year of college: 368
- Some college more than 1 year, no degree: 774
- Associate degree: 946
- Bachelor's degree: 923
- Master's degree: 430
- Professional school degree: 59
- Doctorate degree: 67
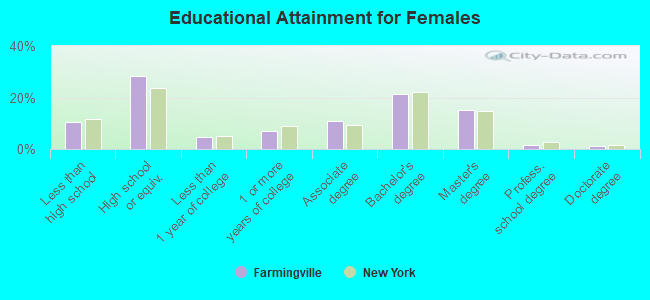
Education attainment for females 25 years and older:
- No schooling: 80
- Nursery to 4th grade: 91
- 5th and 6th grade: 32
- 7th and 8th grade: 73
- 9th grade: 32
- 10th grade: 50
- 11th grade: 153
- 12th grade, no diploma: 35
- High school graduate (or equivalency): 1,494
- Less than 1 year of college: 244
- Some college more than 1 year, no degree: 360
- Associate degree: 565
- Bachelor's degree: 1,121
- Master's degree: 795
- Professional school degree: 74
- Doctorate degree: 69


Housing units in structures:
- One, detached: 4,841
- One, attached: 30
- Two: 67
- 3 or 4: 49
- 5 to 9: 39
- 10 to 19: 39
- 20 to 49: 18
- 50 or more: 100
- Mobile homes: 13
Housing units lacking complete kitchen facilities in 2022: 1.6%
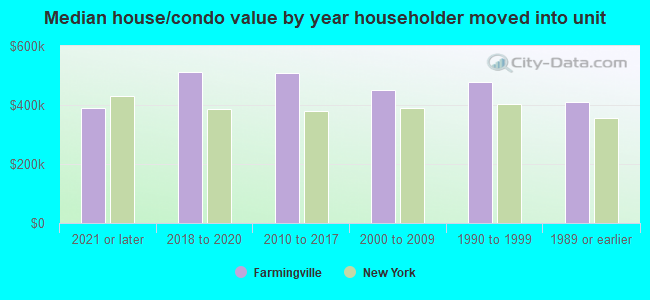
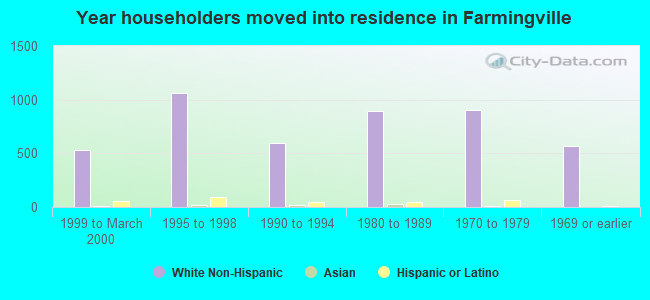
House/condo owner moved in on average 14 years ago
Renter moved in on average 7 years ago
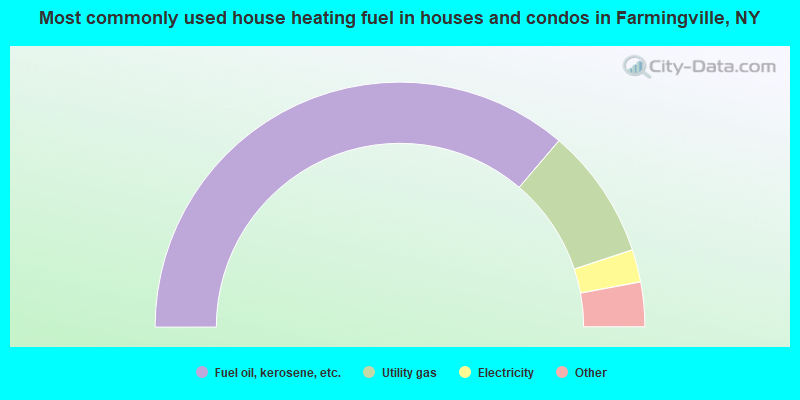
- 72.5%Fuel oil, kerosene, etc.
- 17.3%Utility gas
- 4.3%Electricity
- 3.5%Bottled, tank, or LP gas
- 1.2%Wood
- 0.7%Solar energy
- 0.2%Coal or coke
- 0.2%No fuel used
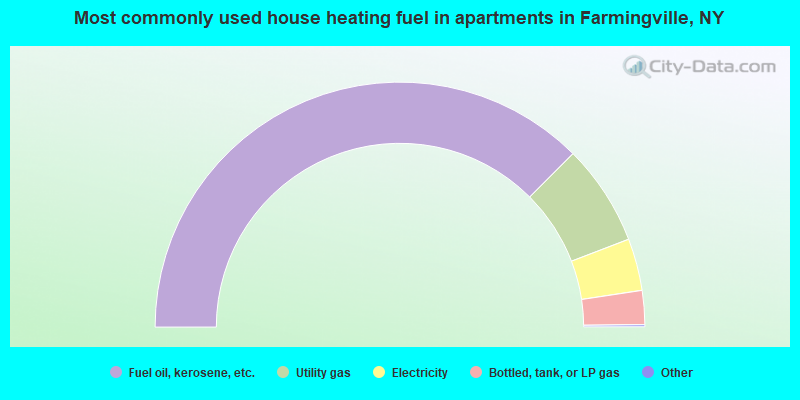
- 75.2%Fuel oil, kerosene, etc.
- 13.4%Utility gas
- 6.9%Electricity
- 4.5%Bottled, tank, or LP gas
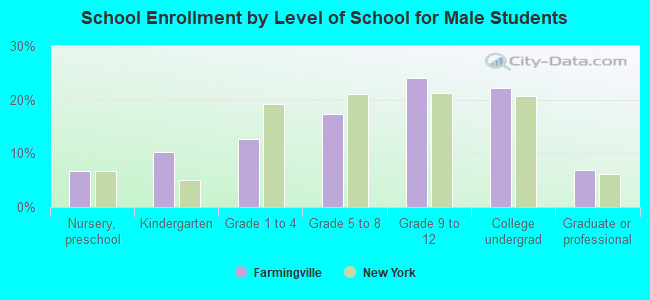
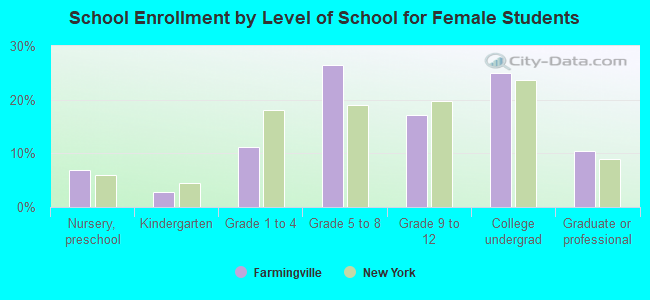
Private vs. public school enrollment:
| Here: | 0.6% |
| New York: | 15.6% |
| Here: | 4.3% |
| New York: | 15.0% |
| Here: | 10.2% |
| New York: | 39.2% |