Farmersville, CA (California) Houses and Residents
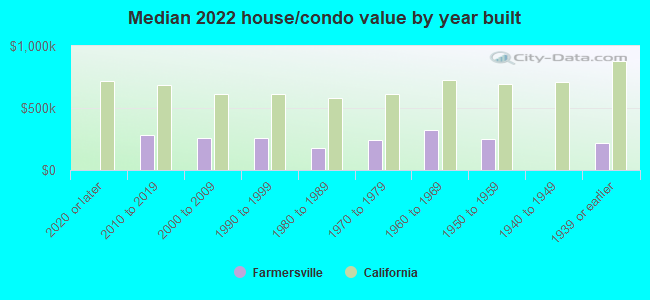
| Farmersville: | $258,431 |
| California: | $715,900 |
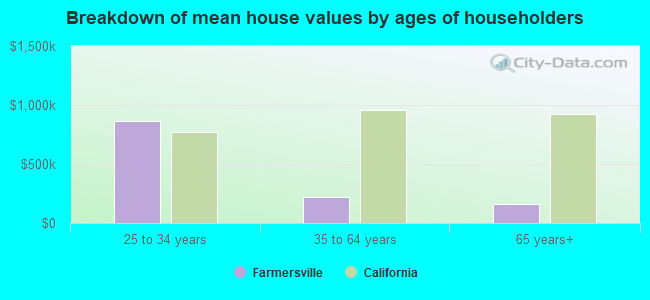
Mean price in 2022:
Detached houses: $276,150
Here: $276,150 State: $988,808 Townhouses or other attached units: $239,806
Here: $239,806 State: $838,546 Mobile homes: $47,364
Here: $47,364 State: $184,506
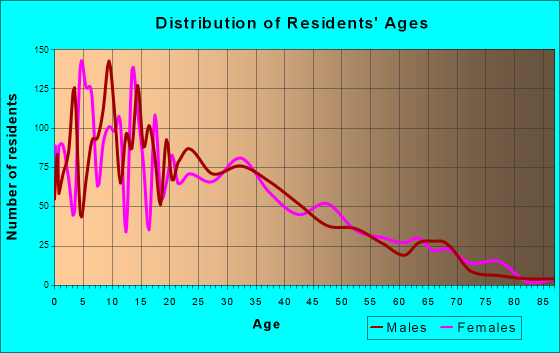
Total population: 10,786 (Urban population: 8,698, Rural population: 0)
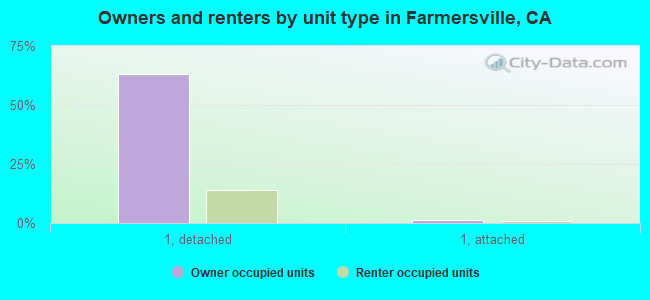
Houses: 2,897 (2,786 occupied: 1,891 owner occupied, 888 renter occupied)
| % of renters here: | 32% |
| State: | 44% |
Housing density: 1,544 houses/condos per square mile
Median price asked for vacant for-sale houses and condos in 2022 in this county: $413,164.
Median contract rent in 2022: $735 (lower quartile is $586, upper quartile is $897)
Median rent asked for vacant for-rent units in 2022: $712
Median gross rent in Farmersville, CA in 2022: $936
Housing units in Farmersville with a mortgage: 1,180 (16 second mortgage, 0 home equity loan, 17 both second mortgage and home equity loan)
Houses without a mortgage: 0
Median household income for houses/condos with a mortgage: $61,822
Median household income for apartments without a mortgage: $66,752
Median monthly housing costs: $961
Compare current foreclosures near Farmersville, CA:
| Photo | Address | Area | Beds / Baths | Price | Details |
|---|---|---|---|---|---|

|
#1
N Virginia Ave
Farmersville, CA 93223
|
1,070 sq. feet
|
2 baths 3 beds |
show details | |

|
#2
N Kemp Ave
Farmersville, CA 93223
|
1,257 sq. feet
|
2 baths 4 beds |
show details | |

|
#3
S Kern Ave
Farmersville, CA 93223
|
810 sq. feet
|
1 baths 2 beds |
show details | |

|
#4
Greg St
Farmersville, CA 93223
|
1,182 sq. feet
|
2 baths 3 beds |
show details | |

|
#5
E Costner St
Farmersville, CA 93223
|
1,370 sq. feet
|
2 baths 3 beds |
show details | |

|
#6
S Rose Ave
Farmersville, CA 93223
|
1,440 sq. feet
|
2 baths 3 beds |
show details | |

|
#7
N Linnell Ave
Farmersville, CA 93223
|
- sq. feet
|
- baths - beds |
show details | |

|
#8
N Matthew Ave
Farmersville, CA 93223
|
- sq. feet
|
- baths - beds |
show details | |

|
#9
N Matthew Ave
Farmersville, CA 93223
|
- sq. feet
|
- baths - beds |
show details | |

|
#10
N Conyer St
Visalia, CA 93291
|
1,219 sq. feet
|
2 baths 2 beds |
show details |
| Photo | Address | Area | Beds / Baths | Price | Details |
|---|---|---|---|---|---|

|
#11
N Pinkham St
Visalia, CA 93292
|
1,032 sq. feet
|
2 baths 2 beds |
show details | |

|
#12
Delaware Ct
Tulare, CA 93274
|
1,242 sq. feet
|
2 baths 3 beds |
show details | |

|
#13
Whittier Ct
Exeter, CA 93221
|
1,240 sq. feet
|
2 baths 3 beds |
show details | |

|
#14
S C St
Exeter, CA 93221
|
868 sq. feet
|
1 baths 2 beds |
show details | |

|
#15
Lenox Ave
Exeter, CA 93221
|
1,502 sq. feet
|
2 baths 3 beds |
show details | |

|
#16
Farr Road
Goshen, CA 93227
|
1,092 sq. feet
|
2 baths 3 beds |
show details | |

|
#17
Harvest Ave
Goshen, CA 93227
|
1,177 sq. feet
|
2 baths 3 beds |
show details | |

|
#18
Capistrano Ave
Tulare, CA 93274
|
1,825 sq. feet
|
2 baths 5 beds |
show details | |

|
#19
E Lindmore St
Lindsay, CA 93247
|
4,083 sq. feet
|
2 baths 3 beds |
show details | |

|
#20
N Palm St
Woodlake, CA 93286
|
1,423 sq. feet
|
2 baths 3 beds |
show details |
| Photo | Address | Area | Beds / Baths | Price | Details |
|---|---|---|---|---|---|

|
#21
W Oakland Ave
Tulare, CA 93274
|
1,066 sq. feet
|
1 baths 3 beds |
show details | |

|
#22
S Verde Vista St
Visalia, CA 93277
|
1,580 sq. feet
|
2 baths 3 beds |
show details | |

|
#23
Columbia Ave
Tulare, CA 93274
|
1,278 sq. feet
|
2 baths 3 beds |
show details | |

|
#24
W Whitendale Ave
Visalia, CA 93277
|
1,885 sq. feet
|
2 baths 3 beds |
show details | |

|
#25
E Monte Verde Ave
Visalia, CA 93292
|
1,815 sq. feet
|
2 baths 3 beds |
show details | |

|
#26
S Fontana St
Visalia, CA 93277
|
1,272 sq. feet
|
2 baths 3 beds |
show details | |

|
#27
N Oakwood Ct
Visalia, CA 93291
|
2,076 sq. feet
|
2 baths 4 beds |
show details | |

|
#28
Maple Valley Way
Lindsay, CA 93247
|
1,270 sq. feet
|
2 baths 3 beds |
show details | |

|
#29
Bell Port Ave
Tulare, CA 93274
|
2,148 sq. feet
|
2 baths 4 beds |
show details | |

|
#30
W Sunnyview Ave
Visalia, CA 93291
|
2,289 sq. feet
|
2 baths 4 beds |
show details |
| Photo | Address | Area | Beds / Baths | Price | Details |
|---|---|---|---|---|---|

|
#31
E Douglas Ave
Visalia, CA 93292
|
1,795 sq. feet
|
2 baths 3 beds |
show details | |

|
#32
N Jacob St
Visalia, CA 93291
|
1,211 sq. feet
|
2 baths 3 beds |
show details | |

|
#33
W Julieann Ave
Porterville, CA 93257
|
2,820 sq. feet
|
3 baths 4 beds |
show details | |

|
#34
Avenue 264
Visalia, CA 93292
|
2,277 sq. feet
|
3 baths 3 beds |
show details | |

|
#35
Santa Maria Ave
Porterville, CA 93257
|
1,932 sq. feet
|
2 baths 4 beds |
show details | |

|
#36
E Westcott Ave
Visalia, CA 93292
|
1,502 sq. feet
|
1 baths 3 beds |
show details | |

|
#37
Road 140 # 140
Tulare, CA 93274
|
2,098 sq. feet
|
2 baths 3 beds |
show details | |

|
#38
N G St
Tulare, CA 93274
|
840 sq. feet
|
1 baths - beds |
show details | |

|
#39
E Sue Ave
Visalia, CA 93292
|
1,529 sq. feet
|
2 baths 3 beds |
show details | |

|
#40
W La Vida Ave
Visalia, CA 93277
|
1,032 sq. feet
|
2 baths 3 beds |
show details |
| Photo | Address | Area | Beds / Baths | Price | Details |
|---|---|---|---|---|---|

|
#41
W Elowin Ave
Visalia, CA 93291
|
1,637 sq. feet
|
2 baths 3 beds |
show details | |

|
#42
E Laura Ave
Visalia, CA 93292
|
2,127 sq. feet
|
2 baths 3 beds |
show details | |

|
#43
W Delta Ave
Visalia, CA 93291
|
1,972 sq. feet
|
2 baths 4 beds |
show details | |

|
#44
W Royal Oaks Dr
Visalia, CA 93277
|
1,940 sq. feet
|
2 baths 3 beds |
show details | |

|
#45
N Mathew St
Porterville, CA 93257
|
1,606 sq. feet
|
2 baths 4 beds |
show details | |

|
#46
S Whitney Dr
Visalia, CA 93277
|
1,779 sq. feet
|
2 baths 3 beds |
show details | |

|
#47
W Delta Ave
Visalia, CA 93291
|
1,582 sq. feet
|
2 baths 3 beds |
show details | |

|
#48
W Tyler Ave
Visalia, CA 93291
|
3,505 sq. feet
|
2 baths 3 beds |
show details | |

|
#49
N Leslie Ct
Visalia, CA 93291
|
1,077 sq. feet
|
2 baths 3 beds |
show details | |

|
Check over 1 million property listings on Foreclosure.com!
|
browse all offers | |||

Latest news about housing in Farmersville, CA collected exclusively by city-data.com from local newspapers, TV, and radio stations

 | To Fresno/Visalia area from the Midwest (41 replies) |
| Area in between route 99 and I5 (17 replies) |
| More Profligate Water Waste-From A Farmer (31 replies) |
| Nonwhite youth population growing in California and nation, report finds (30 replies) |
| We're transferring to Tulare co.-cost of utilities? land taxes? (29 replies) |
| San Luis Obispo - suburban or urban? (75 replies) |
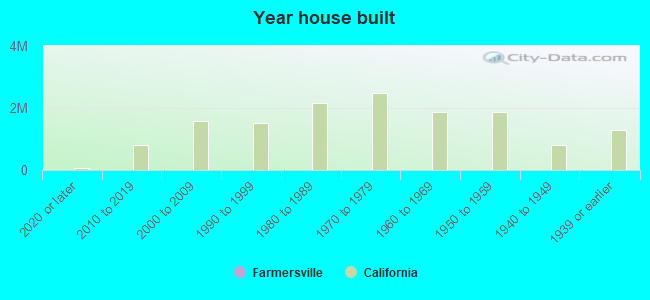
Median year apartment built: 1977
Household type by relationship:
Households: 10,482- Male householders: 1,229 (103 living alone), Female householders: 1,526 (258 living alone)
1,269 spouses (1,269 opposite-sex spouses), 182 unmarried partners, (174 opposite-sex unmarried partners), 4,645 children (4,564 natural, 0 adopted, 81 stepchildren), 645 grandchildren, 248 brothers or sisters, 325 parents, 0 foster children, 70 other relatives, 338 non-relatives
Size of family households: 409 2-persons, 367 3-persons, 678 4-persons, 541 5-persons, 162 6-persons, 93 7-or-more-persons.
Size of nonfamily households: 382 1-person, 107 2-persons, 43 3-persons, 16 6-persons.
1,322 married couples with children.
1,124 single-parent households (225 men, 899 women).
30.8% of residents of Farmersville speak English at home.
72.0% of residents speak Spanish at home (68% speak English very well, 8% speak English well, 11% speak English not well, 13% don't speak English at all).
0.1% of residents speak other Indo-European language at home (100% speak English very well).
0.2% of residents speak Asian or Pacific Island language at home (100% speak English very well).
Foreign born population: 2,901 (27.7%)
(36.9% of them are naturalized citizens)
| Here: | 5.7 |
| State: | 6.0 |
| Here: | 4.3 |
| State: | 3.9 |
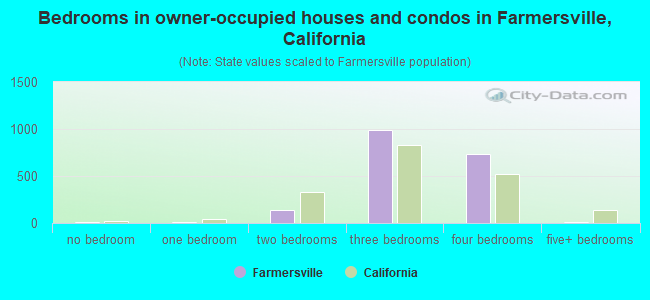
- Bedrooms in owner-occupied houses and condos in Farmersville, California
- 9no bedroom
- 101 bedroom
- 1382 bedrooms
- 9923 bedrooms
- 7324 bedrooms
- 105+ bedrooms
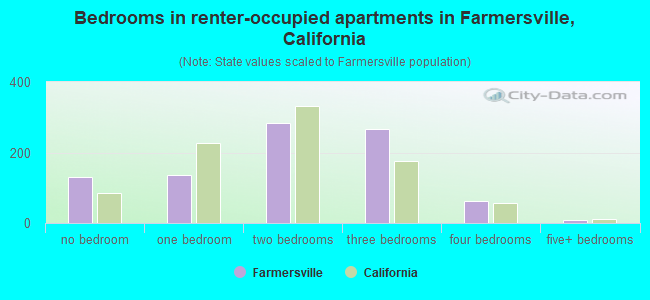
- Bedrooms in renter-occupied apartments in Farmersville, California
- 130no bedroom
- 1351 bedroom
- 2842 bedrooms
- 2683 bedrooms
- 634 bedrooms
- 85+ bedrooms
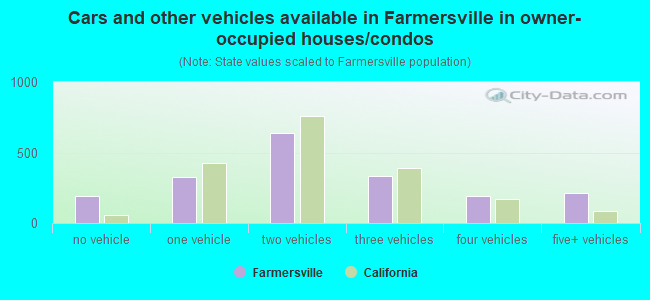
- Cars and other vehicles available in Farmersville in owner-occupied houses/condos
- 192no vehicle
- 3261 vehicle
- 6412 vehicles
- 3323 vehicles
- 1894 vehicles
- 2125+ vehicles
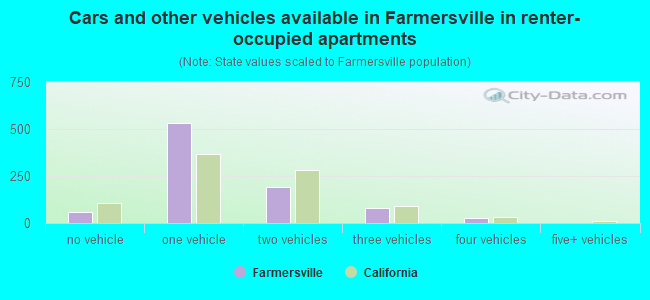
- Cars and other vehicles available in Farmersville in renter-occupied apartments
- 56no vehicle
- 5301 vehicle
- 1932 vehicles
- 823 vehicles
- 264 vehicles
- 05+ vehicles
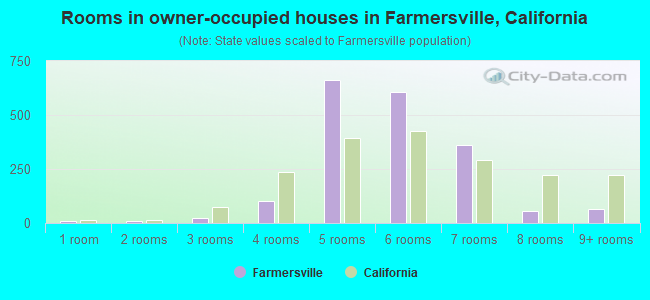
- Rooms in owner-occupied houses in Farmersville, California
- 91 room
- 102 rooms
- 243 rooms
- 1004 rooms
- 6605 rooms
- 6056 rooms
- 3637 rooms
- 548 rooms
- 659+ rooms
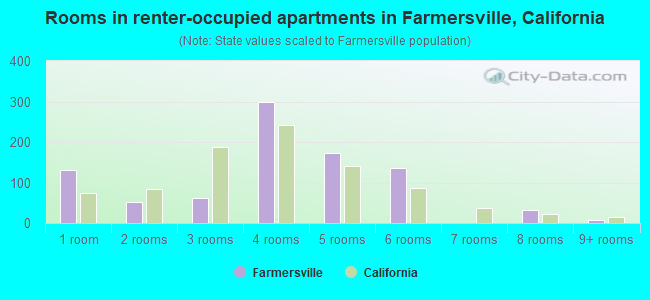
- Rooms in renter-occupied apartments in Farmersville, California
- 1301 room
- 512 rooms
- 613 rooms
- 2994 rooms
- 1735 rooms
- 1356 rooms
- 07 rooms
- 318 rooms
- 89+ rooms
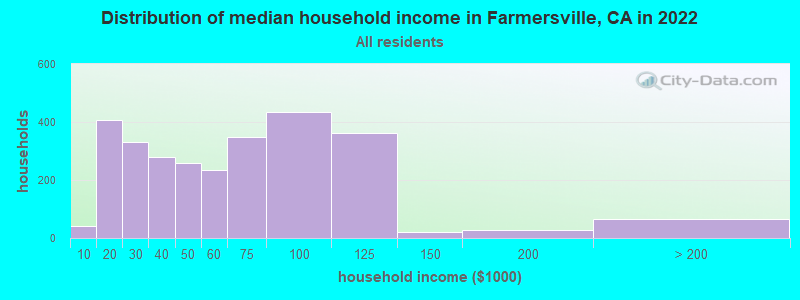
Farmersville, CA household income distribution

- 43Less than $10,000
- 408$10,000 to $19,999
- 330$20,000 to $29,999
- 280$30,000 to $39,999
- 259$40,000 to $49,999
- 233$50,000 to $59,999
- 347$60,000 to $74,999
- 433$75,000 to $99,999
- 361$100,000 to $124,999
- 22$125,000 to $149,999
- 29$150,000 to $199,999
- 66$200,000 or more
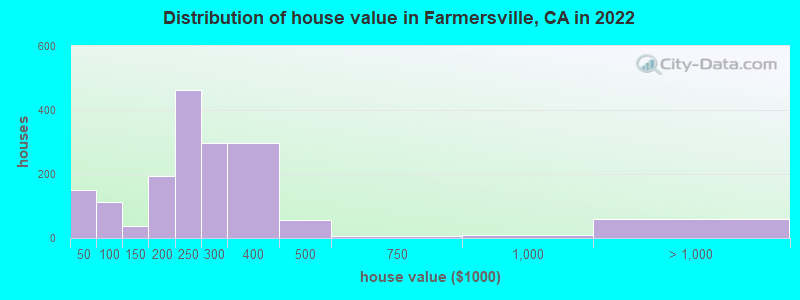
Home value of owner - occupied houses in 2022 in Farmersville, CA
-
- 44Less than $10,000
- 28$15,000 to $19,999
- 48$20,000 to $24,999
- 28$35,000 to $39,999
- 7$50,000 to $59,999
- 49$80,000 to $89,999
- 56$90,000 to $99,999
- 24$100,000 to $124,999
- 13$125,000 to $149,999
- 66$150,000 to $174,999
- 128$175,000 to $199,999
- 462$200,000 to $249,999
- 297$250,000 to $299,999
- 297$300,000 to $399,999
- 56$400,000 to $499,999
- 5$500,000 to $749,999
- 8$750,000 to $999,999
- 59$1,000,000 to $1,499,999
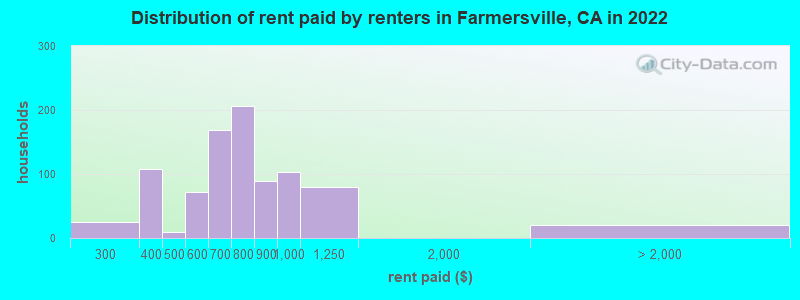
Rent paid by renters in 2022 in Farmersville, CA
-
- 11$200 to $249
- 14$250 to $299
- 27$300 to $349
- 81$350 to $399
- 10$400 to $449
- 31$500 to $549
- 40$550 to $599
- 159$600 to $649
- 9$650 to $699
- 156$700 to $749
- 50$750 to $799
- 89$800 to $899
- 103$900 to $999
- 79$1,000 to $1,249
- 10$2,000 to $2,499
- 9No cash rent
Percentage of workers working in this county: 93.4%
Number of people working at home: 105 (2.5% of all workers)
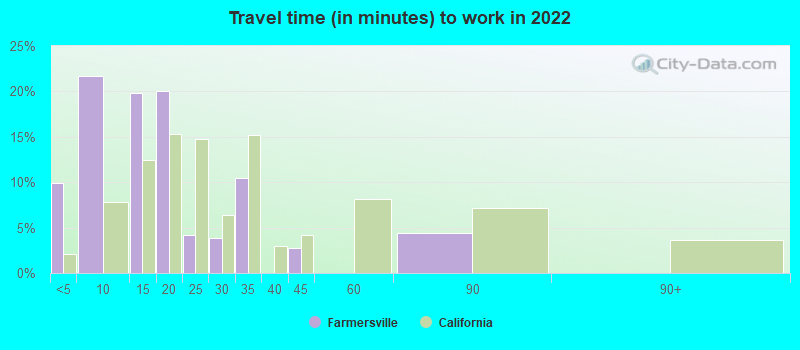
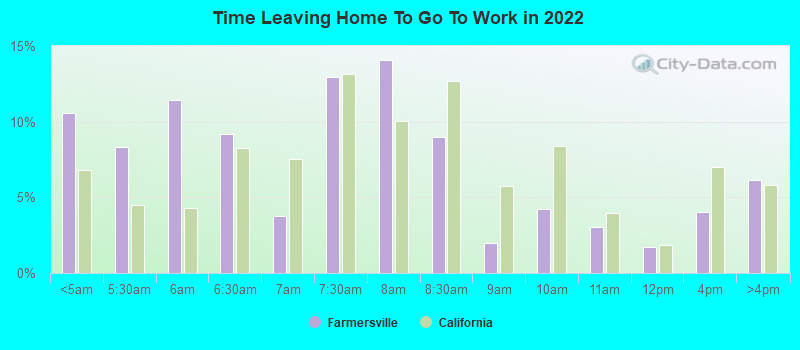
Travel time to work (commute)
- Less than 5 minutes: 240
- 5 to 9 minutes: 588
- 10 to 14 minutes: 480
- 15 to 19 minutes: 942
- 20 to 24 minutes: 959
- 25 to 29 minutes: 276
- 30 to 34 minutes: 372
- 35 to 39 minutes: 33
- 40 to 44 minutes: 153
- 45 to 59 minutes: 44
- 60 to 89 minutes: 25
- 90 or more minutes: 14
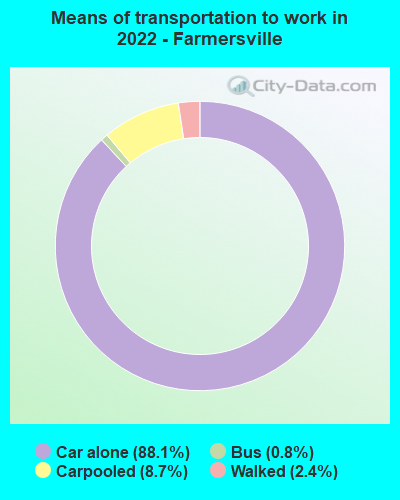
Means of transportation to work:
- Drove a car alone: 1,056 (78.9%)
- Carpooled: 129 (9.6%)
- Bus: 4 (0.3%)
- Walked: 26 (1.9%)
- Worked at home: 105 (7.8%)
- Unemployment by race in 2022
- Unemployment rate for White non-Hispanic residents
- 17.2%Males
- 3.9%Females
- Unemployment rate for Black residents
- 23.7%Females
- Unemployment rate for American Indian and Alaska Native residents
- 53.6%Males
- Unemployment rate for other race residents
- 11.0%Males
- 10.7%Females
- Unemployment rate for two or more race residents
- 5.7%Males
- 3.7%Females
- Unemployment rate for Hispanic or Latino residents
- 6.2%Males
- 7.0%Females
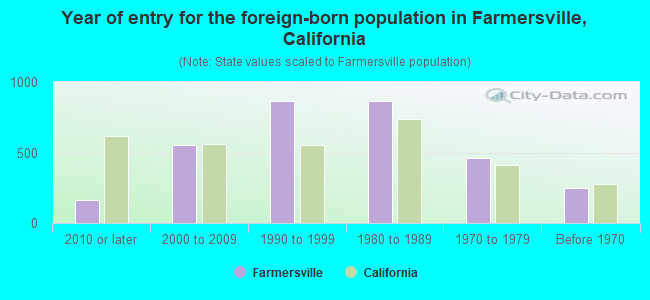
- Year of entry for the foreign-born population in Farmersville, California
- 1652010 or later
- 5562000 to 2009
- 8661990 to 1999
- 8631980 to 1989
- 4641970 to 1979
- 248Before 1970
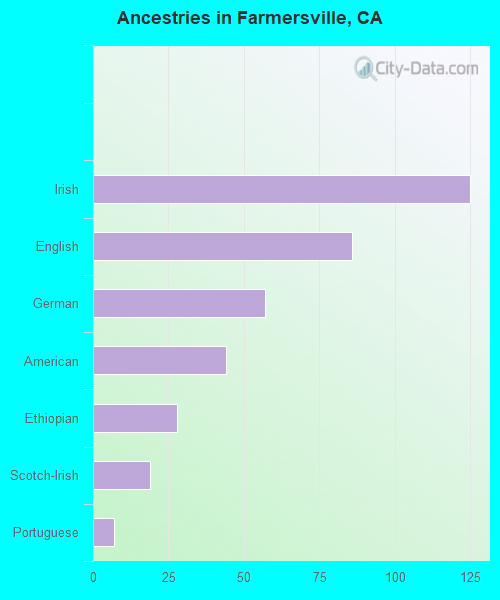
First ancestries reported:
- Irish: 125 (1.6%)
- English: 86 (1.1%)
- German: 57 (0.7%)
- American: 44 (0.5%)
- Ethiopian: 28 (0.3%)
- Scotch-Irish: 19 (0.2%)
- Portuguese: 7 (0.09%)
Most common places of birth for foreign-born residents (%):
| Farmersville: | 95.9% (2,640) |
| California: | 37.2% (3,881,193) |
Place of birth for U.S.-born residents:
- This state: 7,179
- Other state: 412
- Northeast: 6
- Midwest: 74
- South: 124
- West: 215
97.0% of Farmersville residents lived in the same house 1 years ago.
Out of people who lived in different houses, 51.3% lived in this county.
Out of people who lived in different counties, 100.0% lived in California.
| Farmersville: | 97.0% |
| State average: | 88.9% |
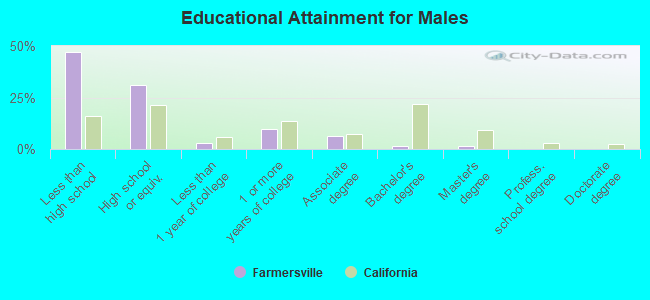
Education attainment for males 25 years and older:
- No schooling: 537
- Nursery to 4th grade: 250
- 5th and 6th grade: 184
- 7th and 8th grade: 85
- 9th grade: 38
- 10th grade: 78
- 11th grade: 48
- 12th grade, no diploma: 237
- High school graduate (or equivalency): 950
- Less than 1 year of college: 95
- Some college more than 1 year, no degree: 292
- Associate degree: 189
- Bachelor's degree: 50
- Master's degree: 47
- Professional school degree: 0
- Doctorate degree: 0
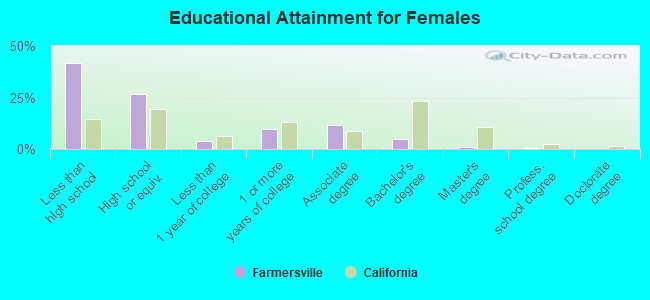
Education attainment for females 25 years and older:
- No schooling: 396
- Nursery to 4th grade: 186
- 5th and 6th grade: 282
- 7th and 8th grade: 124
- 9th grade: 19
- 10th grade: 12
- 11th grade: 156
- 12th grade, no diploma: 33
- High school graduate (or equivalency): 777
- Less than 1 year of college: 115
- Some college more than 1 year, no degree: 282
- Associate degree: 336
- Bachelor's degree: 135
- Master's degree: 31
- Professional school degree: 13
- Doctorate degree: 0
Housing units in structures:
- One, detached: 2,354
- One, attached: 25
- Two: 57
- 3 or 4: 108
- 5 to 9: 87
- 10 to 19: 107
- 20 to 49: 33
- 50 or more: 16
- Mobile homes: 107
Median worth of mobile homes: $36,797
Housing units lacking complete kitchen facilities in 2022: 2.9%
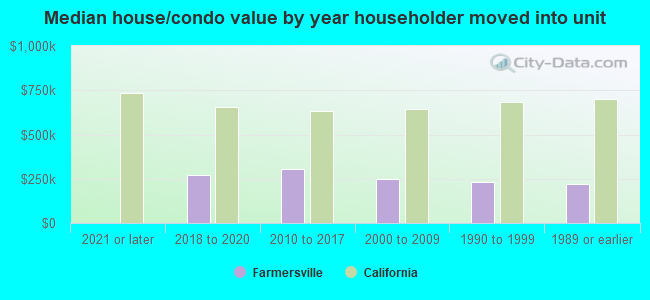
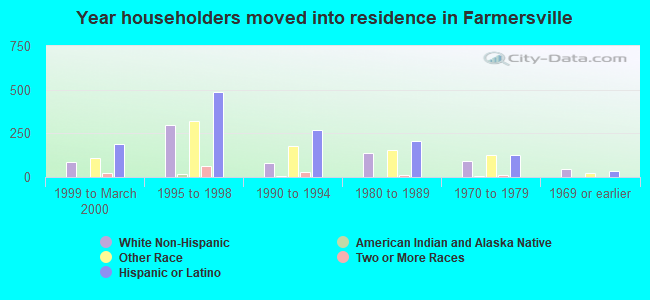
House/condo owner moved in on average 17 years ago
Renter moved in on average 7 years ago
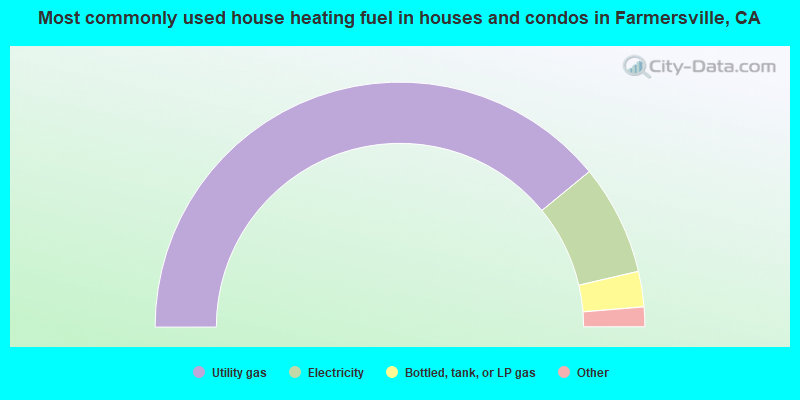
- 78.2%Utility gas
- 14.6%Electricity
- 4.7%Bottled, tank, or LP gas
- 1.6%Wood
- 1.0%Solar energy
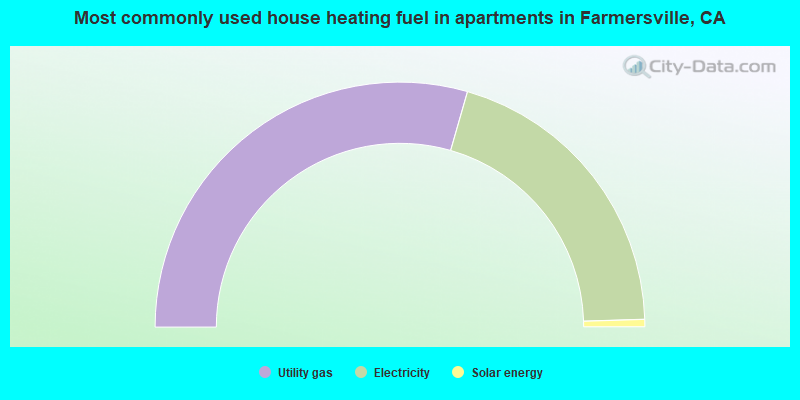
- 58.9%Utility gas
- 40.1%Electricity
- 1.0%Solar energy
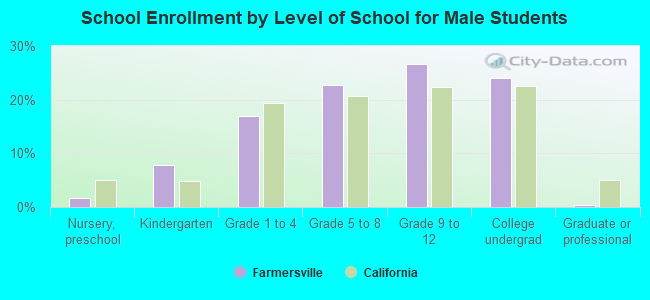
Private vs. public school enrollment:
| Here: | 0.8% |
| California: | 10.5% |
| Here: | 0.8% |
| California: | 8.5% |
| Here: | 25.7% |
| California: | 15.9% |