Fargo, ND (North Dakota) Houses and Residents
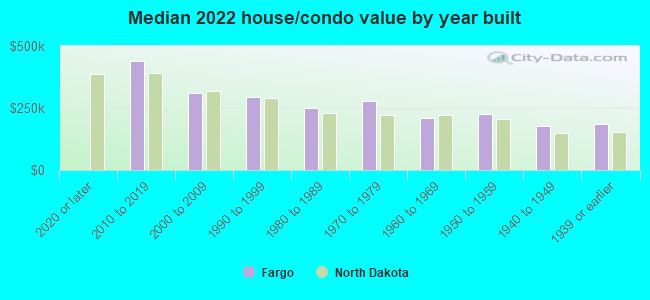
| Fargo: | $257,500 |
| North Dakota: | $243,100 |
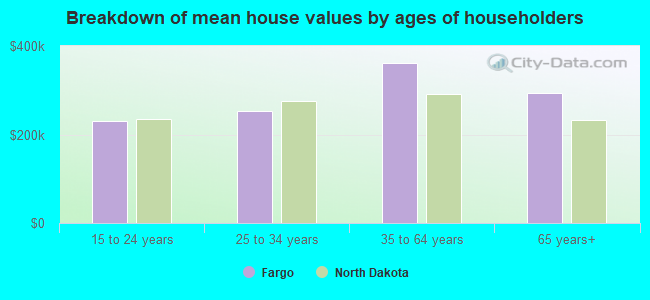
Mean price in 2022:
Detached houses: $348,622
Here: $348,622 State: $284,144 Townhouses or other attached units: $307,082
Here: $307,082 State: $250,572 In 2-unit structures: $483,470
Here: $483,470 State: $200,034 In 3-to-4-unit structures: $691,983
Here: $691,983 State: $229,360 In 5-or-more-unit structures: $127,547
Here: $127,547 State: $231,934 Mobile homes: $38,556
Here: $38,556 State: $85,388
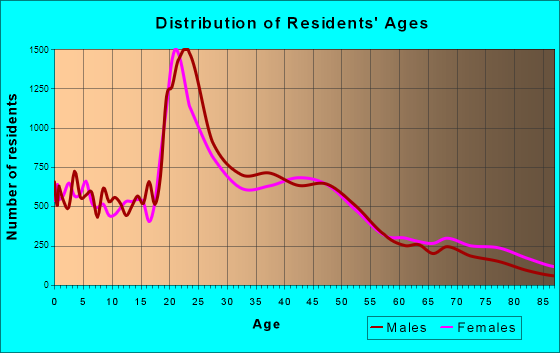
Total population: 115,863 (Urban population: 90,696, Rural population: 91 (all nonfarm))
Houses: 63,183 (59,028 occupied: 25,577 owner occupied, 33,451 renter occupied)
| % of renters here: | 57% |
| State: | 35% |
Housing density: 1,666 houses/condos per square mile
Median price asked for vacant for-sale houses and condos in 2022: $579,497.
Median contract rent in 2022: $815 (lower quartile is $642, upper quartile is $983)
Median rent asked for vacant for-rent units in 2022: $1,160
Median gross rent in Fargo, ND in 2022: $872
Housing units in Fargo with a mortgage: 15,759 (1,630 second mortgage, 0 home equity loan, 1,536 both second mortgage and home equity loan)
Houses without a mortgage: 601
Median household income for houses/condos with a mortgage: $102,008
Median household income for apartments without a mortgage: $78,991
Median monthly housing costs: $924
Compare current foreclosures in Fargo, ND:
| Photo | Address | Area | Beds / Baths | Price | Details |
|---|---|---|---|---|---|

|
#1
28th St N
Fargo, ND 58102
|
736 sq. feet
|
1 baths 2 beds |
show details | |

|
#2
15th St S
Fargo, ND 58103
|
1,469 sq. feet
|
- baths - beds |
show details | |

|
#3
56th Ave S
Fargo, ND 58104
|
- sq. feet
|
- baths - beds |
show details | |

|
#4
63rd Ave S
Fargo, ND 58104
|
- sq. feet
|
- baths - beds |
show details | |

|
#5
9th Avenue Cir S Apt 308
Fargo, ND 58103
|
- sq. feet
|
- baths - beds |
show details | |

|
#6
54th St S # 305
Fargo, ND 58104
|
- sq. feet
|
- baths - beds |
show details | |

|
#7
39th St S Apt 208
Fargo, ND 58103
|
- sq. feet
|
- baths - beds |
show details | |

|
#8
36th Ave S Apt 115
Fargo, ND 58104
|
- sq. feet
|
- baths - beds |
show details | |

|
#9
7th Ave S
Fargo, ND 58103
|
1,190 sq. feet
|
- baths - beds |
show details | |

|
#10
Countryside Trailer Ct S
Fargo, ND 58103
|
- sq. feet
|
- baths - beds |
show details |
| Photo | Address | Area | Beds / Baths | Price | Details |
|---|---|---|---|---|---|

|
#11
Domingo Rd S
Fargo, ND 58103
|
- sq. feet
|
- baths - beds |
show details | |

|
#12
36th Ave S Apt 108
Fargo, ND 58104
|
- sq. feet
|
- baths - beds |
show details | |

|
#13
11th St S Apt 208
Fargo, ND 58103
|
- sq. feet
|
- baths - beds |
show details | |

|
#14
27th St S
Fargo, ND 58104
|
- sq. feet
|
- baths - beds |
show details | |

|
#15
38th Ave S
Fargo, ND 58104
|
- sq. feet
|
- baths - beds |
show details | |

|
#16
Circle Dr N
Fargo, ND 58102
|
- sq. feet
|
- baths - beds |
show details | |

|
#17
Amber Valley Pkwy S Apt 23
Fargo, ND 58104
|
- sq. feet
|
- baths - beds |
show details | |

|
#18
Edgewood Dr N
Fargo, ND 58102
|
1,190 sq. feet
|
- baths - beds |
show details | |

|
#19
University Dr N # 104
Fargo, ND 58102
|
- sq. feet
|
- baths - beds |
show details | |

|
#20
8th St N # 1
Fargo, ND 58102
|
- sq. feet
|
- baths - beds |
show details |
| Photo | Address | Area | Beds / Baths | Price | Details |
|---|---|---|---|---|---|

|
#21
16th St S
Fargo, ND 58103
|
1,274 sq. feet
|
- baths - beds |
show details | |

|
#22
6th Ave S Apt 3
Fargo, ND 58103
|
- sq. feet
|
- baths - beds |
show details | |

|
#23
53rd St S Ste G
Fargo, ND 58104
|
- sq. feet
|
- baths - beds |
show details | |

|
#24
17th St S
Fargo, ND 58104
|
- sq. feet
|
- baths - beds |
show details | |

|
#25
Dakota Park Cir S
Fargo, ND 58104
|
1,152 sq. feet
|
- baths - beds |
show details | |

|
#26
54th St S # 306
Fargo, ND 58104
|
- sq. feet
|
- baths - beds |
show details | |

|
#27
Pacific Dr S Apt 305
Fargo, ND 58103
|
- sq. feet
|
- baths - beds |
show details | |

|
#28
9th Ave S Apt 304
Fargo, ND 58103
|
- sq. feet
|
- baths - beds |
show details | |

|
#29
Bishops Blvd S Unit A
Fargo, ND 58104
|
- sq. feet
|
- baths - beds |
show details | |

|
#30
48th Ave S
Fargo, ND 58104
|
- sq. feet
|
- baths - beds |
show details |
| Photo | Address | Area | Beds / Baths | Price | Details |
|---|---|---|---|---|---|

|
#31
15th Ave S
Fargo, ND 58103
|
1,244 sq. feet
|
- baths - beds |
show details | |

|
#32
58th Ct S
Fargo, ND 58104
|
- sq. feet
|
- baths - beds |
show details | |

|
#33
34th Ave S # 211
Fargo, ND 58104
|
- sq. feet
|
- baths - beds |
show details | |

|
#34
39th Ave S
Fargo, ND 58104
|
984 sq. feet
|
- baths - beds |
show details | |

|
#35
1st St N
Fargo, ND 58102
|
1,332 sq. feet
|
- baths - beds |
show details | |

|
#36
42nd St S Apt 302
Fargo, ND 58104
|
- sq. feet
|
- baths - beds |
show details | |

|
#37
15th Ave S Apt 3
Fargo, ND 58103
|
- sq. feet
|
- baths - beds |
show details | |

|
#38
51st St S
Fargo, ND 58103
|
- sq. feet
|
- baths - beds |
show details | |

|
#39
42nd St S Apt A
Fargo, ND 58104
|
- sq. feet
|
- baths - beds |
show details | |

|
#40
Timberline Dr S
Fargo, ND 58104
|
2,546 sq. feet
|
- baths - beds |
show details |
| Photo | Address | Area | Beds / Baths | Price | Details |
|---|---|---|---|---|---|

|
#41
47th St S Apt 110
Fargo, ND 58104
|
- sq. feet
|
- baths - beds |
show details | |

|
#42
7th St N Apt 4
Fargo, ND 58102
|
- sq. feet
|
- baths - beds |
show details | |

|
#43
20th Ave S Apt 405
Fargo, ND 58103
|
- sq. feet
|
- baths - beds |
show details | |

|
#44
12th St N
Fargo, ND 58102
|
1,136 sq. feet
|
- baths - beds |
show details | |

|
#45
13th Ave N Apt 104
Fargo, ND 58102
|
- sq. feet
|
- baths - beds |
show details | |

|
#46
Blue Stem Ct S Unit A
Fargo, ND 58104
|
- sq. feet
|
- baths - beds |
show details | |

|
#47
31st Ave S
Fargo, ND 58103
|
1,004 sq. feet
|
- baths - beds |
show details | |

|
#48
51st St S, Apt 226
Fargo, ND 58103
|
- sq. feet
|
- baths - beds |
show details | |

|
#49
Roberts St N Apt 407
Fargo, ND 58102
|
- sq. feet
|
- baths - beds |
show details | |

|
Check over 1 million property listings on Foreclosure.com!
|
browse all offers | |||

Latest news about housing in Fargo, ND collected exclusively by city-data.com from local newspapers, TV, and radio stations

 | Moving to Fargo Need Advice on Apartments / Transportaion (1 reply) |
| Looking to rent a townhome in Fargo, ND (2 replies) |
| Moving to Fargo. Best place to buy house? (7 replies) |
| Outsiders view of Fargo visit (18 replies) |
| Dog friendly apartments in Fargo (17 replies) |
| Coletrain Apartments vs Arbor Courts vs Latitude 46 Apartments. Any Suggestions? (0 replies) |
Median year apartment built: 2000
Household type by relationship:
Households: 133,879- Male householders: 30,357 (12,257 living alone), Female householders: 28,671 (11,309 living alone)
21,020 spouses (20,592 opposite-sex spouses), 5,920 unmarried partners, (5,775 opposite-sex unmarried partners), 33,137 children (31,975 natural, 322 adopted, 840 stepchildren), 525 grandchildren, 1,256 brothers or sisters, 679 parents, 0 foster children, 640 other relatives, 5,313 non-relatives
- In group quarters: 6,361
Size of family households: 13,207 2-persons, 6,426 3-persons, 5,154 4-persons, 2,132 5-persons, 646 6-persons, 678 7-or-more-persons.
Size of nonfamily households: 23,566 1-person, 6,323 2-persons, 803 3-persons, 93 4-persons.
17,258 married couples with children.
9,424 single-parent households (942 men, 8,482 women).
88.4% of residents of Fargo speak English at home.
1.6% of residents speak Spanish at home (80% speak English very well, 12% speak English well, 7% speak English not well).
3.8% of residents speak other Indo-European language at home (67% speak English very well, 17% speak English well, 14% speak English not well, 2% don't speak English at all).
1.7% of residents speak Asian or Pacific Island language at home (39% speak English very well, 43% speak English well, 18% speak English not well).
4.2% of residents speak other language at home (57% speak English very well, 36% speak English well, 7% speak English not well).
Foreign born population: 14,357 (10.7%)
(41.8% of them are naturalized citizens)
| Here: | 7.1 |
| State: | 7.0 |
| Here: | 3.8 |
| State: | 4.0 |
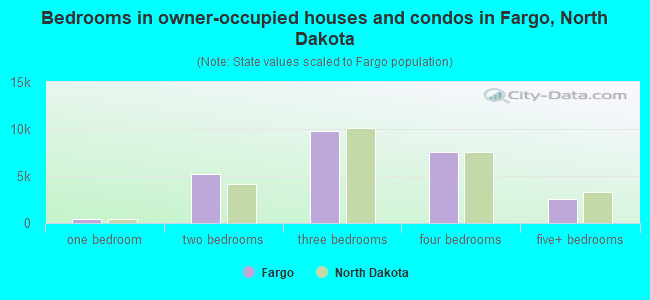
- Bedrooms in owner-occupied houses and condos in Fargo, North Dakota
- 65no bedroom
- 4061 bedroom
- 5,1962 bedrooms
- 9,7823 bedrooms
- 7,5914 bedrooms
- 2,5375+ bedrooms
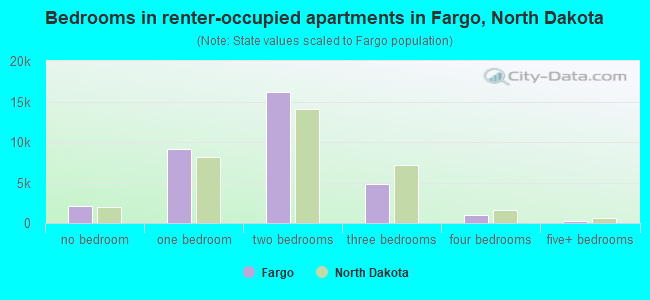
- Bedrooms in renter-occupied apartments in Fargo, North Dakota
- 2,069no bedroom
- 9,1951 bedroom
- 16,1302 bedrooms
- 4,8483 bedrooms
- 9804 bedrooms
- 2295+ bedrooms
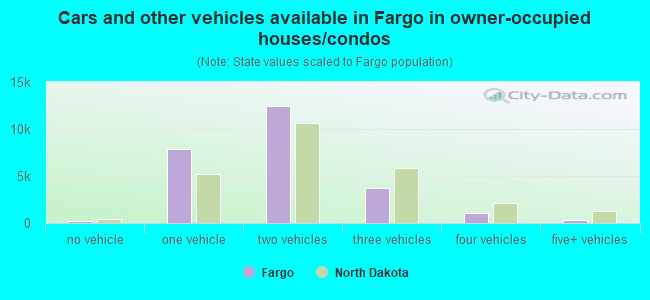
- Cars and other vehicles available in Fargo in owner-occupied houses/condos
- 182no vehicle
- 7,9091 vehicle
- 12,4332 vehicles
- 3,7013 vehicles
- 1,0344 vehicles
- 3185+ vehicles
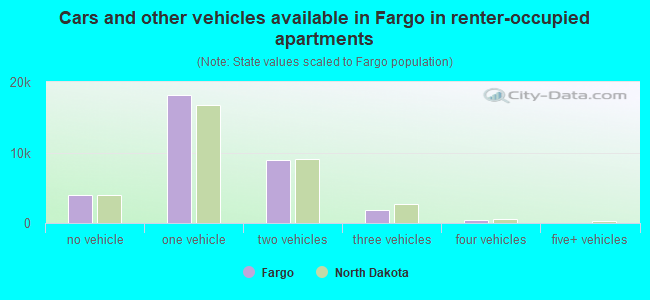
- Cars and other vehicles available in Fargo in renter-occupied apartments
- 3,929no vehicle
- 18,2121 vehicle
- 8,9132 vehicles
- 1,9073 vehicles
- 4904 vehicles
- 05+ vehicles
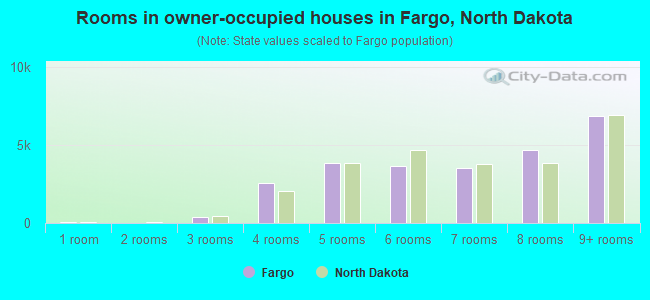
- Rooms in owner-occupied houses in Fargo, North Dakota
- 651 room
- 02 rooms
- 3633 rooms
- 2,5704 rooms
- 3,8365 rooms
- 3,6746 rooms
- 3,5417 rooms
- 4,6688 rooms
- 6,8609+ rooms
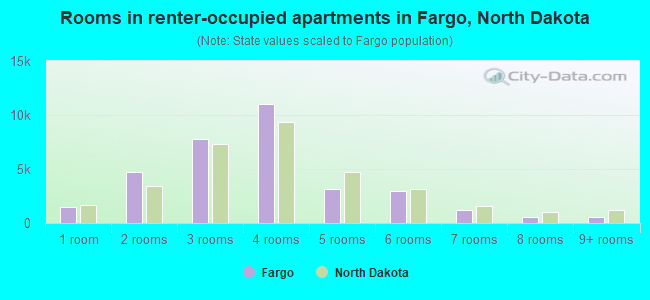
- Rooms in renter-occupied apartments in Fargo, North Dakota
- 1,4701 room
- 4,6792 rooms
- 7,8013 rooms
- 11,0354 rooms
- 3,1425 rooms
- 2,9936 rooms
- 1,2067 rooms
- 5388 rooms
- 5879+ rooms
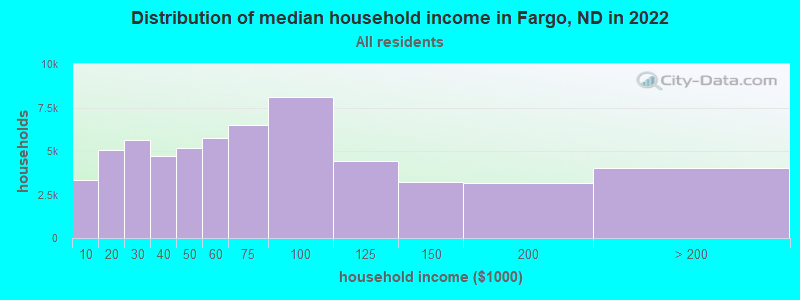
Fargo, ND household income distribution

- 3,318Less than $10,000
- 5,036$10,000 to $19,999
- 5,643$20,000 to $29,999
- 4,713$30,000 to $39,999
- 5,166$40,000 to $49,999
- 5,725$50,000 to $59,999
- 6,482$60,000 to $74,999
- 8,078$75,000 to $99,999
- 4,429$100,000 to $124,999
- 3,234$125,000 to $149,999
- 3,168$150,000 to $199,999
- 4,036$200,000 or more
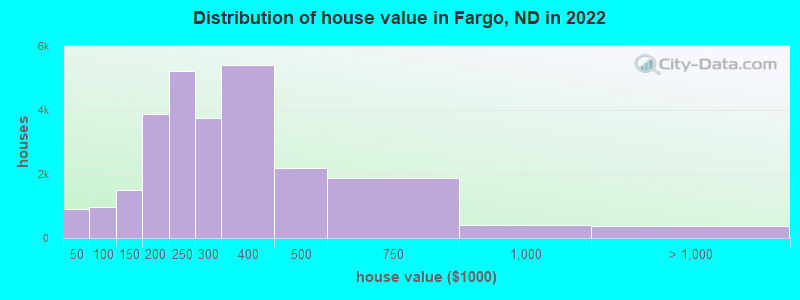
Home value of owner - occupied houses in 2022 in Fargo, ND
-
- 372Less than $10,000
- 114$10,000 to $14,999
- 120$15,000 to $19,999
- 160$20,000 to $24,999
- 76$25,000 to $29,999
- 15$30,000 to $34,999
- 61$40,000 to $49,999
- 267$50,000 to $59,999
- 15$60,000 to $69,999
- 175$70,000 to $79,999
- 202$80,000 to $89,999
- 239$90,000 to $99,999
- 759$100,000 to $124,999
- 751$125,000 to $149,999
- 1,730$150,000 to $174,999
- 2,132$175,000 to $199,999
- 5,229$200,000 to $249,999
- 3,735$250,000 to $299,999
- 5,410$300,000 to $399,999
- 2,186$400,000 to $499,999
- 1,883$500,000 to $749,999
- 411$750,000 to $999,999
- 193$1,000,000 to $1,499,999
- 11$1,500,000 to $1,999,999
- 162$2,000,000 or more
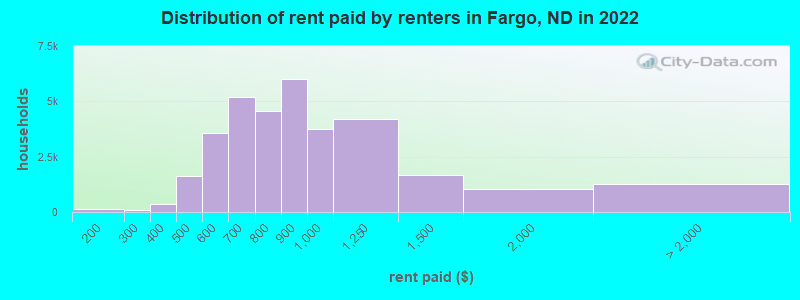
Rent paid by renters in 2022 in Fargo, ND
-
- 21Less than $100
- 117$100 to $149
- 53$200 to $249
- 57$250 to $299
- 108$300 to $349
- 260$350 to $399
- 572$400 to $449
- 1,036$450 to $499
- 1,399$500 to $549
- 2,169$550 to $599
- 2,863$600 to $649
- 2,345$650 to $699
- 3,494$700 to $749
- 1,047$750 to $799
- 5,991$800 to $899
- 3,736$900 to $999
- 4,193$1,000 to $1,249
- 1,679$1,250 to $1,499
- 1,044$1,500 to $1,999
- 145$2,000 to $2,499
- 167$2,500 to $2,999
- 56$3,000 to $3,499
- 308$3,500 or more
- 591No cash rent
Percentage of workers working in this county: 90.9%
Number of people working at home: 7,516 (9.8% of all workers)
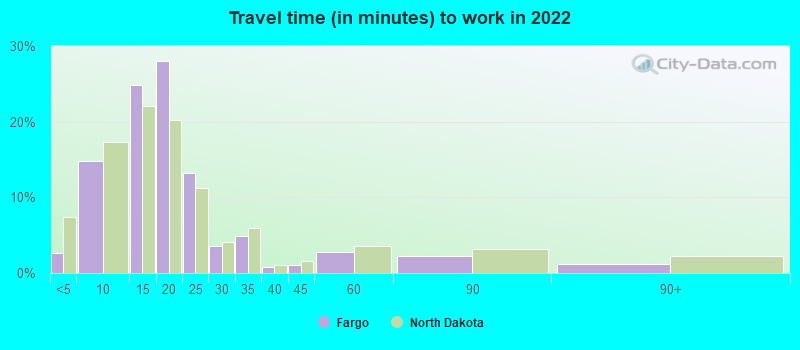
Travel time to work (commute)
- Less than 5 minutes: 2,913
- 5 to 9 minutes: 12,139
- 10 to 14 minutes: 21,271
- 15 to 19 minutes: 19,102
- 20 to 24 minutes: 7,940
- 25 to 29 minutes: 2,233
- 30 to 34 minutes: 2,289
- 35 to 39 minutes: 136
- 40 to 44 minutes: 357
- 45 to 59 minutes: 567
- 60 to 89 minutes: 1,939
- 90 or more minutes: 177
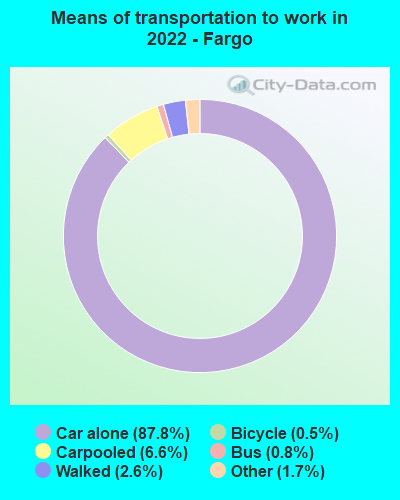
Means of transportation to work:
- Drove a car alone: 82,440 (81.7%)
- Carpooled: 6,153 (6.1%)
- Bus: 716 (0.7%)
- Ferryboat: 92 (0.1%)
- Taxi: 1,553 (1.5%)
- Bicycle: 487 (0.5%)
- Walked: 2,401 (2.4%)
- Worked at home: 7,119 (7.1%)
- Unemployment by race in 2022
- Unemployment rate for White non-Hispanic residents
- 3.1%Males
- 1.4%Females
- Unemployment rate for Black residents
- 7.6%Males
- 10.9%Females
- Unemployment rate for American Indian and Alaska Native residents
- 5.7%Females
- Unemployment rate for Asian residents
- 0.4%Males
- 2.6%Females
- Unemployment rate for other race residents
- 0.8%Males
- 4.3%Females
- Unemployment rate for two or more race residents
- 5.2%Males
- 2.6%Females
- Unemployment rate for Hispanic or Latino residents
- 3.1%Males
- 2.8%Females
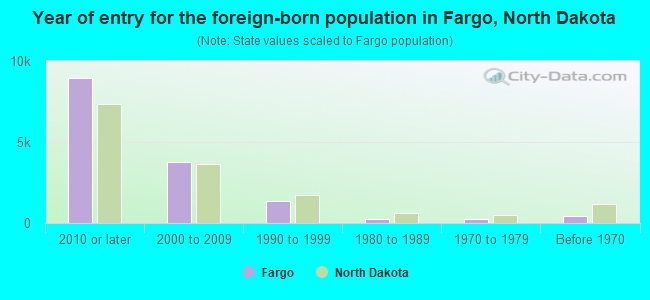
- Year of entry for the foreign-born population in Fargo, North Dakota
- 8,9772010 or later
- 3,7532000 to 2009
- 1,3841990 to 1999
- 2391980 to 1989
- 2251970 to 1979
- 447Before 1970
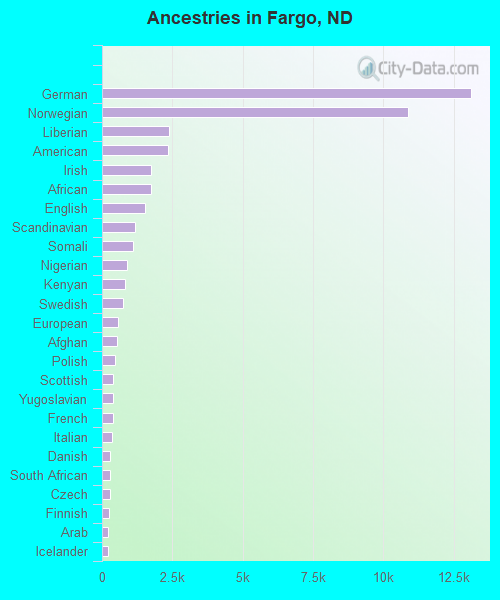
First ancestries reported:
- German: 13,099 (23.5%)
- Norwegian: 10,881 (19.5%)
- Liberian: 2,370 (4.2%)
- American: 2,349 (4.2%)
- Irish: 1,758 (3.2%)
- African: 1,756 (3.1%)
- English: 1,537 (2.8%)
- Scandinavian: 1,168 (2.1%)
- Somali: 1,099 (2.0%)
- Nigerian: 876 (1.6%)
- Kenyan: 832 (1.5%)
- Swedish: 763 (1.4%)
- European: 552 (1.0%)
- Afghan: 518 (0.9%)
- Polish: 456 (0.8%)
- Scottish: 382 (0.7%)
- Yugoslavian: 377 (0.7%)
- French: 375 (0.7%)
- Italian: 372 (0.7%)
- Danish: 295 (0.5%)
- South African: 290 (0.5%)
- Czech: 274 (0.5%)
- Finnish: 261 (0.5%)
- Arab: 222 (0.4%)
- Icelander: 209 (0.4%)
- Scotch-Irish: 201 (0.4%)
- Northern European: 182 (0.3%)
- French Canadian: 161 (0.3%)
- Ukrainian: 156 (0.3%)
- Egyptian: 151 (0.3%)
- German Russian: 150 (0.3%)
- Czechoslovakian: 121 (0.2%)
- British: 111 (0.2%)
- Austrian: 110 (0.2%)
- Jamaican: 110 (0.2%)
- Dutch: 108 (0.2%)
- Ghanaian: 108 (0.2%)
- Eastern European: 95 (0.2%)
- Slovak: 90 (0.2%)
- Swiss: 87 (0.2%)
- Romanian: 84 (0.2%)
- Haitian: 80 (0.1%)
- Albanian: 54 (0.10%)
- Bulgarian: 53 (0.10%)
- Canadian: 48 (0.09%)
- Iranian: 37 (0.07%)
- Welsh: 35 (0.06%)
- Brazilian: 34 (0.06%)
- Slovene: 20 (0.04%)
- Greek: 17 (0.03%)
- Sudanese: 17 (0.03%)
- Moroccan: 16 (0.03%)
- Australian: 15 (0.03%)
- Pennsylvania German: 14 (0.03%)
- Croatian: 13 (0.02%)
- Russian: 13 (0.02%)
- Estonian: 9 (0.02%)
- Hungarian: 6 (0.01%)
- Slavic: 3 (0.01%)
Most common places of birth for foreign-born residents (%):
| Fargo: | 15.5% (2,075) |
| North Dakota: | 8.6% (3,094) |
| Fargo: | 10.8% (1,452) |
| North Dakota: | 4.3% (1,546) |
| Fargo: | 7.4% (996) |
| North Dakota: | 3.8% (1,374) |
| Fargo: | 5.7% (765) |
| North Dakota: | 4.2% (1,514) |
| Fargo: | 5.6% (756) |
| North Dakota: | 3.0% (1,073) |
| Fargo: | 5.4% (717) |
| North Dakota: | 3.0% (1,068) |
| Fargo: | 4.4% (590) |
| North Dakota: | 8.7% (3,118) |
| Fargo: | 3.5% (462) |
| North Dakota: | 2.0% (735) |
| Fargo: | 3.2% (432) |
| North Dakota: | 0.9% (325) |
| Fargo: | 2.7% (363) |
| North Dakota: | 6.9% (2,472) |
| Fargo: | 2.6% (344) |
| North Dakota: | 1.0% (367) |
| Fargo: | 2.6% (342) |
| North Dakota: | 1.2% (444) |
| Fargo: | 2.6% (342) |
| North Dakota: | 1.1% (391) |
| Fargo: | 2.3% (302) |
| North Dakota: | 1.2% (445) |
| Fargo: | 1.7% (224) |
| North Dakota: | 2.0% (720) |
| Fargo: | 1.7% (223) |
| North Dakota: | 2.2% (778) |
| Fargo: | 1.7% (222) |
| North Dakota: | 1.2% (431) |
| Fargo: | 1.7% (221) |
| North Dakota: | 1.5% (542) |
Place of birth for U.S.-born residents:
- This state: 68,279
- Other state: 49,426
- Northeast: 1,608
- Midwest: 38,715
- South: 3,210
- West: 5,893
77.7% of Fargo residents lived in the same house 1 years ago.
Out of people who lived in different houses, 38.1% lived in this county.
Out of people who lived in different counties, 24.6% lived in North Dakota.
| Fargo: | 77.7% |
| State average: | 84.2% |
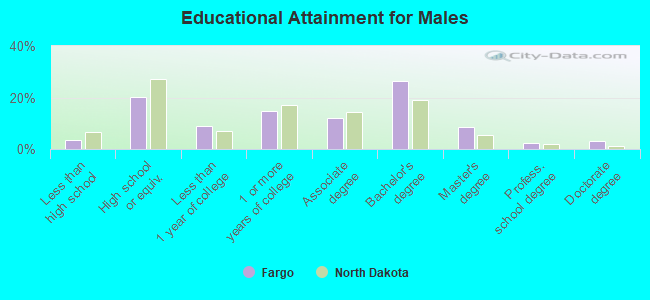
Education attainment for males 25 years and older:
- No schooling: 551
- Nursery to 4th grade: 0
- 5th and 6th grade: 0
- 7th and 8th grade: 168
- 9th grade: 0
- 10th grade: 424
- 11th grade: 87
- 12th grade, no diploma: 219
- High school graduate (or equivalency): 8,462
- Less than 1 year of college: 3,778
- Some college more than 1 year, no degree: 6,129
- Associate degree: 4,948
- Bachelor's degree: 10,902
- Master's degree: 3,560
- Professional school degree: 988
- Doctorate degree: 1,369
Education attainment for females 25 years and older:
- No schooling: 947
- Nursery to 4th grade: 0
- 5th and 6th grade: 8
- 7th and 8th grade: 270
- 9th grade: 0
- 10th grade: 324
- 11th grade: 151
- 12th grade, no diploma: 267
- High school graduate (or equivalency): 8,007
- Less than 1 year of college: 1,927
- Some college more than 1 year, no degree: 5,098
- Associate degree: 5,144
- Bachelor's degree: 13,480
- Master's degree: 3,027
- Professional school degree: 888
- Doctorate degree: 969

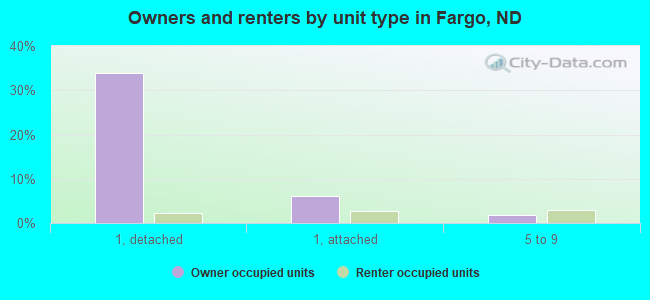
Housing units in structures:
- One, detached: 21,471
- One, attached: 4,485
- Two: 784
- 3 or 4: 1,856
- 5 to 9: 3,134
- 10 to 19: 5,783
- 20 to 49: 12,558
- 50 or more: 11,817
- Mobile homes: 1,295
Median worth of mobile homes: $34,261
Housing units lacking complete kitchen facilities in 2022: 1.5%
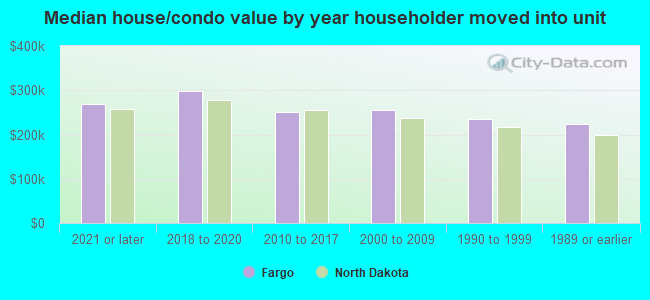
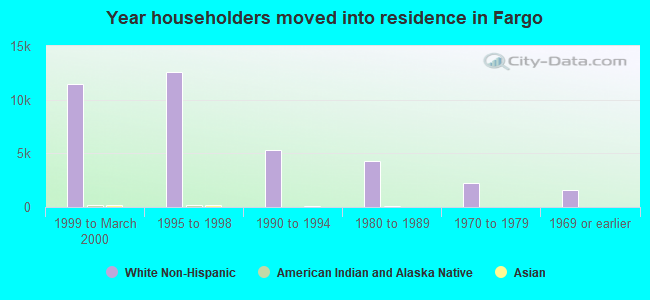
House/condo owner moved in on average 10 years ago
Renter moved in on average 1 years ago
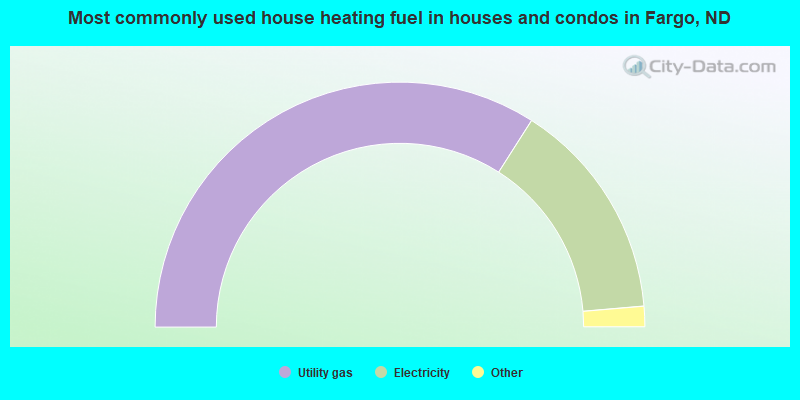
- 68.0%Utility gas
- 29.2%Electricity
- 1.6%Bottled, tank, or LP gas
- 0.8%Fuel oil, kerosene, etc.
- 0.2%No fuel used
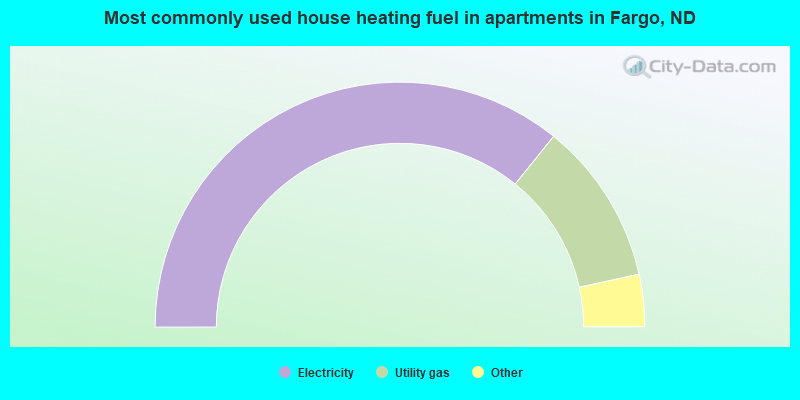
- 71.6%Electricity
- 21.5%Utility gas
- 2.3%No fuel used
- 2.2%Bottled, tank, or LP gas
- 2.1%Other fuel
- 0.2%Fuel oil, kerosene, etc.
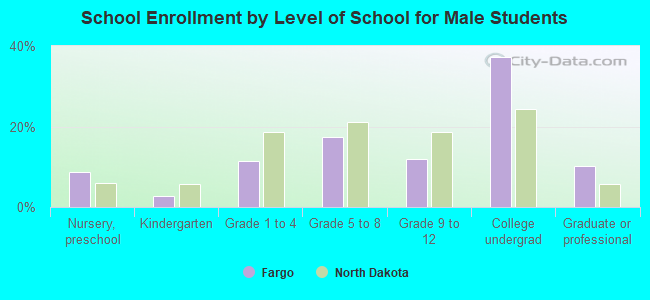
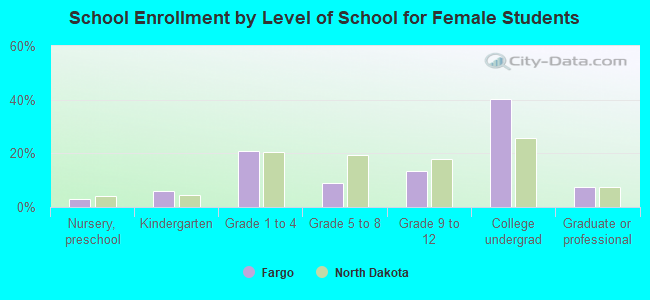
Private vs. public school enrollment:
| Here: | 4.6% |
| North Dakota: | 8.4% |
| Here: | 3.7% |
| North Dakota: | 8.2% |
| Here: | 14.2% |
| North Dakota: | 14.3% |