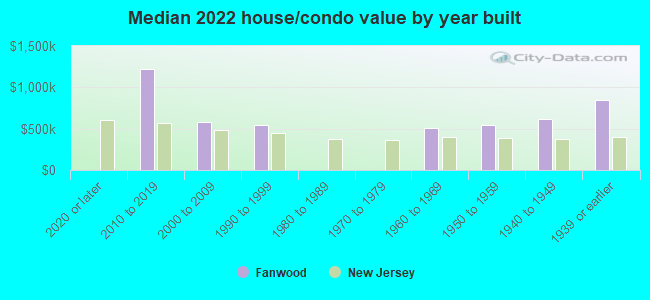
Fanwood, NJ (New Jersey) Houses and Residents
| Fanwood: | $641,645 |
| New Jersey: | $428,900 |
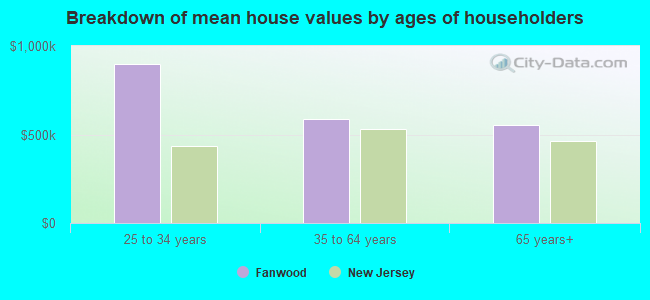
Mean price in 2022:
Detached houses: $600,858
Here: $600,858 State: $537,591 Townhouses or other attached units: $438,149
Here: $438,149 State: $381,113
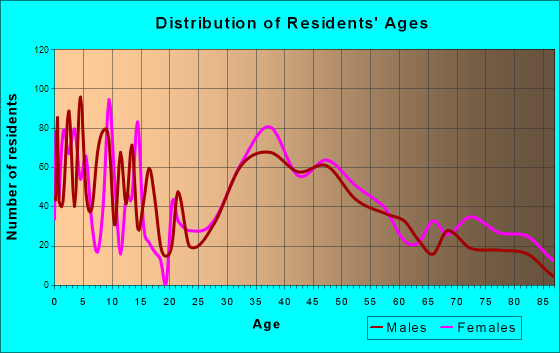
Total population: 7,657 (Urban population: 7,174, Rural population: 0)
Houses: 2,834 (2,834 occupied: 2,469 owner occupied, 374 renter occupied)
| % of renters here: | 13% |
| State: | 35% |
Housing density: 2,119 houses/condos per square mile
Median price asked for vacant for-sale houses and condos in 2022 in this county: $468,662.
Median contract rent in 2022: $1,999 (lower quartile is $1,697, upper quartile is over $2,000)
Median rent asked for vacant for-rent units in 2022: $3,017
Median gross rent in Fanwood, NJ in 2022: over $2,000
Housing units in Fanwood with a mortgage: 1,771 (252 second mortgage, 0 home equity loan, 252 both second mortgage and home equity loan)
Houses without a mortgage: 0
Median household income for houses/condos with a mortgage: $232,553
Median household income for apartments without a mortgage: $117,812
Median monthly housing costs: $3,078
Compare current foreclosures near Fanwood, NJ:
| Photo | Address | Area | Beds / Baths | Price | Details |
|---|---|---|---|---|---|

|
#1
S Martine Ave
Fanwood, NJ 07023
|
- sq. feet
|
- baths - beds |
show details | |

|
#2
Bloomfield Ave
Caldwell, NJ 07006
|
1,216 sq. feet
|
2 baths 2 beds |
$400,000
|
show details |

|
#3
Hazelhurst St
New Brunswick, NJ 08901
|
465 sq. feet
|
1 baths 1 beds |
$325,000
|
show details |

|
#4
Sharon Garden Ct
Woodbridge, NJ 07095
|
1,000 sq. feet
|
2 baths 2 beds |
$455,000
|
show details |

|
#5
Huntington Rd
Union, NJ 07083
|
1,532 sq. feet
|
2 baths 3 beds |
$539,900
|
show details |

|
#6
Willow St
Bloomfield, NJ 07003
|
1,092 sq. feet
|
1 baths 3 beds |
$499,900
|
show details |

|
#7
Catherine St
South Amboy, NJ 08879
|
2,266 sq. feet
|
3 baths 4 beds |
$351,900
|
show details |

|
#8
S Orange Ave
Newark, NJ 07103
|
989 sq. feet
|
1 baths 2 beds |
$289,900
|
show details |

|
#9
Ashland Ave
East Orange, NJ 07017
|
2,254 sq. feet
|
1 baths 5 beds |
$272,000
|
show details |

|
#10
Jersey Ave
Morristown, NJ 07960
|
2,406 sq. feet
|
2 baths 4 beds |
$665,000
|
show details |
| Photo | Address | Area | Beds / Baths | Price | Details |
|---|---|---|---|---|---|

|
#11
Russell St # G
Staten Island, NY 10308
|
642 sq. feet
|
1 baths 1 beds |
$185,000
|
show details |

|
#12
Florence Ave
Colonia, NJ 07067
|
1,930 sq. feet
|
2 baths 3 beds |
$599,900
|
show details |

|
#13
1st Ave
North Brunswick, NJ 08902
|
1,296 sq. feet
|
2 baths 3 beds |
$349,900
|
show details |

|
#14
King St
Fanwood, NJ 07023
|
- sq. feet
|
- baths - beds |
show details | |

|
#15
King St
Fanwood, NJ 07023
|
- sq. feet
|
- baths - beds |
show details | |

|
#16
Glenwood Rd
Fanwood, NJ 07023
|
- sq. feet
|
- baths - beds |
show details | |

|
#17
Willoughby Rd
Fanwood, NJ 07023
|
- sq. feet
|
- baths - beds |
show details | |

|
#18
Glenwood Rd
Fanwood, NJ 07023
|
- sq. feet
|
- baths - beds |
show details | |

|
#19
La Grande Ave
Fanwood, NJ 07023
|
- sq. feet
|
- baths - beds |
show details | |

|
#20
Russell Rd
Fanwood, NJ 07023
|
- sq. feet
|
- baths - beds |
show details |
| Photo | Address | Area | Beds / Baths | Price | Details |
|---|---|---|---|---|---|

|
#21
South Ave
Fanwood, NJ 07023
|
- sq. feet
|
- baths - beds |
show details | |

|
#22
La Grande Ave
Fanwood, NJ 07023
|
- sq. feet
|
- baths - beds |
show details | |

|
#23
King St
Fanwood, NJ 07023
|
- sq. feet
|
- baths - beds |
show details | |

|
#24
Station Ave
Staten Island, NY 10309
|
- sq. feet
|
1 baths 3 beds |
$649,900
|
show details |

|
#25
Cook Ave
Middlesex, NJ 08846
|
- sq. feet
|
1 baths 3 beds |
$244,900
|
show details |

|
#26
Willow Rd W
Staten Island, NY 10314
|
- sq. feet
|
1 baths 3 beds |
$491,400
|
show details |

|
#27
New Ln Apt 6l
Staten Island, NY 10305
|
- sq. feet
|
1 baths 1 beds |
$284,900
|
show details |

|
#28
Richmond Rd
Staten Island, NY 10304
|
- sq. feet
|
1 baths 3 beds |
$634,400
|
show details |

|
#29
Glannon Rd
Livingston, NJ 07039
|
- sq. feet
|
1 baths 3 beds |
$535,600
|
show details |

|
#30
Bromley Pl
East Brunswick, NJ 08816
|
1,200 sq. feet
|
2 baths 2 beds |
show details |
| Photo | Address | Area | Beds / Baths | Price | Details |
|---|---|---|---|---|---|

|
#31
19th Ave
Irvington, NJ 07111
|
2,412 sq. feet
|
2 baths 6 beds |
show details | |

|
#32
Coursen Pl
Staten Island, NY 10304
|
1,402 sq. feet
|
1 baths 3 beds |
show details | |

|
#33
Hagaman St
Port Reading, NJ 07064
|
1,376 sq. feet
|
2 baths 3 beds |
show details | |

|
#34
South St
Old Bridge, NJ 08857
|
2,198 sq. feet
|
2 baths 4 beds |
show details | |

|
#35
Kerrigan Blvd
Newark, NJ 07106
|
1,322 sq. feet
|
1 baths 3 beds |
show details | |

|
#36
Van Buren Ave
Linden, NJ 07036
|
1,820 sq. feet
|
3 baths 3 beds |
show details | |

|
#37
Donaldson Pl
Linden, NJ 07036
|
768 sq. feet
|
3 baths 3 beds |
show details | |

|
#38
Grand Pl
Kearny, NJ 07032
|
2,442 sq. feet
|
1 baths 3 beds |
show details | |

|
#39
Prince St
Staten Island, NY 10304
|
1,176 sq. feet
|
1 baths 3 beds |
show details | |

|
#40
New St
East Orange, NJ 07017
|
2,212 sq. feet
|
2 baths 5 beds |
show details |
| Photo | Address | Area | Beds / Baths | Price | Details |
|---|---|---|---|---|---|

|
#41
Desota Ave
Woodbridge, NJ 07095
|
1,150 sq. feet
|
1 baths 3 beds |
show details | |

|
#42
Barker St
Staten Island, NY 10310
|
1,364 sq. feet
|
1 baths 3 beds |
show details | |

|
#43
Prospect Ave
North Arlington, NJ 07031
|
1,480 sq. feet
|
2 baths 3 beds |
show details | |

|
#44
Saint Pauls Ave
Staten Island, NY 10301
|
2,350 sq. feet
|
2 baths 6 beds |
show details | |

|
#45
E 4th St
Bayonne, NJ 07002
|
2,168 sq. feet
|
3 baths 5 beds |
show details | |

|
#46
Starkin Rd
Edison, NJ 08837
|
832 sq. feet
|
1 baths 2 beds |
show details | |

|
#47
Mildred Ave
Linden, NJ 07036
|
783 sq. feet
|
2 baths 4 beds |
show details | |

|
#48
Netherwood Dr
Keyport, NJ 07735
|
876 sq. feet
|
1 baths 3 beds |
show details | |

|
#49
Irving St
Carteret, NJ 07008
|
1,110 sq. feet
|
1 baths 3 beds |
show details | |

|
Check over 1 million property listings on Foreclosure.com!
|
browse all offers | |||

Latest news about housing in Fanwood, NJ collected exclusively by city-data.com from local newspapers, TV, and radio stations

 | Housing Market (Westfield, Scotch Plains, Fanwood) (9 replies) |
| (1st House) Condo/Townhouse for Rockefeller NYC Commuter Family? (7 replies) |
| Old houses in Fanwood (11 replies) |
| New home hunters - help please! (22 replies) |
| Fanwood (3 replies) |
| DIY Deck - Fanwood NJ (8 replies) |
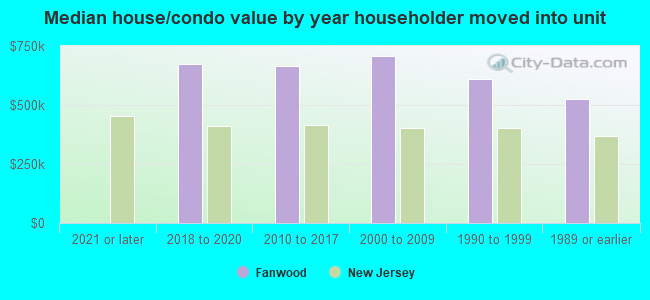
Median year apartment built: 2010
Household type by relationship:
Households: 7,692- Male householders: 1,501 (176 living alone), Female householders: 1,295 (258 living alone)
2,095 spouses (2,095 opposite-sex spouses), 50 unmarried partners, (50 opposite-sex unmarried partners), 2,329 children (2,180 natural, 55 adopted, 93 stepchildren), 35 grandchildren, 36 brothers or sisters, 69 parents, 7 foster children, 84 other relatives, 103 non-relatives
- In group quarters: 80
Size of family households: 1,047 2-persons, 409 3-persons, 619 4-persons, 161 5-persons, 30 6-persons.
Size of nonfamily households: 422 1-person, 112 2-persons, 12 3-persons.
1,483 married couples with children.
172 single-parent households (0 men, 172 women).
85.8% of residents of Fanwood speak English at home.
3.5% of residents speak Spanish at home (84% speak English very well, 7% speak English well, 9% speak English not well).
6.4% of residents speak other Indo-European language at home (91% speak English very well, 9% speak English well).
2.4% of residents speak Asian or Pacific Island language at home (69% speak English very well, 4% speak English well, 17% speak English not well, 9% don't speak English at all).
Foreign born population: 1,137 (14.8%)
(60.2% of them are naturalized citizens)
| Here: | 7.8 |
| State: | 6.8 |
| Here: | 4.5 |
| State: | 3.9 |
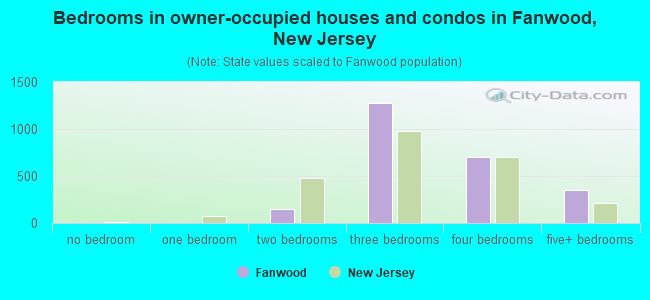
- Bedrooms in owner-occupied houses and condos in Fanwood, New Jersey
- 0no bedroom
- 01 bedroom
- 1452 bedrooms
- 1,2733 bedrooms
- 6974 bedrooms
- 3555+ bedrooms
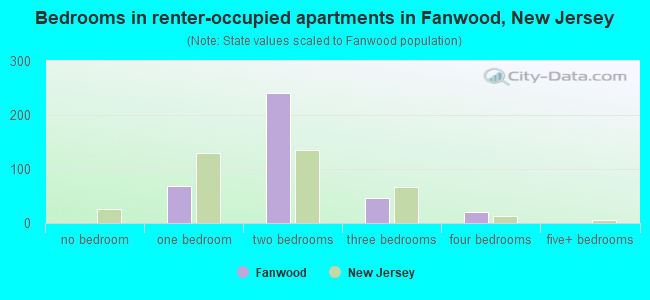
- Bedrooms in renter-occupied apartments in Fanwood, New Jersey
- 0no bedroom
- 681 bedroom
- 2402 bedrooms
- 473 bedrooms
- 204 bedrooms
- 05+ bedrooms
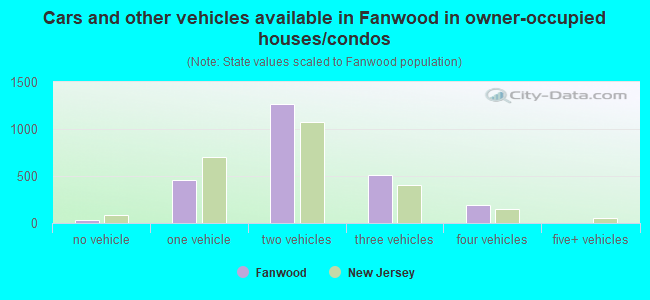
- Cars and other vehicles available in Fanwood in owner-occupied houses/condos
- 35no vehicle
- 4561 vehicle
- 1,2682 vehicles
- 5153 vehicles
- 1954 vehicles
- 05+ vehicles
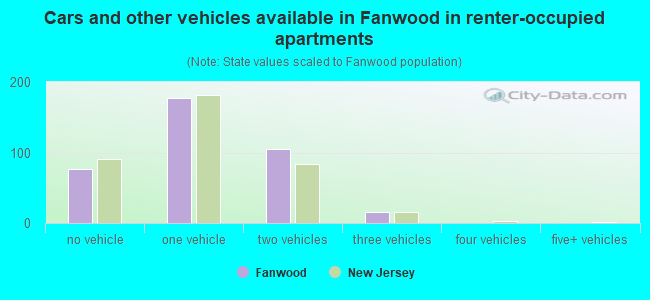
- Cars and other vehicles available in Fanwood in renter-occupied apartments
- 76no vehicle
- 1771 vehicle
- 1052 vehicles
- 163 vehicles
- 04 vehicles
- 05+ vehicles
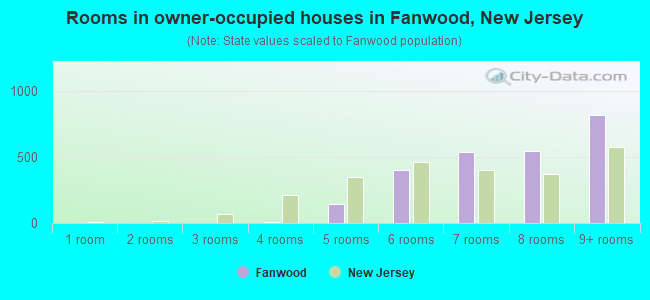
- Rooms in owner-occupied houses in Fanwood, New Jersey
- 01 room
- 02 rooms
- 03 rooms
- 114 rooms
- 1475 rooms
- 4056 rooms
- 5387 rooms
- 5478 rooms
- 8219+ rooms
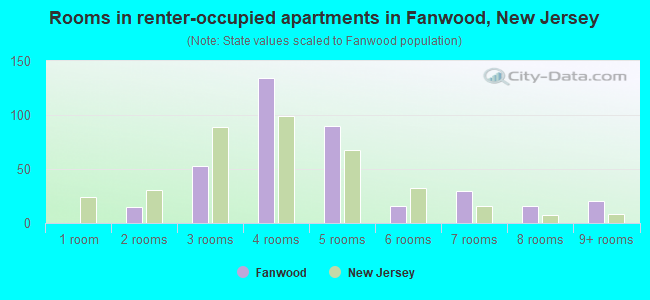
- Rooms in renter-occupied apartments in Fanwood, New Jersey
- 01 room
- 152 rooms
- 533 rooms
- 1344 rooms
- 905 rooms
- 166 rooms
- 307 rooms
- 168 rooms
- 209+ rooms
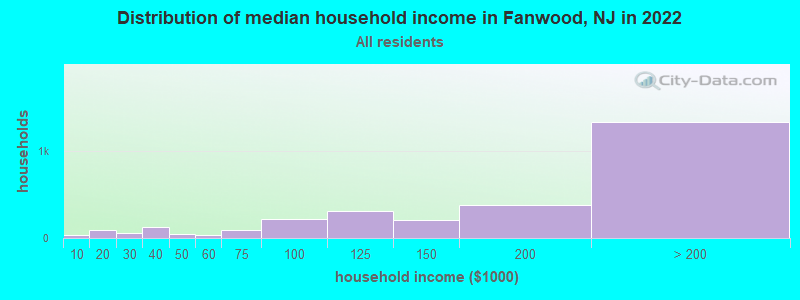
Fanwood, NJ household income distribution

- 38Less than $10,000
- 89$10,000 to $19,999
- 53$20,000 to $29,999
- 128$30,000 to $39,999
- 48$40,000 to $49,999
- 37$50,000 to $59,999
- 94$60,000 to $74,999
- 213$75,000 to $99,999
- 311$100,000 to $124,999
- 201$125,000 to $149,999
- 376$150,000 to $199,999
- 1,327$200,000 or more
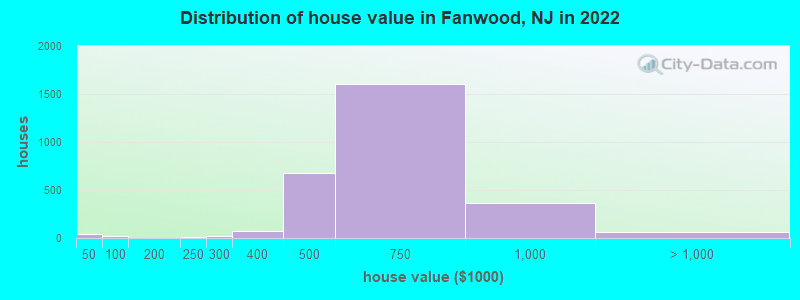
Home value of owner - occupied houses in 2022 in Fanwood, NJ
-
- 37Less than $10,000
- 21$70,000 to $79,999
- 14$200,000 to $249,999
- 15$250,000 to $299,999
- 69$300,000 to $399,999
- 676$400,000 to $499,999
- 1,599$500,000 to $749,999
- 362$750,000 to $999,999
- 61$1,000,000 to $1,499,999
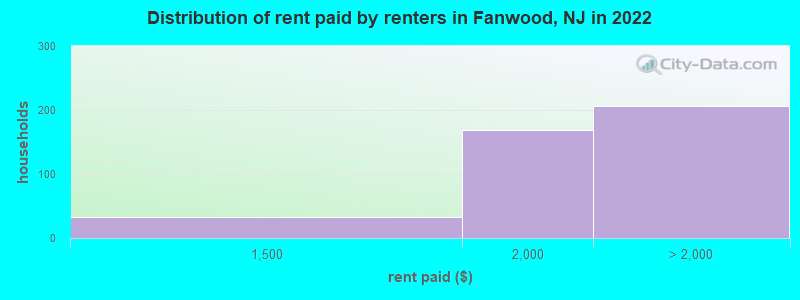
Rent paid by renters in 2022 in Fanwood, NJ
-
- 33$1,250 to $1,499
- 168$1,500 to $1,999
- 47$2,000 to $2,499
- 26$2,500 to $2,999
- 48$3,000 to $3,499
- 74$3,500 or more
- 10No cash rent
Percentage of workers working in this county: 54.9%
Number of people working at home: 1,227 (29.9% of all workers)
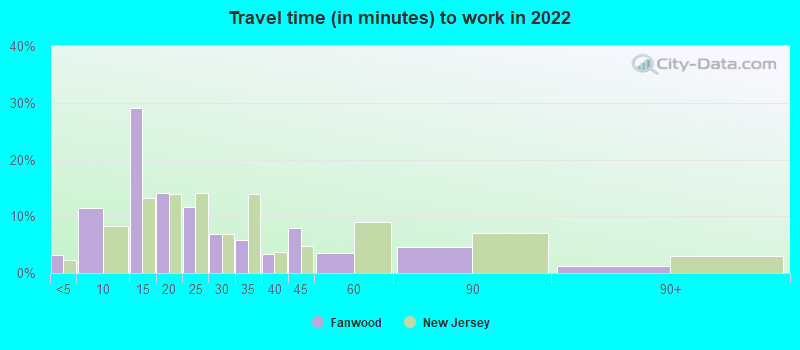
Travel time to work (commute)
- Less than 5 minutes: 26
- 5 to 9 minutes: 210
- 10 to 14 minutes: 342
- 15 to 19 minutes: 168
- 20 to 24 minutes: 401
- 25 to 29 minutes: 81
- 30 to 34 minutes: 325
- 35 to 39 minutes: 100
- 40 to 44 minutes: 187
- 45 to 59 minutes: 250
- 60 to 89 minutes: 431
- 90 or more minutes: 465
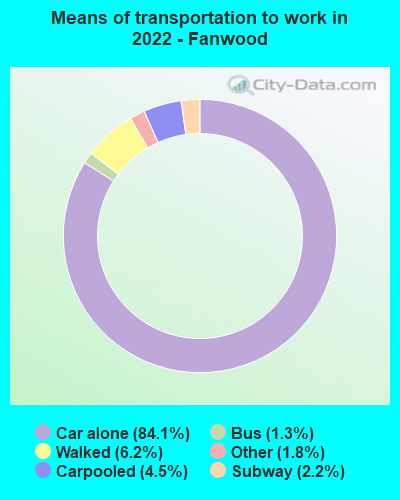
Means of transportation to work:
- Drove a car alone: 686 (37.3%)
- Carpooled: 44 (2.4%)
- Bus: 12 (0.7%)
- Long-distance train or commuter rail: 22 (1.2%)
- Taxi: 12 (0.7%)
- Walked: 55 (3.0%)
- Worked at home: 1,227 (66.6%)
- Unemployment by race in 2022
- Unemployment rate for White non-Hispanic residents
- 3.2%Males
- 4.7%Females
- Unemployment rate for Black residents
- 9.9%Females
- Unemployment rate for two or more race residents
- 4.7%Males
- 6.4%Females
- Unemployment rate for Hispanic or Latino residents
- 21.0%Females
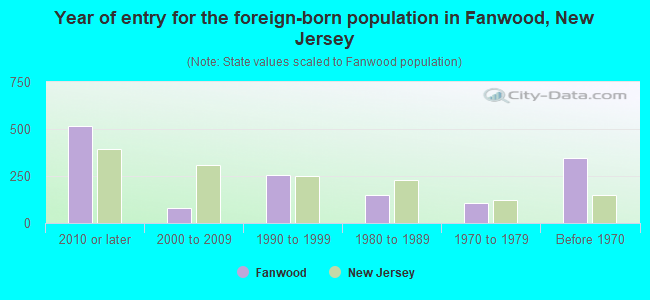
- Year of entry for the foreign-born population in Fanwood, New Jersey
- 5152010 or later
- 802000 to 2009
- 2571990 to 1999
- 1511980 to 1989
- 1051970 to 1979
- 344Before 1970
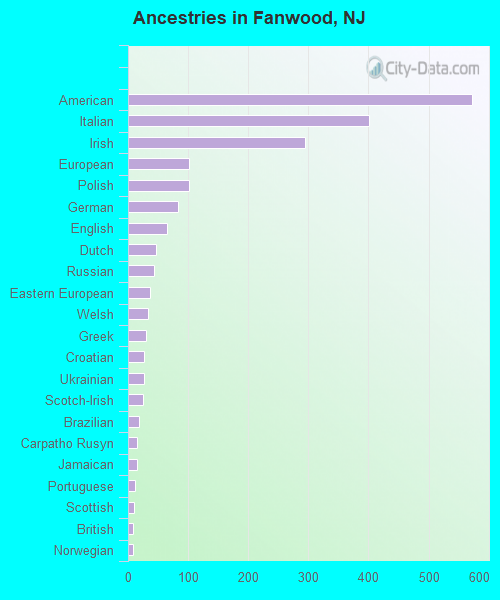
First ancestries reported:
- American: 572 (18.6%)
- Italian: 401 (13.0%)
- Irish: 294 (9.5%)
- European: 102 (3.3%)
- Polish: 102 (3.3%)
- German: 83 (2.7%)
- English: 65 (2.1%)
- Dutch: 47 (1.5%)
- Russian: 44 (1.4%)
- Eastern European: 37 (1.2%)
- Welsh: 34 (1.1%)
- Greek: 30 (1.0%)
- Croatian: 27 (0.9%)
- Ukrainian: 27 (0.9%)
- Scotch-Irish: 25 (0.8%)
- Brazilian: 18 (0.6%)
- Carpatho Rusyn: 15 (0.5%)
- Jamaican: 15 (0.5%)
- Portuguese: 12 (0.4%)
- Scottish: 10 (0.3%)
- British: 9 (0.3%)
- Norwegian: 9 (0.3%)
Most common places of birth for foreign-born residents (%):
| Fanwood: | 23.8% (263) |
| New Jersey: | 12.8% (274,609) |
| Fanwood: | 6.0% (66) |
| New Jersey: | 9.7% (209,055) |
| Fanwood: | 5.1% (56) |
| New Jersey: | 0.8% (17,217) |
| Fanwood: | 4.4% (49) |
| New Jersey: | 2.1% (45,435) |
| Fanwood: | 4.2% (47) |
| New Jersey: | 3.7% (78,969) |
| Fanwood: | 4.2% (46) |
| New Jersey: | 4.2% (90,817) |
| Fanwood: | 4.1% (45) |
| New Jersey: | 2.2% (47,365) |
| Fanwood: | 3.9% (43) |
| New Jersey: | 0.5% (10,886) |
| Fanwood: | 3.8% (42) |
| New Jersey: | 0.5% (11,161) |
| Fanwood: | 3.1% (34) |
| New Jersey: | 0.1% (2,004) |
| Fanwood: | 2.9% (32) |
| New Jersey: | 3.3% (70,512) |
| Fanwood: | 2.9% (32) |
| New Jersey: | 4.0% (85,934) |
| Fanwood: | 2.8% (31) |
| New Jersey: | 1.5% (33,198) |
| Fanwood: | 2.8% (31) |
| New Jersey: | 0.2% (3,482) |
| Fanwood: | 1.8% (20) |
| New Jersey: | 0.4% (7,791) |
| Fanwood: | 1.6% (18) |
| New Jersey: | 0.2% (4,290) |
| Fanwood: | 1.6% (18) |
| New Jersey: | 2.1% (46,020) |
| Fanwood: | 1.6% (18) |
| New Jersey: | 4.4% (95,275) |
| Fanwood: | 1.5% (17) |
| New Jersey: | 2.3% (48,811) |
Place of birth for U.S.-born residents:
- This state: 3,477
- Other state: 3,079
- Northeast: 2,354
- Midwest: 180
- South: 561
- West: 37
90.4% of Fanwood residents lived in the same house 1 years ago.
Out of people who lived in different houses, 21.5% lived in this county.
Out of people who lived in different counties, 81.0% lived in New Jersey.
| Fanwood: | 90.4% |
| State average: | 90.4% |
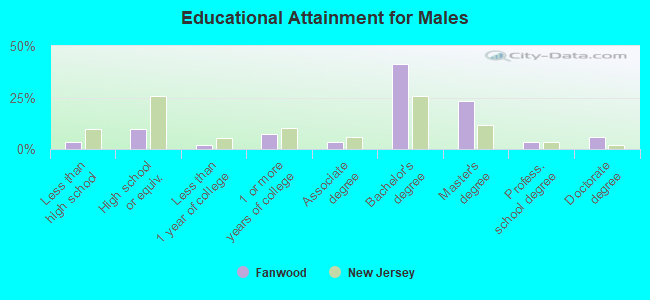
Education attainment for males 25 years and older:
- No schooling: 0
- Nursery to 4th grade: 0
- 5th and 6th grade: 4
- 7th and 8th grade: 50
- 9th grade: 0
- 10th grade: 12
- 11th grade: 14
- 12th grade, no diploma: 13
- High school graduate (or equivalency): 259
- Less than 1 year of college: 50
- Some college more than 1 year, no degree: 195
- Associate degree: 83
- Bachelor's degree: 1,074
- Master's degree: 611
- Professional school degree: 91
- Doctorate degree: 152
Education attainment for females 25 years and older:
- No schooling: 24
- Nursery to 4th grade: 0
- 5th and 6th grade: 3
- 7th and 8th grade: 0
- 9th grade: 0
- 10th grade: 0
- 11th grade: 22
- 12th grade, no diploma: 9
- High school graduate (or equivalency): 362
- Less than 1 year of college: 93
- Some college more than 1 year, no degree: 131
- Associate degree: 138
- Bachelor's degree: 1,169
- Master's degree: 754
- Professional school degree: 106
- Doctorate degree: 11

Housing units in structures:
- One, detached: 2,404
- One, attached: 114
- Two: 63
- 3 or 4: 56
- 10 to 19: 43
- 20 to 49: 127
- Mobile homes: 25
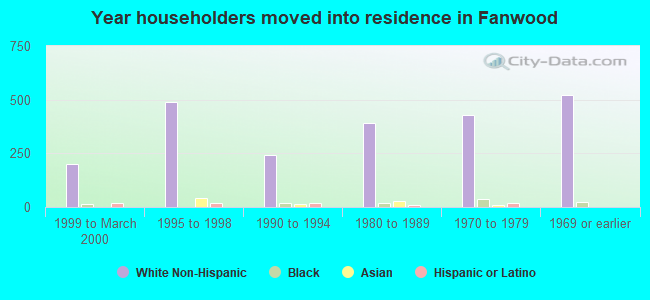
House/condo owner moved in on average 17 years ago
Renter moved in on average 0 years ago
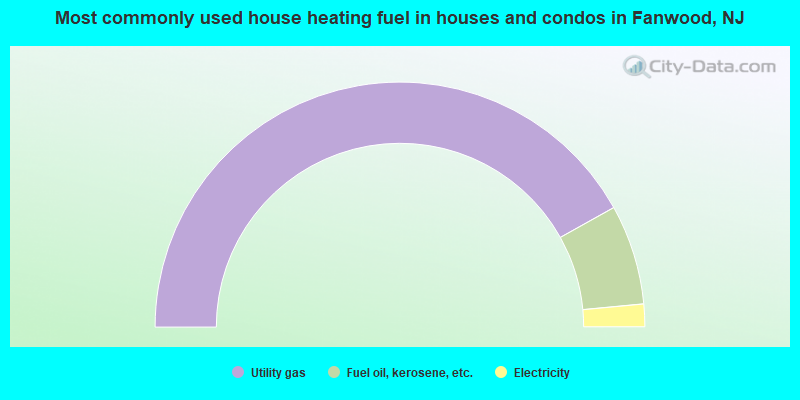
- 83.8%Utility gas
- 13.2%Fuel oil, kerosene, etc.
- 3.0%Electricity
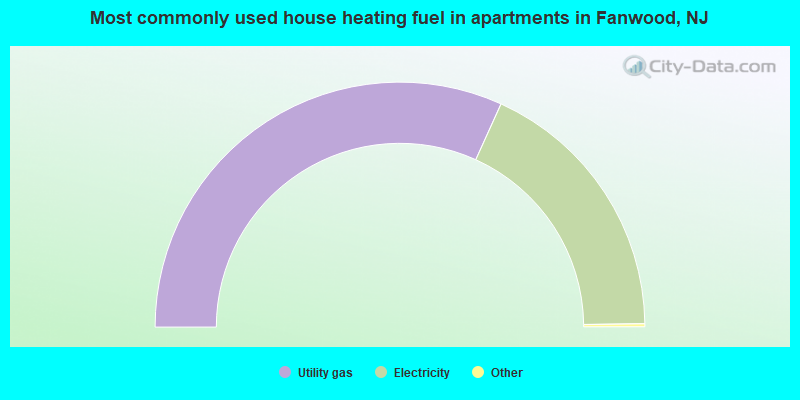
- 63.8%Utility gas
- 36.2%Electricity
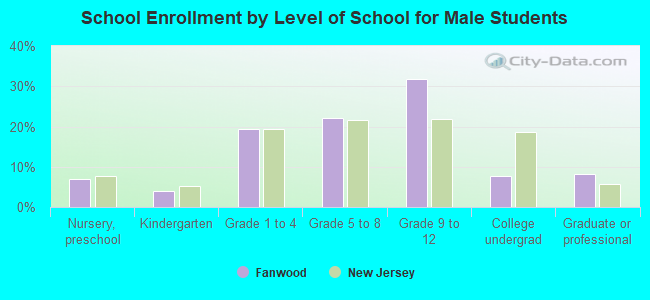
Private vs. public school enrollment:
| Here: | 3.5% |
| New Jersey: | 12.3% |
| Here: | 5.1% |
| New Jersey: | 13.1% |
| Here: | 7.2% |
| New Jersey: | 33.2% |