Falman-County Acres, TX (Texas) Houses and Residents
| Falman-County Acres: | $94,531 |
| Texas: | $275,400 |
Total population: 293 (Urban population: 244 (all inside urban clusters), Rural population: 0)
Houses: 105 (94 occupied: 61 owner occupied, 33 renter occupied)
| % of renters here: | 35% |
| State: | 38% |
Housing density: 425 houses/condos per square mile
Median price asked for vacant for-sale houses and condos in 2022 in this county: $333,547.
Median contract rent in 2022: $652 (lower quartile is $644, upper quartile is $675)
Median rent asked for vacant for-rent units in 2022: $659
Median gross rent in Falman-County Acres, TX in 2022: $813
Housing units in Falman-County Acres with a mortgage: 0 (0 second mortgage, 0 home equity loan, 0 both second mortgage and home equity loan)
Houses without a mortgage: 9


Household type by relationship:
Households: 64,124- In family households: 57,258 (11,820 male householders, 5,119 female householders)
12,214 spouses, 21,063 children (19,231 natural, 416 adopted, 1,416 stepchildren), 2,849 grandchildren, 553 brothers or sisters, 522 parents, foster children, 887 other relatives, 1,544 non-relatives
- In nonfamily households: 6,866 (2,848 male householders (2,285 living alone)), 2,850 female householders (2,477 living alone)), 1,168 nonrelatives
- In group quarters: 680 (638 institutionalized population)
13,849 married couples with children.
4,152 single-parent households (1,138 men, 3,014 women).
91.7% of residents of Falman-County Acres speak English at home.
8.3% of residents speak Spanish at home (74% speak English very well, 26% speak English well).
Foreign born population: 11 (4.3%)
(0.0% of them are naturalized citizens)
| Here: | 5.8 |
| State: | 6.3 |
| Here: | 3.3 |
| State: | 4.0 |
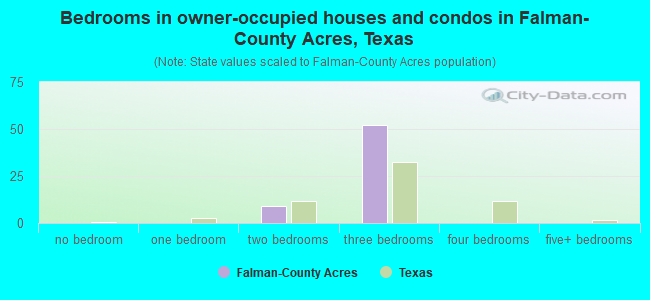
- Bedrooms in owner-occupied houses and condos in Falman-County Acres, Texas
- 0no bedroom
- 01 bedroom
- 92 bedrooms
- 523 bedrooms
- 04 bedrooms
- 05+ bedrooms
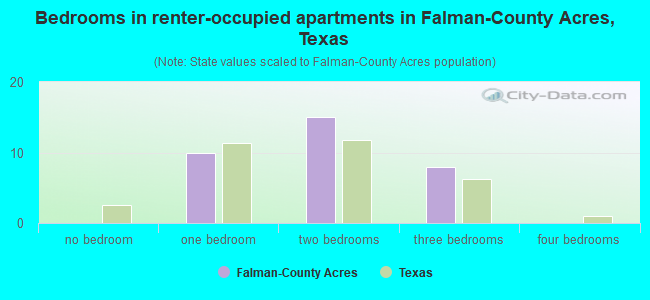
- Bedrooms in renter-occupied apartments in Falman-County Acres, Texas
- 0no bedroom
- 101 bedroom
- 152 bedrooms
- 83 bedrooms
- 04 bedrooms
- 05+ bedrooms
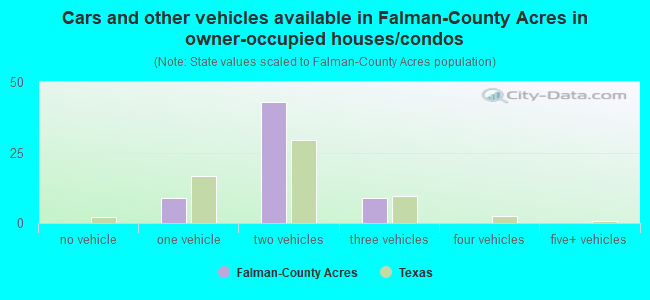
- Cars and other vehicles available in Falman-County Acres in owner-occupied houses/condos
- 0no vehicle
- 91 vehicle
- 432 vehicles
- 93 vehicles
- 04 vehicles
- 05+ vehicles
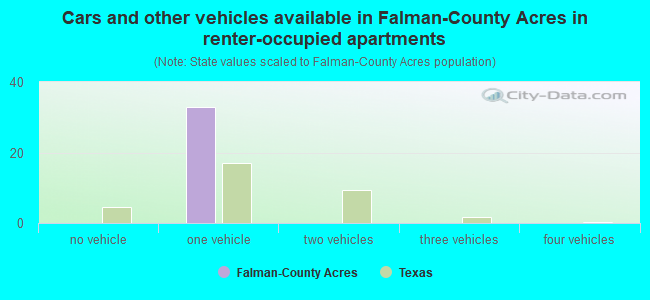
- Cars and other vehicles available in Falman-County Acres in renter-occupied apartments
- 0no vehicle
- 331 vehicle
- 02 vehicles
- 03 vehicles
- 04 vehicles
- 05+ vehicles
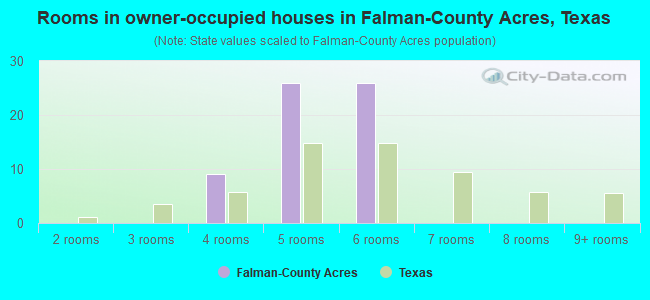
- Rooms in owner-occupied houses in Falman-County Acres, Texas
- 01 room
- 02 rooms
- 03 rooms
- 94 rooms
- 265 rooms
- 266 rooms
- 07 rooms
- 08 rooms
- 09+ rooms
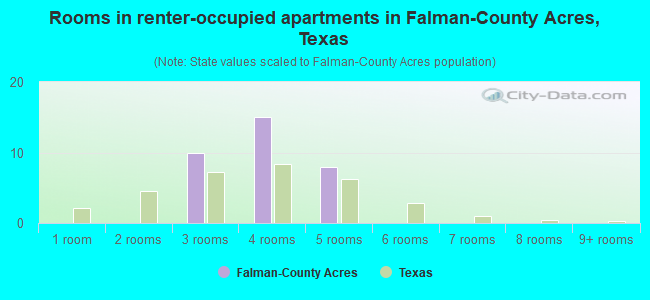
- Rooms in renter-occupied apartments in Falman-County Acres, Texas
- 01 room
- 02 rooms
- 103 rooms
- 154 rooms
- 85 rooms
- 06 rooms
- 07 rooms
- 08 rooms
- 09+ rooms
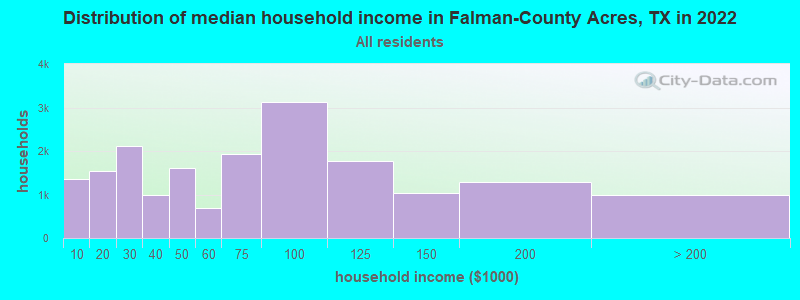
Falman-County Acres, TX household income distribution

- 1,363Less than $10,000
- 1,540$10,000 to $19,999
- 2,119$20,000 to $29,999
- 998$30,000 to $39,999
- 1,598$40,000 to $49,999
- 694$50,000 to $59,999
- 1,920$60,000 to $74,999
- 3,115$75,000 to $99,999
- 1,779$100,000 to $124,999
- 1,042$125,000 to $149,999
- 1,293$150,000 to $199,999
- 981$200,000 or more
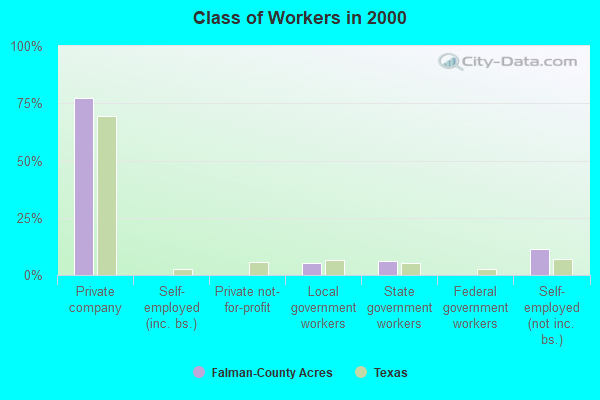
Percentage of workers working in this county: 54.0%
Number of people working at home: 26 (14.9% of all workers)
Travel time to work (commute)
- Less than 5 minutes: 0
- 5 to 9 minutes: 14
- 10 to 14 minutes: 25
- 15 to 19 minutes: 21
- 20 to 24 minutes: 6
- 25 to 29 minutes: 8
- 30 to 34 minutes: 10
- 35 to 39 minutes: 18
- 40 to 44 minutes: 6
- 45 to 59 minutes: 0
- 60 to 89 minutes: 0
- 90 or more minutes: 0
Means of transportation to work:
- Drove a car alone: 84 (77.8%)
- Carpooled: 6 (5.6%)
- Other means: 18 (16.7%)
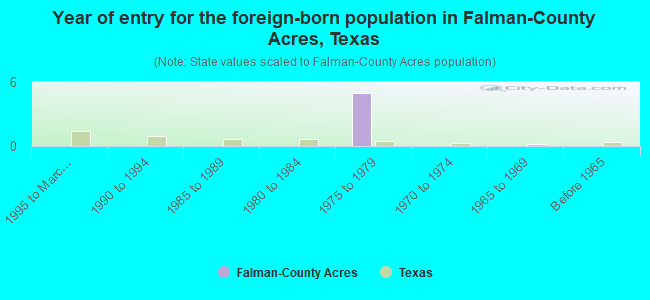
- Year of entry for the foreign-born population in Falman-County Acres, Texas
- 01995 to March 2000
- 01990 to 1994
- 01985 to 1989
- 01980 to 1984
- 51975 to 1979
- 01970 to 1974
- 01965 to 1969
- 0Before 1965
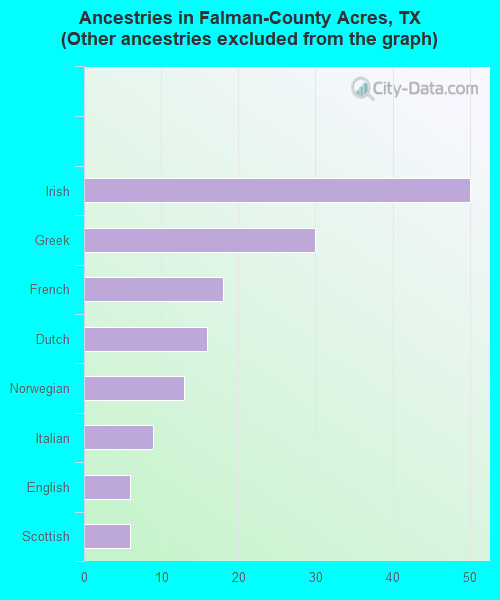
First ancestries reported:
- Other: 63 (29.9%)
- Irish: 50 (23.7%)
- Greek: 30 (14.2%)
- French: 18 (8.5%)
- Dutch: 16 (7.6%)
- Norwegian: 13 (6.2%)
- Italian: 9 (4.3%)
- English: 6 (2.8%)
- Scottish: 6 (2.8%)
Most common places of birth for foreign-born residents (%):
| Falman-County Acres: | 100.0% (5) |
| Texas: | 64.8% (1,879,369) |
Place of birth for U.S.-born residents:
- This state: 140
- Other state: 99
- Northeast: 16
- Midwest: 30
- South: 47
- West: 6
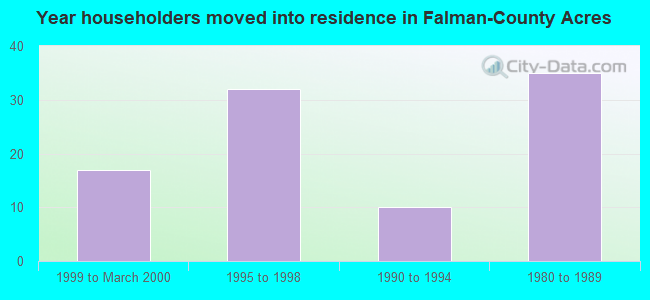
53% of Falman-County Acres residents lived in the same house 5 years ago.
Out of people who lived in different houses, 64% lived in this county.
Out of people who lived in different counties, 28% lived in Texas.
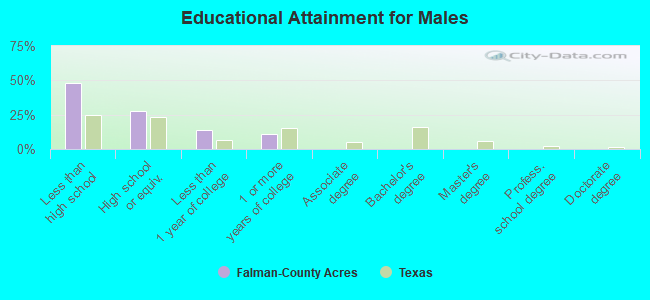
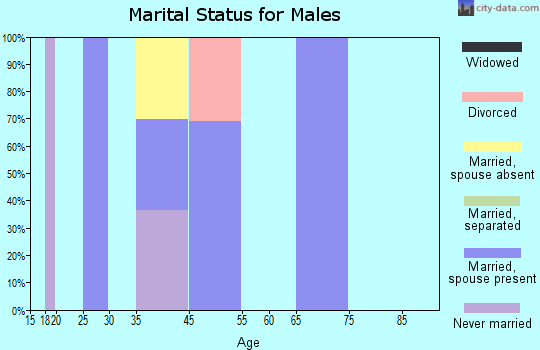
Education attainment for males 25 years and older:
- No schooling: 0
- Nursery to 4th grade: 0
- 5th and 6th grade: 0
- 7th and 8th grade: 0
- 9th grade: 0
- 10th grade: 23
- 11th grade: 0
- 12th grade, no diploma: 12
- High school graduate (or equivalency): 20
- Less than 1 year of college: 10
- Some college more than 1 year, no degree: 8
- Associate degree: 0
- Bachelor's degree: 0
- Master's degree: 0
- Professional school degree: 0
- Doctorate degree: 0
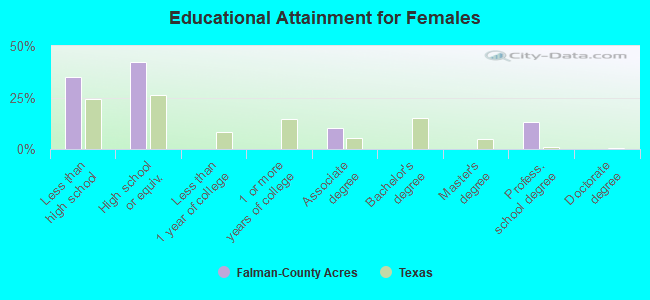
Education attainment for females 25 years and older:
- No schooling: 0
- Nursery to 4th grade: 0
- 5th and 6th grade: 5
- 7th and 8th grade: 12
- 9th grade: 0
- 10th grade: 0
- 11th grade: 0
- 12th grade, no diploma: 7
- High school graduate (or equivalency): 29
- Less than 1 year of college: 0
- Some college more than 1 year, no degree: 0
- Associate degree: 7
- Bachelor's degree: 0
- Master's degree: 0
- Professional school degree: 9
- Doctorate degree: 0
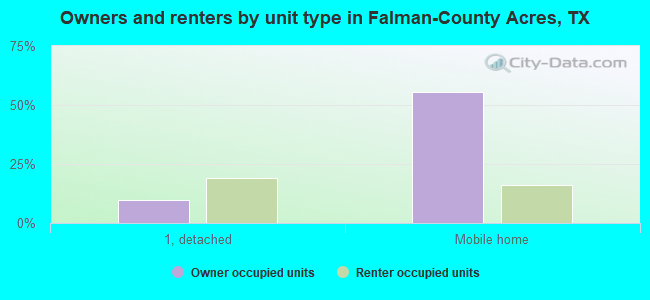
Housing units in structures:
- One, detached: 27
- Mobile homes: 78
Median worth of mobile homes: $60,362
Housing units lacking complete kitchen facilities: 5.7%
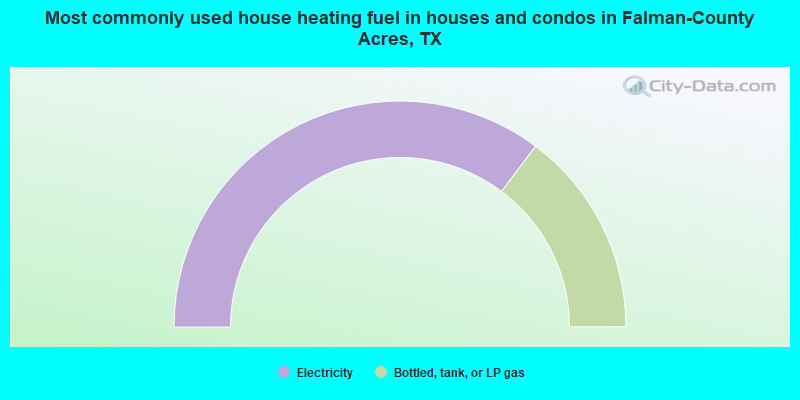
- 70.5%Electricity
- 29.5%Bottled, tank, or LP gas
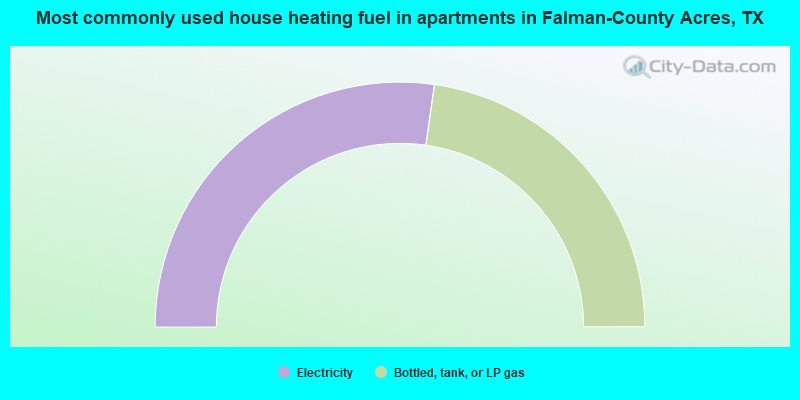
- 54.5%Electricity
- 45.5%Bottled, tank, or LP gas
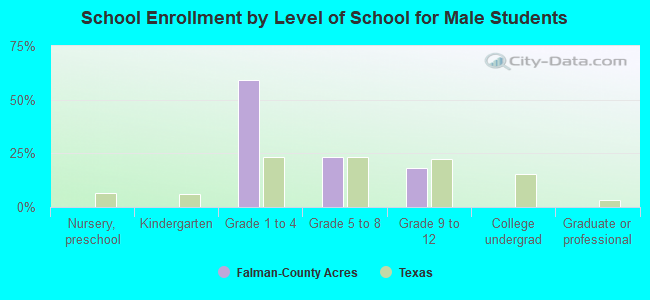
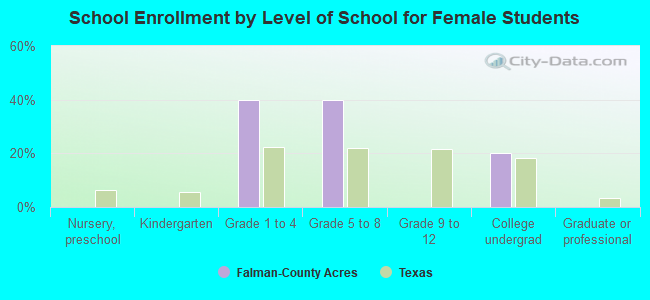
Private vs. public school enrollment:
| Here: | 27.9% |
| Texas: | 6.8% |
| Here: | 0.0% |
| Texas: | 6.2% |
| Here: | 0.0% |
| Texas: | 15.4% |