Eureka, NV (Nevada) Houses and Residents
| Eureka: | $227,373 |
| Nevada: | $434,700 |
Total population: 1,041 (Urban population: 0, Rural population: 1,123 (137 farm, 986 nonfarm))
Houses: 658 (437 occupied: 303 owner occupied, 134 renter occupied)
| % of renters here: | 31% |
| State: | 40% |
Housing density: 0 houses/condos per square mile
Median price asked for vacant for-sale houses and condos in 2022 in this county: $179,818.
Median contract rent in 2022: $828
Median rent asked for vacant for-rent units in 2022: $1,036
Median gross rent in Eureka, NV in 2022: $974
Housing units in Eureka with a mortgage: 45 (0 second mortgage, 4 home equity loan, 0 both second mortgage and home equity loan)
Houses without a mortgage: 37
Compare current foreclosures near your location:
| Photo | Address | Area | Beds / Baths | Price | Details |
|---|---|---|---|---|---|

|
#1
Bayberry Cir
Columbus, OH 43207
|
1,564 sq. feet
|
1 baths 3 beds |
$127,500
|
show details |

|
#2
E 21st Ave
Columbus, OH 43211
|
1,061 sq. feet
|
1 baths 3 beds |
$179,900
|
show details |

|
#3
S High St
Columbus, OH 43207
|
1,678 sq. feet
|
2 baths 4 beds |
$31,900
|
show details |

|
#4
Hiawatha Park Dr
Columbus, OH 43211
|
1,278 sq. feet
|
1 baths 4 beds |
show details | |

|
#5
Falls Peak Ln
Delaware, OH 43015
|
1,352 sq. feet
|
2 baths 2 beds |
show details | |

|
#6
Meadowbrook Dr
Columbus, OH 43207
|
1,752 sq. feet
|
2 baths 4 beds |
show details | |

|
#7
Wrexham Ave
Columbus, OH 43223
|
1,235 sq. feet
|
1 baths 3 beds |
show details | |

|
#8
Summertree Ln
Westerville, OH 43081
|
2,496 sq. feet
|
2 baths 3 beds |
show details | |

|
#9
Lehner Rd
Columbus, OH 43224
|
1,628 sq. feet
|
2 baths 4 beds |
show details | |

|
#10
E Howard Rd
Columbus, OH 43207
|
1,056 sq. feet
|
1 baths 3 beds |
show details |
| Photo | Address | Area | Beds / Baths | Price | Details |
|---|---|---|---|---|---|

|
#11
N Roys Ave
Columbus, OH 43204
|
1,248 sq. feet
|
2 baths 3 beds |
show details | |

|
#12
Executive Ct
Westerville, OH 43081
|
1,811 sq. feet
|
2 baths 3 beds |
show details | |

|
#13
S Richardson Ave
Columbus, OH 43204
|
1,520 sq. feet
|
2 baths 3 beds |
show details | |

|
#14
E Lincoln Ave
Columbus, OH 43214
|
874 sq. feet
|
1 baths 3 beds |
show details | |

|
#15
Fergus Rd
Grove City, OH 43123
|
3,312 sq. feet
|
2 baths 4 beds |
show details | |

|
#16
Chester Rd
Columbus, OH 43221
|
3,300 sq. feet
|
4 baths 5 beds |
show details | |

|
#17
Cannonade Ct
Columbus, OH 43230
|
2,023 sq. feet
|
2 baths 3 beds |
show details | |

|
#18
E Welch Ave
Columbus, OH 43207
|
1,864 sq. feet
|
2 baths 4 beds |
show details | |

|
#19
Fairfield Ave
Columbus, OH 43203
|
984 sq. feet
|
1 baths 2 beds |
show details | |

|
#20
S Champion Ave
Columbus, OH 43207
|
1,157 sq. feet
|
1 baths 2 beds |
show details |
| Photo | Address | Area | Beds / Baths | Price | Details |
|---|---|---|---|---|---|

|
#21
Striebel Ct
Columbus, OH 43227
|
925 sq. feet
|
1 baths 3 beds |
show details | |

|
#22
Upton Rd E
Columbus, OH 43232
|
852 sq. feet
|
1 baths 3 beds |
show details | |

|
#23
Armada Rd
Columbus, OH 43232
|
1,028 sq. feet
|
1 baths 4 beds |
show details | |

|
#24
N 18th St
Columbus, OH 43203
|
1,690 sq. feet
|
1 baths 4 beds |
show details | |

|
#25
Glenmate Ct
Columbus, OH 43223
|
1,050 sq. feet
|
1 baths 3 beds |
show details | |

|
#26
High Free Pike
West Jefferson, OH 43162
|
1,216 sq. feet
|
2 baths 4 beds |
show details | |

|
#27
Grasmere Ave
Columbus, OH 43211
|
720 sq. feet
|
1 baths 2 beds |
show details | |

|
#28
London Groveport Rd
Grove City, OH 43123
|
816 sq. feet
|
1 baths 2 beds |
show details | |

|
#29
Chidley St
Galloway, OH 43119
|
1,502 sq. feet
|
1 baths 3 beds |
show details | |

|
#30
Whittman Ct
Plain City, OH 43064
|
3,186 sq. feet
|
3 baths 4 beds |
show details |
| Photo | Address | Area | Beds / Baths | Price | Details |
|---|---|---|---|---|---|

|
#31
Hildreth Ave
Columbus, OH 43203
|
1,798 sq. feet
|
2 baths 4 beds |
show details | |

|
#32
Gladys Rd
Columbus, OH 43228
|
832 sq. feet
|
1 baths 3 beds |
show details | |

|
#33
Hamilton Ave
Columbus, OH 43211
|
1,061 sq. feet
|
1 baths 3 beds |
show details | |

|
#34
Kelton Ave
Columbus, OH 43206
|
1,080 sq. feet
|
1 baths 3 beds |
show details | |

|
#35
Roundelay Rd N
Reynoldsburg, OH 43068
|
1,712 sq. feet
|
2 baths 3 beds |
show details | |

|
#36
Ashgrove Dr
Grove City, OH 43123
|
1,772 sq. feet
|
2 baths 4 beds |
show details | |

|
#37
Doral Ave
Columbus, OH 43213
|
2,124 sq. feet
|
2 baths 4 beds |
show details | |

|
#38
Edgeview Rd
Columbus, OH 43207
|
1,352 sq. feet
|
1 baths 4 beds |
show details | |

|
#39
Grand Bend Dr
Groveport, OH 43125
|
1,612 sq. feet
|
1 baths 3 beds |
show details | |

|
#40
Huxley Dr
Columbus, OH 43227
|
1,284 sq. feet
|
1 baths 3 beds |
show details |
| Photo | Address | Area | Beds / Baths | Price | Details |
|---|---|---|---|---|---|

|
#41
Beechview Dr S
Columbus, OH 43085
|
1,998 sq. feet
|
1 baths 3 beds |
show details | |

|
#42
Westrock Dr
Hilliard, OH 43026
|
1,624 sq. feet
|
2 baths 4 beds |
show details | |

|
#43
Justin Rd
Columbus, OH 43227
|
986 sq. feet
|
1 baths 3 beds |
show details | |

|
#44
Torchwood Loop E
Columbus, OH 43229
|
2,116 sq. feet
|
2 baths 4 beds |
show details | |

|
#45
S Cypress Ave
Columbus, OH 43222
|
1,508 sq. feet
|
1 baths 3 beds |
show details | |

|
#46
Morality Dr
Columbus, OH 43231
|
1,903 sq. feet
|
2 baths 4 beds |
show details | |

|
#47
Mayflower Cir
Grove City, OH 43123
|
2,084 sq. feet
|
2 baths 4 beds |
show details | |

|
#48
Jed Ct
Columbus, OH 43227
|
1,086 sq. feet
|
1 baths 3 beds |
show details | |

|
#49
Wendler Blvd
Columbus, OH 43230
|
1,040 sq. feet
|
1 baths 3 beds |
show details | |

|
Check over 1 million property listings on Foreclosure.com!
|
browse all offers | |||


Household type by relationship:
Households: 1,986- In family households: 1,552 (388 male householders, 107 female householders)
431 spouses, 519 children (461 natural, 16 adopted, 42 stepchildren), 34 grandchildren, 19 brothers or sisters, 6 parents, foster children, 12 other relatives, 33 non-relatives
- In nonfamily households: 434 (231 male householders (190 living alone)), 110 female householders (86 living alone)), 93 nonrelatives
- In group quarters: 1 (all institutionalized)
383 married couples with children.
57 single-parent households (19 men, 38 women).
86.8% of residents of Eureka speak English at home.
8.9% of residents speak Spanish at home (40% speak English very well, 31% speak English well, 22% speak English not well, 8% don't speak English at all).
1.1% of residents speak other Indo-European language at home (82% speak English very well, 18% speak English well).
1.2% of residents speak Asian or Pacific Island language at home (54% speak English very well, 46% speak English well).
2.0% of residents speak other language at home (62% speak English very well, 24% speak English well, 14% speak English not well).
Foreign born population: 131 (9.9%)
(22.1% of them are naturalized citizens)
| Here: | 6.1 |
| State: | 6.0 |
| Here: | 5.0 |
| State: | 4.2 |

- Bedrooms in owner-occupied houses and condos in Eureka, Nevada
- 6no bedroom
- 271 bedroom
- 952 bedrooms
- 1193 bedrooms
- 484 bedrooms
- 85+ bedrooms

- Bedrooms in renter-occupied apartments in Eureka, Nevada
- 9no bedroom
- 241 bedroom
- 472 bedrooms
- 473 bedrooms
- 74 bedrooms
- 05+ bedrooms

- Cars and other vehicles available in Eureka in owner-occupied houses/condos
- 16no vehicle
- 661 vehicle
- 972 vehicles
- 803 vehicles
- 324 vehicles
- 125+ vehicles

- Cars and other vehicles available in Eureka in renter-occupied apartments
- 9no vehicle
- 591 vehicle
- 462 vehicles
- 153 vehicles
- 54 vehicles
- 05+ vehicles

- Rooms in owner-occupied houses in Eureka, Nevada
- 61 room
- 92 rooms
- 173 rooms
- 654 rooms
- 575 rooms
- 606 rooms
- 387 rooms
- 268 rooms
- 259+ rooms

- Rooms in renter-occupied apartments in Eureka, Nevada
- 61 room
- 82 rooms
- 253 rooms
- 354 rooms
- 355 rooms
- 206 rooms
- 07 rooms
- 38 rooms
- 29+ rooms


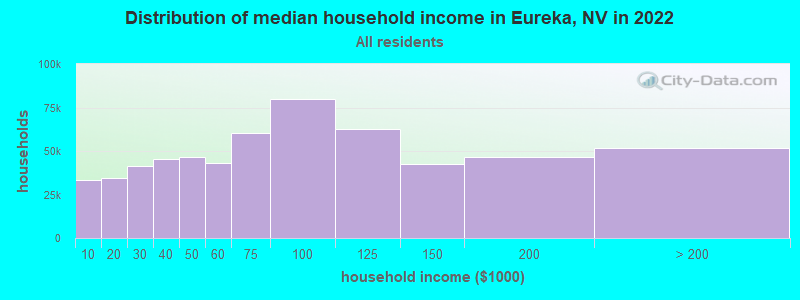
Eureka, NV household income distribution

- 2,370Less than $10,000
- 4,079$10,000 to $19,999
- 4,178$20,000 to $29,999
- 5,289$30,000 to $39,999
- 4,848$40,000 to $49,999
- 4,357$50,000 to $59,999
- 5,086$60,000 to $74,999
- 9,279$75,000 to $99,999
- 8,780$100,000 to $124,999
- 6,524$125,000 to $149,999
- 7,453$150,000 to $199,999
- 7,205$200,000 or more
Percentage of workers working in this county: 91.3%
Number of people working at home: 83 (13.9% of all workers)
Travel time to work (commute)
- Less than 5 minutes: 154
- 5 to 9 minutes: 129
- 10 to 14 minutes: 90
- 15 to 19 minutes: 35
- 20 to 24 minutes: 26
- 25 to 29 minutes: 15
- 30 to 34 minutes: 13
- 35 to 39 minutes: 0
- 40 to 44 minutes: 0
- 45 to 59 minutes: 0
- 60 to 89 minutes: 11
- 90 or more minutes: 10
Means of transportation to work:
- Drove a car alone: 360 (68.1%)
- Carpooled: 75 (14.2%)
- Walked: 48 (9.1%)
- Worked at home: 46 (8.7%)


- Year of entry for the foreign-born population in Eureka, Nevada
- 511995 to March 2000
- 61990 to 1994
- 171985 to 1989
- 241980 to 1984
- 31975 to 1979
- 31970 to 1974
- 01965 to 1969
- 11Before 1965
Most common places of birth for foreign-born residents (%):
| Eureka: | 56.5% (65) |
| Nevada: | 48.6% (153,946) |
| Eureka: | 8.7% (10) |
| Nevada: | 3.4% (10,690) |
| Eureka: | 5.2% (6) |
| Nevada: | 1.6% (5,210) |
| Eureka: | 3.5% (4) |
| Nevada: | 0.8% (2,511) |
| Eureka: | 3.5% (4) |
| Nevada: | 0.1% (354) |
| Eureka: | 3.5% (4) |
| Nevada: | 0.3% (957) |
| Eureka: | 2.6% (3) |
| Nevada: | 2.2% (6,872) |
| Eureka: | 2.6% (3) |
| Nevada: | 0.3% (1,037) |
| Eureka: | 2.6% (3) |
| Nevada: | 0.4% (1,312) |
| Eureka: | 1.7% (2) |
| Nevada: | 0.3% (886) |
| Eureka: | 1.7% (2) |
| Nevada: | 0.5% (1,493) |
| Eureka: | 1.7% (2) |
| Nevada: | 1.9% (6,071) |
| Eureka: | 1.7% (2) |
| Nevada: | 0.5% (1,514) |
| Eureka: | 1.7% (2) |
| Nevada: | 0.2% (543) |
| Eureka: | 1.7% (2) |
| Nevada: | 0.1% (211) |
Place of birth for U.S.-born residents:
- This state: 395
- Other state: 604
- Northeast: 18
- Midwest: 82
- South: 61
- West: 443
62% of Eureka residents lived in the same house 5 years ago.
Out of people who lived in different houses, 24% lived in this county.
Out of people who lived in different counties, 42% lived in Nevada.
Education attainment for males 25 years and older:
- No schooling: 6
- Nursery to 4th grade: 6
- 5th and 6th grade: 3
- 7th and 8th grade: 10
- 9th grade: 5
- 10th grade: 12
- 11th grade: 12
- 12th grade, no diploma: 31
- High school graduate (or equivalency): 87
- Less than 1 year of college: 38
- Some college more than 1 year, no degree: 71
- Associate degree: 16
- Bachelor's degree: 48
- Master's degree: 13
- Professional school degree: 8
- Doctorate degree: 0

Education attainment for females 25 years and older:
- No schooling: 3
- Nursery to 4th grade: 0
- 5th and 6th grade: 3
- 7th and 8th grade: 5
- 9th grade: 15
- 10th grade: 16
- 11th grade: 10
- 12th grade, no diploma: 22
- High school graduate (or equivalency): 103
- Less than 1 year of college: 18
- Some college more than 1 year, no degree: 80
- Associate degree: 16
- Bachelor's degree: 46
- Master's degree: 7
- Professional school degree: 4
- Doctorate degree: 0


Housing units in structures:
- One, detached: 244
- One, attached: 20
- Two: 16
- 3 or 4: 18
- 5 to 9: 3
- Mobile homes: 338
- Boats, RVs, vans, etc.: 19
Median worth of mobile homes: $123,964
Housing units lacking complete kitchen facilities: 4.7%

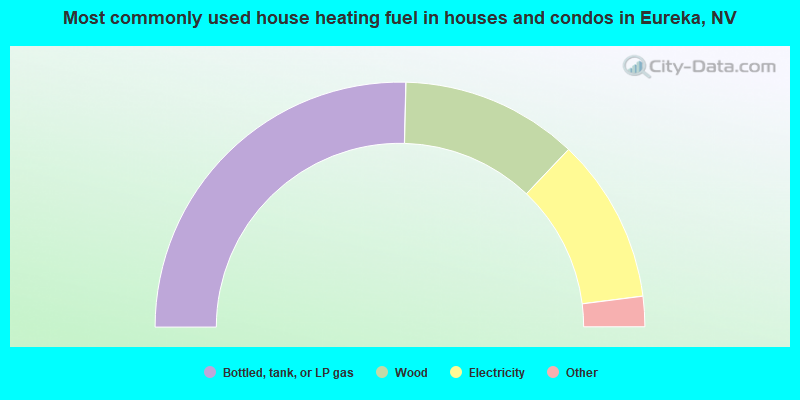
- 50.8%Bottled, tank, or LP gas
- 23.4%Wood
- 21.8%Electricity
- 2.3%Other fuel
- 1.0%Fuel oil, kerosene, etc.
- 0.7%Utility gas
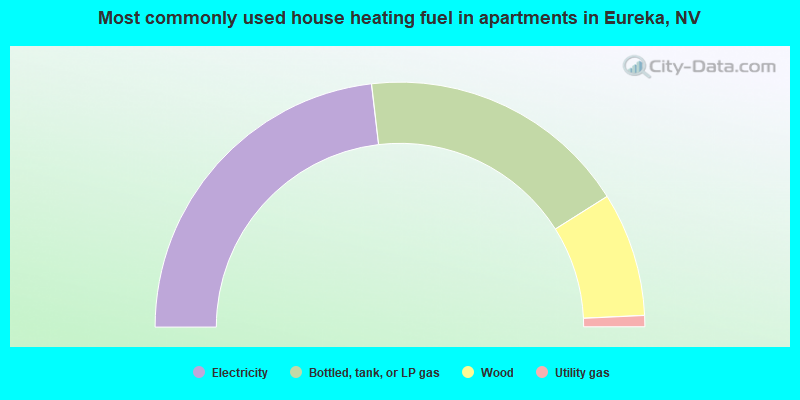
- 46.3%Electricity
- 35.8%Bottled, tank, or LP gas
- 16.4%Wood
- 1.5%Utility gas
Private vs. public school enrollment:
| Here: | 4.5% |
| Nevada: | 4.8% |
| Here: | 0.0% |
| Nevada: | 5.4% |
| Here: | 11.1% |
| Nevada: | 11.7% |


