Elmhurst, IL (Illinois) Houses and Residents
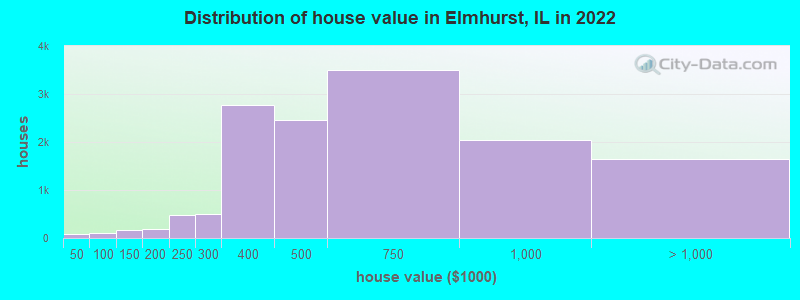
Estimated median house or condo value in 2022: $521,473 (it was $204,700 in 2000 )
Elmhurst:
$521,473Illinois:
$251,600
Lower value quartile - upper value quartile: $383,437 - $774,123Total population: 45,751 (Urban population: 42,959, Rural population: 0)
Houses: 17,686 (16,830 occupied: 13,448 owner occupied, 3,399 renter occupied )
% of renters here:
20%State:
33%
Housing density: 1,723 houses/condos per square mile
Median price asked for vacant for-sale houses and condos in 2022: $609,148.
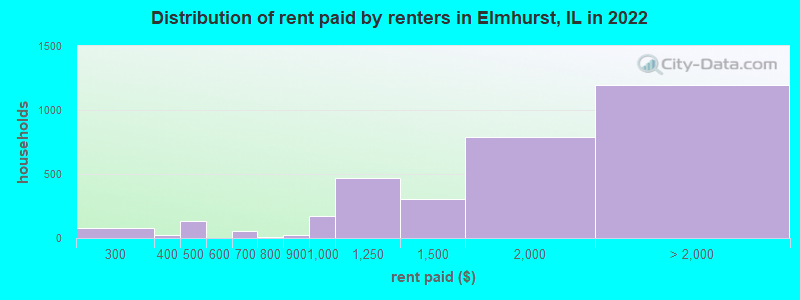
Median contract rent in 2022: $1,679 (lower quartile is $1,169, upper quartile is over $2,000)
Median rent asked for vacant for-rent units in 2022: $2,145
Median gross rent in Elmhurst, IL in 2022: $1,769
Housing units in Elmhurst with a mortgage: 8,844 (909 second mortgage, 15 home equity loan, 868 both second mortgage and home equity loan )Houses without a mortgage: 303
Median household income for houses/condos with a mortgage: $190,896
Median household income for apartments without a mortgage: $100,362
Median monthly housing costs: $2,086
Data:
Median house or condo value ($)
Median house or condo value ($ change since 2000)
Median house or condo value ($) - White
Median house or condo value ($) - Black or African American
Median house or condo value ($) - Asian
Median house or condo value ($) - Hispanic or Latino
Median house or condo value ($) - American Indian and Alaska Native
Median house or condo value ($) - Multirace
Median house or condo value ($) - Other Race
Median price asked for mobile homes ($)
Household density (households per square mile)
Mean house or condo value by units in structure - 1, detached ($)
Mean house or condo value by units in structure - 1, attached ($)
Mean house or condo value by units in structure - 2 ($)
Mean house or condo value by units in structure by units in structure - 3 or 4 ($)
Mean house or condo value by units in structure - 5 or more ($)
Mean house or condo value by units in structure - Boat, RV, van, etc. ($)
Mean house or condo value by units in structure - Mobile home ($)
Median contract rent ($)
Median contract rent - Lower quartile ($)
Median contract rent - Upper quartile ($)
Median gross rent ($)
Urban houses (%)
Rural houses (%)
Houses occupied (%)
Houses occupied (% change since 2000)
Houses owner occupied (%)
Houses owner occupied (% change since 2000)
Houses renter occupied (%)
Houses renter occupied (% change since 2000)
Vacant housing units - For rent (%)
Vacant housing units - For rent (% change since 2000)
Vacant housing units - For sale only (%)
Vacant housing units - For sale only (% change since 2000)
Vacant housing units - Rented or sold, not occupied (%)
Vacant housing units - Rented or sold, not occupied (% change since 2000)
Vacant housing units - For seasonal, recreational, or occasional use (%)
Vacant housing units - For seasonal, recreational, or occasional use (% change since 2000)
Vacant housing units - For migrant workers (%)
Vacant housing units - For migrant workers (% change since 2000)
Vacant housing units - Other vacant (%)
Vacant housing units - Other vacant (% change since 2000)
Median monthly housing costs ($)
Median household income for houses/condos with a mortgage ($)
Median household income for houses/condos without a mortgage ($)
Median household income ($)
Median household income ($) - White
Median household income ($) - Black or African American
Median household income ($) - Asian
Median household income ($) - Hispanic or Latino
Median household income ($) - American Indian and Alaska Native
Median household income ($) - Multirace
Median household income ($) - Other Race
Mortgage status - with mortgage (%)
Mortgage status - with second mortgage (%)
Mortgage status - with home equity loan (%)
Mortgage status - with both second mortgage and home equity loan (%)
Mortgage status - without a mortgage (%)
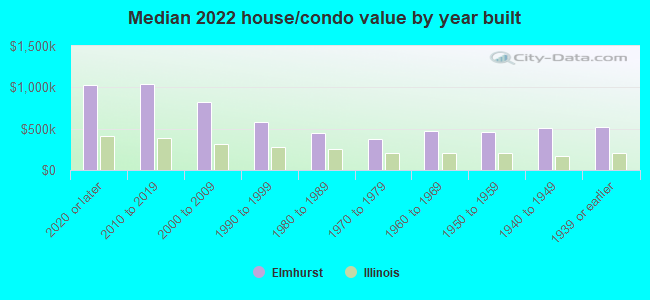
Median year house/condo built
Median year apartment built
Household type by relationship - Male householder living alone (%)
Household type by relationship - Male householder not living alone (%)
Household type by relationship - Female householder living alone (%)
Household type by relationship - Female householder not living alone (%)
Household type by relationship - Opposite-Sex spouse (%)
Household type by relationship - Same-Sex spouse (%)
Household type by relationship - Opposite-Sex unmarried partner (%)
Household type by relationship - Same-Sex unmarried partner (%)
Household type by relationship - In group quarters (%)
Size of family households - 2-person household (%)
Size of family households - 3-person household (%)
Size of family households - 4-person household (%)
Size of family households - 5-person household (%)
Size of family households - 6-person household (%)
Size of family households - 7-or-more-person household (%)
Size of nonfamily households - 1-person household (%)
Size of nonfamily households - 2-person household (%)
Size of nonfamily households - 3-person household (%)
Size of nonfamily households - 4-person household (%)
Size of nonfamily households - 5-person household (%)
Size of nonfamily households - 6-person household (%)
Size of nonfamily households - 7-or-moreperson household (%)
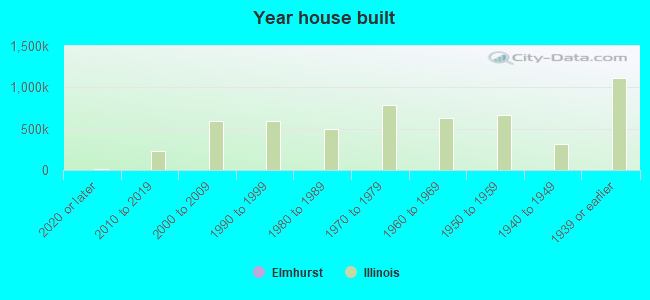
Year house built - Built 2010 or later (%)
Year house built - Built 2000 to 2009 (%)
Year house built - Built 1990 to 1999 (%)
Year house built - Built 1980 to 1989 (%)
Year house built - Built 1970 to 1979 (%)
Year house built - Built 1960 to 1969 (%)
Year house built - Built 1950 to 1959 (%)
Year house built - Built 1940 to 1949 (%)
Year house built - Built 1939 or earlier (%)
Median number of rooms in houses and condos
Median number of rooms in apartments
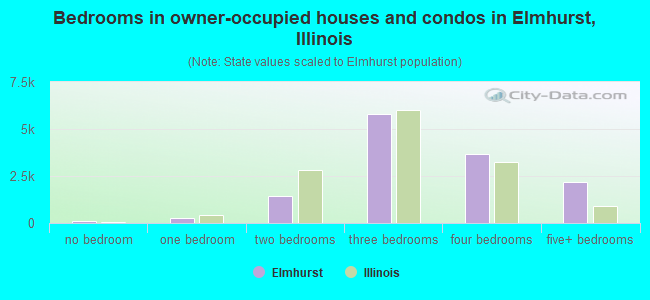
Median number of bedrooms in owner occupied houses
Mean number of bedrooms in owner occupied houses
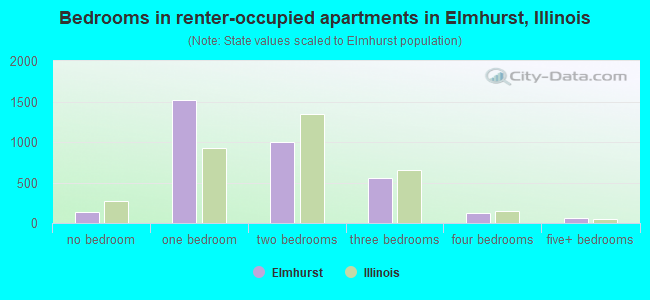
Median number of bedrooms in renter occupied houses
Mean number of bedrooms in renter occupied houses
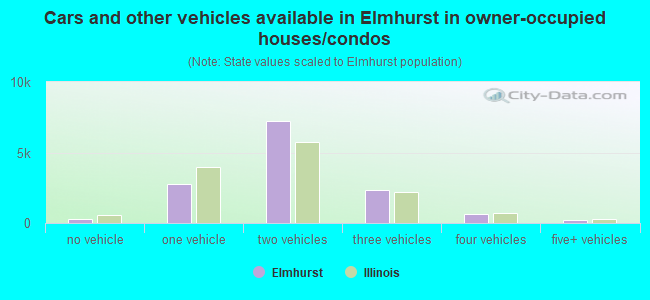
Median number of vehichles in owner occupied houses
Mean number of vehichles in owner occupied houses
Median number of vehichles in renter occupied houses
Mean number of vehichles in renter occupied houses
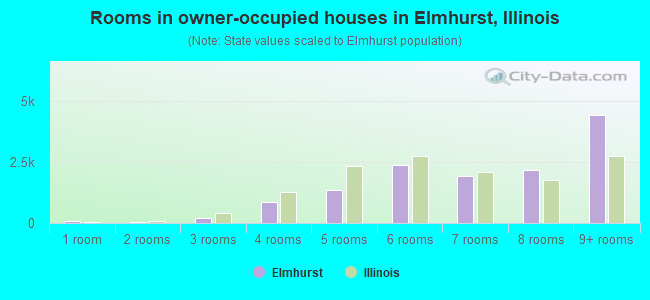
Rooms in owner-occupied houses - 1 room (%)
Rooms in owner-occupied houses - 2 rooms (%)
Rooms in owner-occupied houses - 3 rooms (%)
Rooms in owner-occupied houses - 4 rooms (%)
Rooms in owner-occupied houses - 5 rooms (%)
Rooms in owner-occupied houses - 6 rooms (%)
Rooms in owner-occupied houses - 7 rooms (%)
Rooms in owner-occupied houses - 8 rooms (%)
Rooms in owner-occupied houses - 9+ rooms (%)
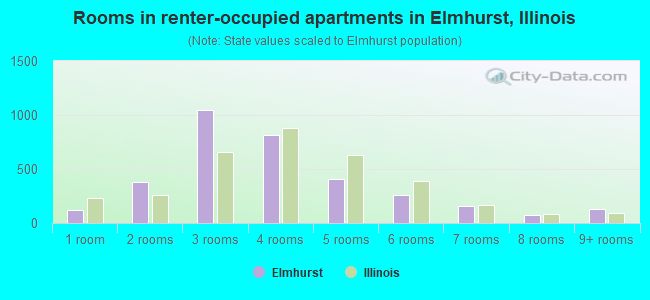
Rooms in renter-occupied houses - 1 room (%)
Rooms in renter-occupied houses - 2 rooms (%)
Rooms in renter-occupied houses - 3 rooms (%)
Rooms in renter-occupied houses - 4 rooms (%)
Rooms in renter-occupied houses - 5 rooms (%)
Rooms in renter-occupied houses - 6 rooms (%)
Rooms in renter-occupied houses - 7 rooms (%)
Rooms in renter-occupied houses - 8 rooms (%)
Rooms in renter-occupied houses - 9+ rooms (%)
Bedrooms in owner-occupied houses - no bedrooms (%)
Bedrooms in owner-occupied houses - 1 bedroom (%)
Bedrooms in owner-occupied houses - 2 bedrooms (%)
Bedrooms in owner-occupied houses - 3 bedrooms (%)
Bedrooms in owner-occupied houses - 4 bedrooms (%)
Bedrooms in owner-occupied houses - 5+ bedrooms (%)
Bedrooms in renter-occupied houses - no bedrooms (%)
Bedrooms in renter-occupied houses - 1 bedroom (%)
Bedrooms in renter-occupied houses - 2 bedrooms (%)
Bedrooms in renter-occupied houses - 3 bedrooms (%)
Bedrooms in renter-occupied houses - 4 bedrooms (%)
Bedrooms in renter-occupied houses - 5+ bedrooms (%)
Vehicles available in owner-occupied houses - no vehicle available (%)
Vehicles available in owner-occupied houses - 1 vehicle available(%)
Vehicles available in owner-occupied houses - 2 Vehicles available (%)
Vehicles available in owner-occupied houses - 3 Vehicles available (%)
Vehicles available in owner-occupied houses - 4 Vehicles available (%)
Vehicles available in owner-occupied houses - 5+ Vehicles available (%)
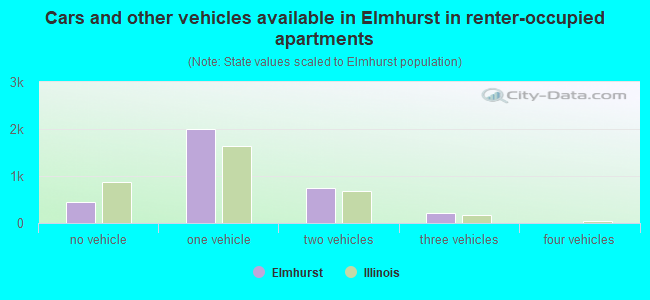
Vehicles available in renter-occupied houses - no vehicle available (%)
Vehicles available in renter-occupied houses - 1 vehicle available (%)
Vehicles available in renter-occupied houses - 2 Vehicles available (%)
Vehicles available in renter-occupied houses - 3 Vehicles available (%)
Vehicles available in renter-occupied houses - 4 Vehicles available (%)
Vehicles available in renter-occupied houses - 5+ Vehicles available (%)
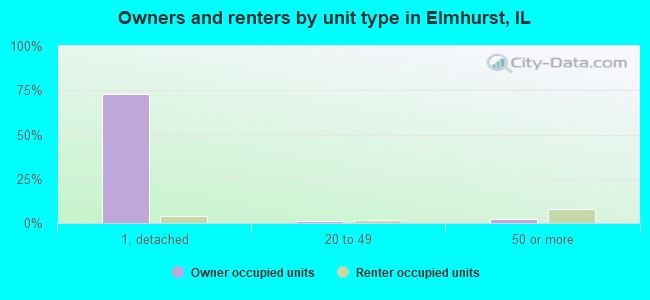
Housing units in structures - 1, detached (%)
Housing units in structures - 1, attached (%)
Housing units in structures - 2 (%)
Housing units in structures - 3 or 4 (%)
Housing units in structures - 5 to 9 (%)
Housing units in structures - 10 to 19 (%)
Housing units in structures - 20 to 49 (%)
Housing units in structures - 50 or more (%)
Housing units in structures - Mobile home (%)
Housing units in structures - Boat, RV, van, etc. (%)
Housing units in structures - Owners - 1, detached (%)
Housing units in structures - Owners - 1, attached (%)
Housing units in structures - Owners - 2 (%)
Housing units in structures - Owners - 3 or 4 (%)
Housing units in structures - Owners - 5 to 9 (%)
Housing units in structures - Owners - 10 to 19 (%)
Housing units in structures - Owners - 20 to 49 (%)
Housing units in structures - Owners - 50 or more (%)
Housing units in structures - Owners - Mobile home (%)
Housing units in structures - Owners - Boat, RV, van, etc. (%)
Housing units in structures - Renters - 1, detached (%)
Housing units in structures - Renters - 1, attached (%)
Housing units in structures - Renters - 2 (%)
Housing units in structures - Renters - 3 or 4 (%)
Housing units in structures - Renters - 5 to 9 (%)
Housing units in structures - Renters - 10 to 19 (%)
Housing units in structures - Renters - 20 to 49 (%)
Housing units in structures - Renters - 50 or more (%)
Housing units in structures - Renters - Mobile home (%)
Housing units in structures - Renters - Boat, RV, van, etc. (%)
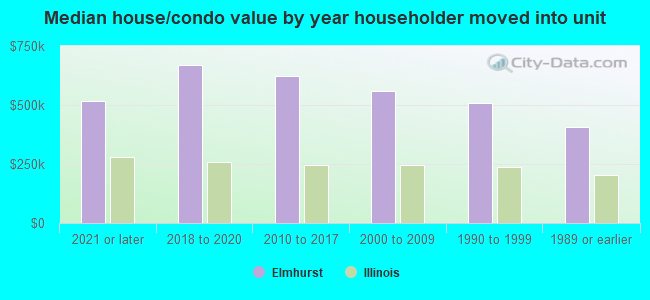
House/condo owner moved in on average (years ago)
Renter moved in on average (years ago)
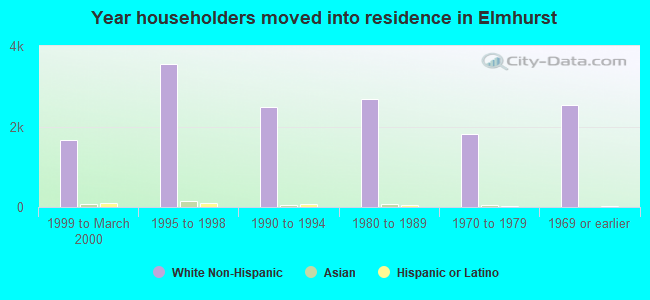
Year householder moved into unit - Moved in 1999 to March 2000 (%)
Year householder moved into unit - Moved in 1999 to March 2000 (%) - White
Year householder moved into unit - Moved in 1999 to March 2000 (%) - Black or African American
Year householder moved into unit - Moved in 1999 to March 2000 (%) - Asian
Year householder moved into unit - Moved in 1999 to March 2000 (%) - Hispanic or Latino
Year householder moved into unit - Moved in 1999 to March 2000 (%) - American Indian and Alaska Native
Year householder moved into unit - Moved in 1999 to March 2000 (%) - Multirace
Year householder moved into unit - Moved in 1999 to March 2000 (%) - Other Race
Year householder moved into unit - Moved in 1995 to 1998 (%)
Year householder moved into unit - Moved in 1995 to 1998 (%) - White
Year householder moved into unit - Moved in 1995 to 1998 (%) - Black or African American
Year householder moved into unit - Moved in 1995 to 1998 (%) - Asian
Year householder moved into unit - Moved in 1995 to 1998 (%) - Hispanic or Latino
Year householder moved into unit - Moved in 1995 to 1998 (%) - American Indian and Alaska Native
Year householder moved into unit - Moved in 1995 to 1998 (%) - Multirace
Year householder moved into unit - Moved in 1995 to 1998 (%) - Other Race
Year householder moved into unit - Moved in 1990 to 1994 (%)
Year householder moved into unit - Moved in 1990 to 1994 (%) - White
Year householder moved into unit - Moved in 1990 to 1994 (%) - Black or African American
Year householder moved into unit - Moved in 1990 to 1994 (%) - Asian
Year householder moved into unit - Moved in 1990 to 1994 (%) - Hispanic or Latino
Year householder moved into unit - Moved in 1990 to 1994 (%) - American Indian and Alaska Native
Year householder moved into unit - Moved in 1990 to 1994 (%) - Multirace
Year householder moved into unit - Moved in 1990 to 1994 (%) - Other Race
Year householder moved into unit - Moved in 1980 to 1989 (%)
Year householder moved into unit - Moved in 1980 to 1989 (%) - White
Year householder moved into unit - Moved in 1980 to 1989 (%) - Black or African American
Year householder moved into unit - Moved in 1980 to 1989 (%) - Asian
Year householder moved into unit - Moved in 1980 to 1989 (%) - Hispanic or Latino
Year householder moved into unit - Moved in 1980 to 1989 (%) - American Indian and Alaska Native
Year householder moved into unit - Moved in 1980 to 1989 (%) - Multirace
Year householder moved into unit - Moved in 1980 to 1989 (%) - Other Race
Year householder moved into unit - Moved in 1970 to 1979 (%)
Year householder moved into unit - Moved in 1970 to 1979 (%) - White
Year householder moved into unit - Moved in 1970 to 1979 (%) - Black or African American
Year householder moved into unit - Moved in 1970 to 1979 (%) - Asian
Year householder moved into unit - Moved in 1970 to 1979 (%) - Hispanic or Latino
Year householder moved into unit - Moved in 1970 to 1979 (%) - American Indian and Alaska Native
Year householder moved into unit - Moved in 1970 to 1979 (%) - Multirace
Year householder moved into unit - Moved in 1970 to 1979 (%) - Other Race
Year householder moved into unit - Moved in 1969 or earlier (%)
Year householder moved into unit - Moved in 1969 or earlier (%) - White
Year householder moved into unit - Moved in 1969 or earlier (%) - Black or African American
Year householder moved into unit - Moved in 1969 or earlier (%) - Asian
Year householder moved into unit - Moved in 1969 or earlier (%) - Hispanic or Latino
Year householder moved into unit - Moved in 1969 or earlier (%) - American Indian and Alaska Native
Year householder moved into unit - Moved in 1969 or earlier (%) - Multirace
Year householder moved into unit - Moved in 1969 or earlier (%) - Other Race
Housing units lacking complete plumbing facilities (%)
Housing units lacking complete kitchen facilities (%)
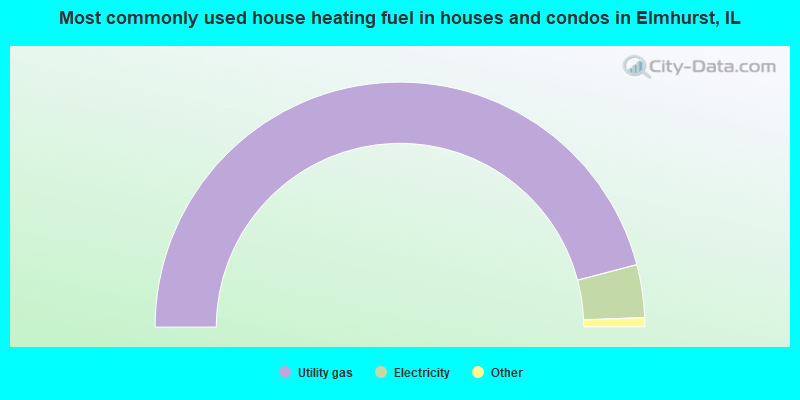
House heating fuel used in houses and condos - Utility gas (%)
House heating fuel used in houses and condos - Bottled, tank, or LP gas (%)
House heating fuel used in houses and condos - Electricity (%)
House heating fuel used in houses and condos - Fuel oil, kerosene, etc. (%)
House heating fuel used in houses and condos - Coal or coke (%)
House heating fuel used in houses and condos - Wood (%)
House heating fuel used in houses and condos - Solar energy (%)
House heating fuel used in houses and condos - Other fuel (%)
House heating fuel used in houses and condos - No fuel used (%)
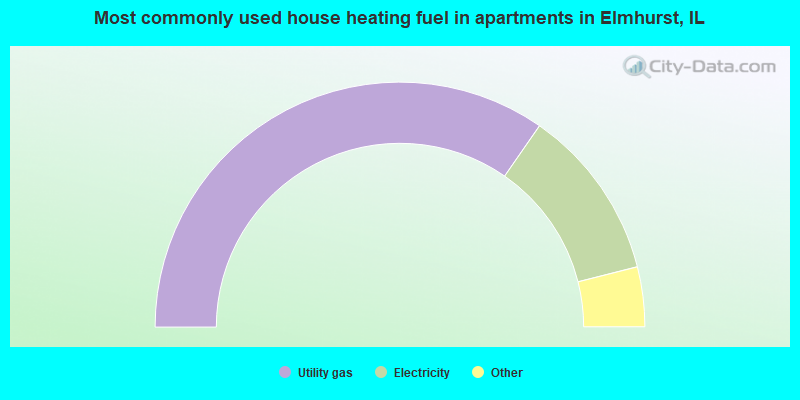
House heating fuel used in apartments - Utility gas (%)
House heating fuel used in apartments - Bottled, tank, or LP gas (%)
House heating fuel used in apartments - Electricity (%)
House heating fuel used in apartments - Fuel oil, kerosene, etc. (%)
House heating fuel used in apartments - Coal or coke (%)
House heating fuel used in apartments - Wood (%)
House heating fuel used in apartments - Solar energy (%)
House heating fuel used in apartments - Other fuel (%)
House heating fuel used in apartments - No fuel used (%)
Latest news about housing in Elmhurst, IL collected exclusively by city-data.com from local newspapers, TV, and radio stations
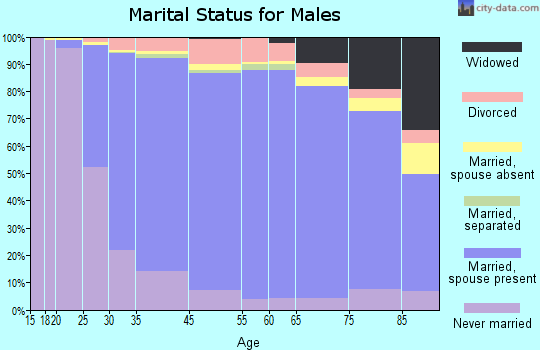
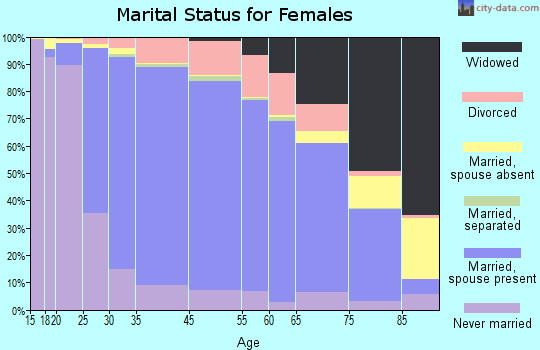
Median year house/condo built: 1961Median year apartment built: 1975Household type by relationship:
Households: 45,174
Male householders: 8,484 (1,525 living alone ), Female householders: 8,087 (2,439 living alone )10,470 spouses (10,449 opposite-sex spouses ), 583 unmarried partners , (561 opposite-sex unmarried partners ), 14,825 children (14,417 natural , 317 adopted , 90 stepchildren ), 370 grandchildren , 136 brothers or sisters , 329 parents , 0 foster children , 73 other relatives , 554 non-relatives In group quarters: 1,259
Size of family households: 4,926 2-persons , 2,618 3-persons , 3,075 4-persons , 1,030 5-persons , 203 6-persons , 142 7-or-more-persons .
Size of nonfamily households: 4,109 1-person , 597 2-persons , 69 3-persons , 4 7-or-more-persons .
9,490 married couples with children. single-parent households (134 men , 979 women ).
83.8% of residents of Elmhurst speak English at home. of residents speak Spanish at home (74% speak English very well , 19% speak English well , 3% speak English not well , 3% don't speak English at all ).of residents speak other Indo-European language at home (83% speak English very well , 10% speak English well , 6% speak English not well ).of residents speak Asian or Pacific Island language at home (72% speak English very well , 20% speak English well , 6% speak English not well , 2% don't speak English at all ).of residents speak other language at home (89% speak English very well , 11% speak English well ).
Foreign born population: 4,743 (10.5%)of them are naturalized citizens )
Median number of rooms in houses and condos:
Median number of rooms in apartments
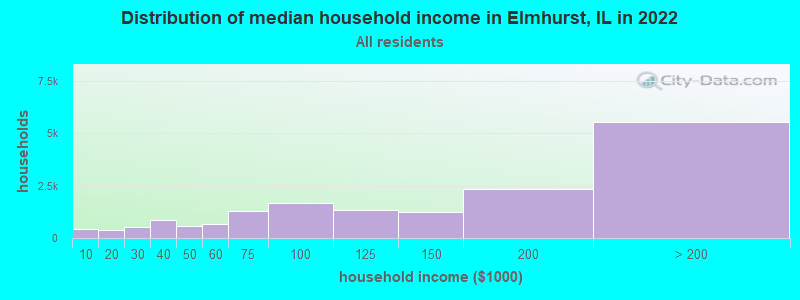
Elmhurst, IL household income distribution 450 Less than $10,000364 $10,000 to $19,999526 $20,000 to $29,999867 $30,000 to $39,999570 $40,000 to $49,999668 $50,000 to $59,9991,276 $60,000 to $74,9991,678 $75,000 to $99,9991,320 $100,000 to $124,9991,218 $125,000 to $149,9992,316 $150,000 to $199,9995,531 $200,000 or more
Home value of owner - occupied houses in 2022 in Elmhurst, IL 54 Less than $10,00015 $20,000 to $24,99911 $30,000 to $34,9997 $40,000 to $49,99939 $50,000 to $59,99916 $80,000 to $89,99936 $90,000 to $99,999111 $100,000 to $124,99948 $125,000 to $149,99989 $150,000 to $174,99991 $175,000 to $199,999485 $200,000 to $249,999501 $250,000 to $299,9992,768 $300,000 to $399,9992,457 $400,000 to $499,9993,497 $500,000 to $749,9992,035 $750,000 to $999,9991,332 $1,000,000 to $1,499,999178 $1,500,000 to $1,999,999140 $2,000,000 or moreRent paid by renters in 2022 in Elmhurst, IL 8 $150 to $19952 $200 to $24926 $250 to $29926 $300 to $349128 $400 to $44957 $650 to $6997 $700 to $74926 $800 to $899169 $900 to $999465 $1,000 to $1,249305 $1,250 to $1,499787 $1,500 to $1,999556 $2,000 to $2,499182 $2,500 to $2,999186 $3,000 to $3,499184 $3,500 or more87 No cash rent
Percentage of workers working in this county: 61.0%Number of people working at home: 5,597 (25.3% of all workers )
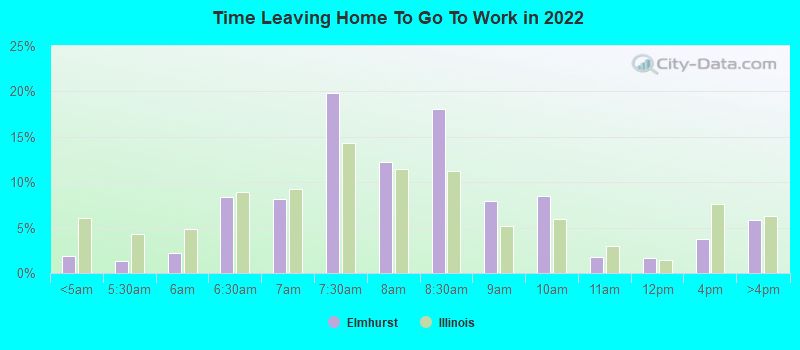
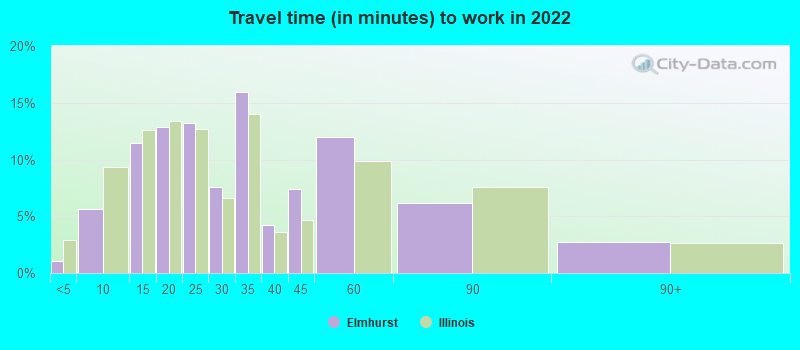
Travel time to work (commute)
Less than 5 minutes: 4405 to 9 minutes: 1,59210 to 14 minutes: 1,88415 to 19 minutes: 2,40320 to 24 minutes: 2,35225 to 29 minutes: 1,22130 to 34 minutes: 2,07835 to 39 minutes: 48440 to 44 minutes: 68945 to 59 minutes: 2,21960 to 89 minutes: 1,16790 or more minutes: 203
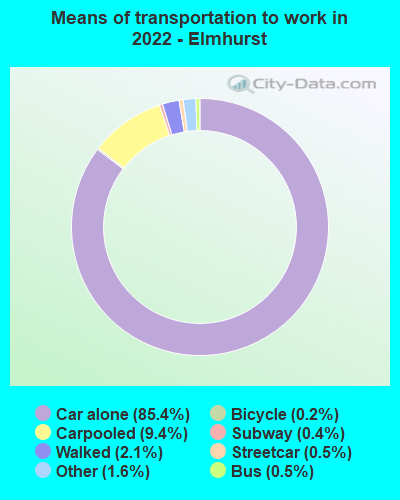
Means of transportation to work:
Drove a car alone: 21,569 (68.8%)Carpooled: 2,913 (9.3%)Bus : 197 (0.6%)Subway or elevated rail : 138 (0.4%)Long-distance train or commuter rail : 101 (0.3%)Taxi: 458 (1.5%)Bicycle: 38 (0.1%)Walked: 492 (1.6%)Worked at home: 5,597 (17.8%)
Unemployment by race in 2022
Unemployment rate for White non-Hispanic residents 3.8% Males3.2% FemalesUnemployment rate for Black residents 35.3% FemalesUnemployment rate for Asian residents 2.9% Males1.3% FemalesUnemployment rate for other race residents 6.2% FemalesUnemployment rate for two or more race residents 0.8% Males8.5% FemalesUnemployment rate for Hispanic or Latino residents 4.1% Males3.4% Females
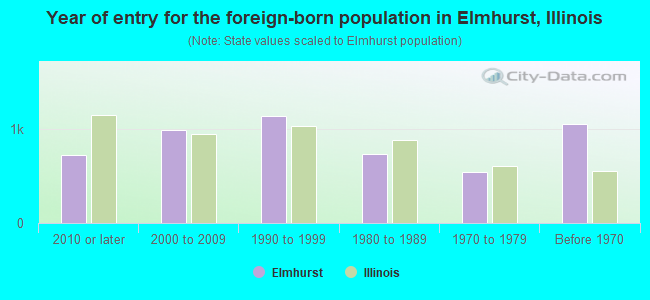
Year of entry for the foreign-born population in Elmhurst, Illinois
721 2010 or later 988 2000 to 2009 1,146 1990 to 1999 738 1980 to 1989 541 1970 to 1979 1,053 Before 1970
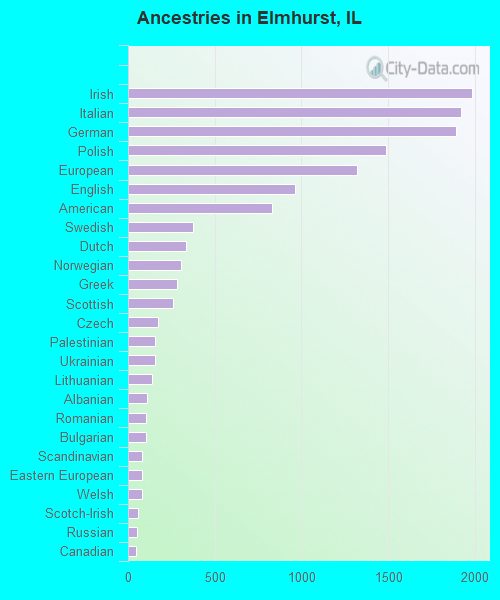
First ancestries reported:
Irish: 1,983 (10.3%)
Italian: 1,920 (10.0%)
German: 1,894 (9.9%)
Polish: 1,490 (7.8%)
European: 1,323 (6.9%)
English: 962 (5.0%)
American: 831 (4.3%)
Swedish: 374 (1.9%)
Dutch: 334 (1.7%)
Norwegian: 304 (1.6%)
Greek: 281 (1.5%)
Scottish: 260 (1.4%)
Czech: 172 (0.9%)
Palestinian: 158 (0.8%)
Ukrainian: 156 (0.8%)
Lithuanian: 140 (0.7%)
Albanian: 110 (0.6%)
Romanian: 106 (0.6%)
Bulgarian: 103 (0.5%)
Scandinavian: 82 (0.4%)
Eastern European: 81 (0.4%)
Welsh: 78 (0.4%)
Scotch-Irish: 56 (0.3%)
Russian: 54 (0.3%)
Canadian: 44 (0.2%)
Iranian: 41 (0.2%)
Hungarian: 38 (0.2%)
Brazilian: 30 (0.2%)
West Indian: 29 (0.2%)
Latvian: 28 (0.1%)
Finnish: 27 (0.1%)
Slovak: 24 (0.1%)
Czechoslovakian: 23 (0.1%)
Croatian: 22 (0.1%)
French: 20 (0.1%)
Belgian: 20 (0.1%)
Austrian: 19 (0.10%)
Lebanese: 18 (0.09%)
Slovene: 16 (0.08%)
Egyptian: 15 (0.08%)
Armenian: 15 (0.08%)
Danish: 13 (0.07%)
British: 12 (0.06%)
Moroccan: 11 (0.06%)
Portuguese: 11 (0.06%)
Northern European: 10 (0.05%)
Jordanian: 9 (0.05%)
French Canadian: 9 (0.05%)
Estonian: 9 (0.05%)
Carpatho Rusyn: 9 (0.05%)
Serbian: 8 (0.04%)
Ethiopian: 6 (0.03%)
Nigerian: 6 (0.03%)
Assyrian: 6 (0.03%)
Turkish: 5 (0.03%)
Yugoslavian: 5 (0.03%)
Most common places of birth for foreign-born residents (%): India Elmhurst:
25.5% (1,214)Illinois:
9.2% (166,409)
Mexico Elmhurst:
12.0% (573)Illinois:
34.7% (626,958)
Poland Elmhurst:
6.5% (308)Illinois:
6.9% (124,474)
Philippines Elmhurst:
4.6% (218)Illinois:
5.2% (93,003)
Italy Elmhurst:
4.1% (197)Illinois:
0.9% (15,679)
China, excluding Hong Kong and Taiwan Elmhurst:
4.1% (197)Illinois:
4.1% (74,364)
Germany Elmhurst:
2.5% (118)Illinois:
1.0% (18,753)
Albania Elmhurst:
2.4% (115)Illinois:
0.4% (6,488)
Brazil Elmhurst:
2.3% (108)Illinois:
0.5% (8,778)
Romania Elmhurst:
2.3% (108)Illinois:
0.8% (14,736)
Canada Elmhurst:
2.0% (96)Illinois:
1.1% (19,306)
Korea Elmhurst:
2.0% (95)Illinois:
2.2% (40,393)
Other Eastern Europe Elmhurst:
2.0% (94)Illinois:
0.5% (9,834)
Bulgaria Elmhurst:
1.8% (87)Illinois:
0.8% (14,165)
Panama Elmhurst:
1.8% (86)Illinois:
0.1% (1,902)
Guatemala Elmhurst:
1.6% (78)Illinois:
1.3% (22,793)
Saudi Arabia Elmhurst:
1.6% (76)Illinois:
0.2% (3,363)
Latvia Elmhurst:
1.5% (72)Illinois:
0.1% (1,568)
Place of birth for U.S.-born residents:
This state: 31,093Other state: 8,911Northeast: 1,644Midwest: 4,465South: 1,791West: 1,014 91.1% of Elmhurst residents lived in the same house 1 years ago.
Out of people who lived in different houses, 29.4% lived in this county.
Out of people who lived in different counties, 73.9% lived in Illinois.
Elmhurst:
91.1%State average:
88.3%
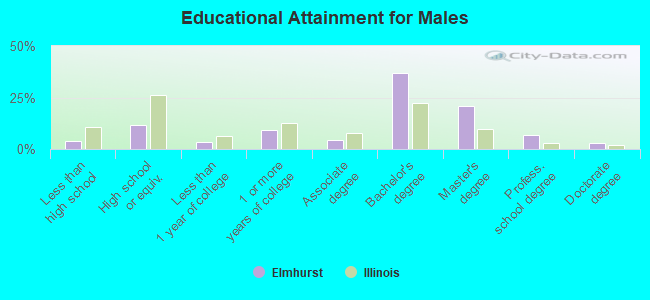
Education attainment for males 25 years and older:
No schooling: 112Nursery to 4th grade: 05th and 6th grade: 47th and 8th grade: 1539th grade: 1410th grade: 18411th grade: 3912th grade, no diploma: 98High school graduate (or equivalency): 1,786Less than 1 year of college: 524Some college more than 1 year, no degree: 1,379Associate degree: 629Bachelor's degree: 5,514Master's degree: 3,171Professional school degree: 1,011Doctorate degree: 417
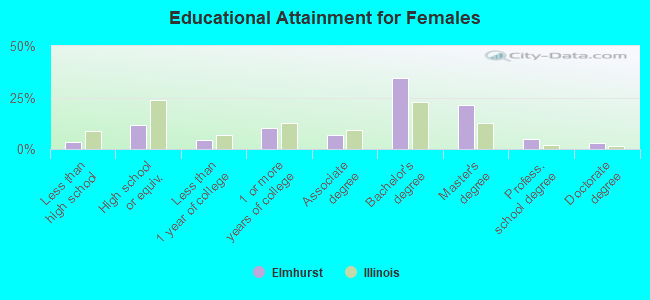
Education attainment for females 25 years and older:
No schooling: 144Nursery to 4th grade: 615th and 6th grade: 587th and 8th grade: 569th grade: 2310th grade: 5911th grade: 6412th grade, no diploma: 77High school graduate (or equivalency): 1,837Less than 1 year of college: 734Some college more than 1 year, no degree: 1,646Associate degree: 1,075Bachelor's degree: 5,468Master's degree: 3,397Professional school degree: 788Doctorate degree: 429
Housing units in structures:
One, detached: 13,148One, attached: 705Two: 1443 or 4: 1385 to 9: 53810 to 19: 25920 to 49: 59950 or more: 2,148Mobile homes: 3Housing units lacking complete plumbing facilities in 2022: 0.2%Housing units lacking complete kitchen facilities in 2022: 0.3%House/condo owner moved in on average 13 years ago
Renter moved in on average 2 years ago
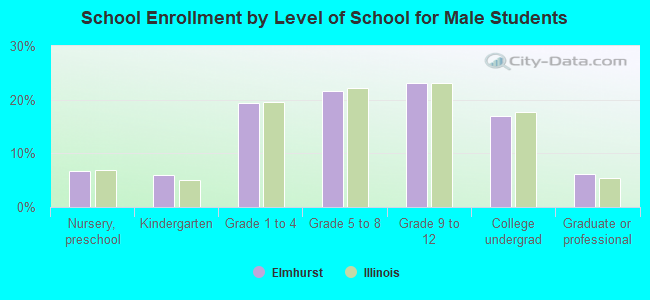
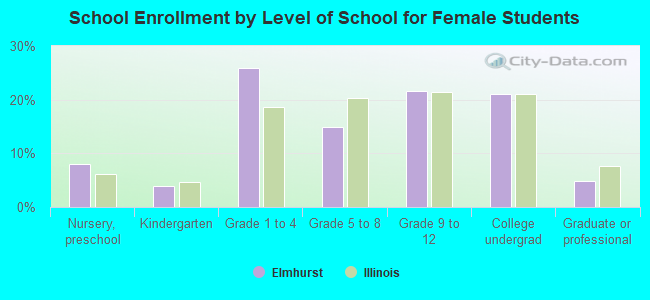
Private vs. public school enrollment:
Students in private schools in grades 1 to 8 (elementary and middle school): 770 Students in private schools in grades 9 to 12 (high school): 238 Students in private undergraduate colleges: 1,362