Ellington, CT (Connecticut) Houses and Residents
| Ellington: | $337,904 |
| Connecticut: | $347,200 |
Total population: 15,602 (Urban population: 9,170, Rural population: 3,751 (33 farm, 3,718 nonfarm))
Houses: 5,417 (5,195 occupied: 3,573 owner occupied, 1,622 renter occupied)
| % of renters here: | 31% |
| State: | 34% |
Housing density: 159 houses/condos per square mile
Median price asked for vacant for-sale houses and condos in 2022 in this county: $251,692.
Median contract rent in 2022: $1,264 (lower quartile is $1,039, upper quartile is $1,645)
Median rent asked for vacant for-rent units in 2022: $1,252
Median gross rent in Ellington, CT in 2022: $1,421
Housing units in Ellington with a mortgage: 2,431 (169 second mortgage, 414 home equity loan, 0 both second mortgage and home equity loan)
Houses without a mortgage: 698
Compare current foreclosures near Ellington, CT:
| Photo | Address | Area | Beds / Baths | Price | Details |
|---|---|---|---|---|---|

|
#1
Webster Rd
Ellington, CT 06029
|
2,744 sq. feet
|
2 baths 3 beds |
show details | |

|
#2
Blueberry Cir
Ellington, CT 06029
|
1,434 sq. feet
|
1 baths 4 beds |
show details | |

|
#3
Pinney St Apt 131
Ellington, CT 06029
|
- sq. feet
|
- baths - beds |
show details | |

|
#4
Walnut St # 3
Ellington, CT 06029
|
- sq. feet
|
- baths - beds |
show details | |

|
#5
Tomoka Ave
Ellington, CT 06029
|
- sq. feet
|
- baths - beds |
show details | |

|
#6
Sanford Ave
Enfield, CT 06082
|
21 sq. feet
|
1 baths 4 beds |
$225,000
|
show details |

|
#7
Mountain Rd
Windsor, CT 06095
|
1,144 sq. feet
|
2 baths 3 beds |
$230,000
|
show details |

|
#8
Walnut Street
Springfield, MA 01105
|
2,850 sq. feet
|
2 baths 6 beds |
$99,900
|
show details |

|
#9
Kozley Rd
Tolland, CT 06084
|
1,132 sq. feet
|
2 baths 3 beds |
$264,900
|
show details |

|
#10
Newberry Rd
South Windsor, CT 06074
|
3,386 sq. feet
|
2 baths 4 beds |
$649,900
|
show details |
| Photo | Address | Area | Beds / Baths | Price | Details |
|---|---|---|---|---|---|

|
#11
Reservoir Rd
Vernon Rockville, CT 06066
|
1,288 sq. feet
|
2 baths 3 beds |
$379,900
|
show details |

|
#12
Irving St
Manchester, CT 06042
|
1,335 sq. feet
|
2 baths 3 beds |
$251,750
|
show details |

|
#13
Jondot Dr
Enfield, CT 06082
|
1,385 sq. feet
|
1 baths 3 beds |
$299,900
|
show details |

|
#14
Tolland Ave
Stafford Springs, CT 06076
|
896 sq. feet
|
1 baths 3 beds |
$100,000
|
show details |

|
#15
Shares Ln
South Windsor, CT 06074
|
1,850 sq. feet
|
2 baths 4 beds |
$365,000
|
show details |

|
#16
Newman St
Springfield, MA 01105
|
1,676 sq. feet
|
2 baths 3 beds |
$45,900
|
show details |

|
#17
Woodland Dr
Hampden, MA 01036
|
972 sq. feet
|
1 baths 3 beds |
show details | |

|
#18
Harvest Ln
Windsor, CT 06095
|
1,322 sq. feet
|
2 baths 3 beds |
show details | |

|
#19
Commonwealth Ave
Springfield, MA 01108
|
1,008 sq. feet
|
1 baths 3 beds |
show details | |

|
#20
Dunn Rd
Longmeadow, MA 01106
|
2,400 sq. feet
|
3 baths 3 beds |
show details |
| Photo | Address | Area | Beds / Baths | Price | Details |
|---|---|---|---|---|---|

|
#21
Saville St
Windsor, CT 06095
|
1,181 sq. feet
|
2 baths 3 beds |
show details | |

|
#22
Holland Dr
East Longmeadow, MA 01028
|
1,424 sq. feet
|
1 baths 2 beds |
show details | |

|
#23
Donahue Ln # 1
Manchester, CT 06042
|
1,240 sq. feet
|
1 baths 2 beds |
show details | |

|
#24
Mathewson Ave
Enfield, CT 06082
|
1,666 sq. feet
|
2 baths 4 beds |
show details | |

|
#25
Summer St
Manchester, CT 06040
|
2,418 sq. feet
|
2 baths 6 beds |
show details | |

|
#26
Greenwood Dr
Manchester, CT 06042
|
750 sq. feet
|
1 baths 2 beds |
show details | |

|
#27
Thompson Rd # 2g
Manchester, CT 06040
|
734 sq. feet
|
1 baths 1 beds |
show details | |

|
#28
Taft St
Springfield, MA 01108
|
1,367 sq. feet
|
1 baths 3 beds |
show details | |

|
#29
Glendale Cir
Windsor Locks, CT 06096
|
1,277 sq. feet
|
1 baths 2 beds |
show details | |

|
#30
Stafford Rd
Monson, MA 01057
|
1,464 sq. feet
|
1 baths 3 beds |
show details |
| Photo | Address | Area | Beds / Baths | Price | Details |
|---|---|---|---|---|---|

|
#31
Belmont Ave
Springfield, MA 01108
|
3,546 sq. feet
|
2 baths 7 beds |
show details | |

|
#32
Hollister Dr
East Hartford, CT 06118
|
1,300 sq. feet
|
1 baths 3 beds |
show details | |

|
#33
Notre Dame St
Springfield, MA 01104
|
1,310 sq. feet
|
2 baths 4 beds |
show details | |

|
#34
Grove St
West Springfield, MA 01089
|
1,566 sq. feet
|
1 baths 3 beds |
show details | |

|
#35
Worthy Ave
West Springfield, MA 01089
|
1,501 sq. feet
|
1 baths 3 beds |
show details | |

|
#36
Cloran St
Springfield, MA 01109
|
1,213 sq. feet
|
1 baths 2 beds |
show details | |

|
#37
Marmon St
Springfield, MA 01129
|
980 sq. feet
|
1 baths 2 beds |
show details | |

|
#38
Cornwall St
Hartford, CT 06112
|
1,248 sq. feet
|
1 baths 3 beds |
show details | |

|
#39
Rosewell St
Springfield, MA 01109
|
1,008 sq. feet
|
1 baths 3 beds |
show details | |

|
#40
237 Ridgefield Stree
Hartford, CT 06112
|
- sq. feet
|
3 baths 6 beds |
show details |
| Photo | Address | Area | Beds / Baths | Price | Details |
|---|---|---|---|---|---|

|
#41
Wellington St
Springfield, MA 01109
|
3,075 sq. feet
|
3 baths 6 beds |
show details | |

|
#42
Fairmount St
Springfield, MA 01108
|
1,620 sq. feet
|
1 baths 5 beds |
show details | |

|
#43
Westford Ave
Springfield, MA 01109
|
3,358 sq. feet
|
2 baths 6 beds |
show details | |

|
#44
Silver St
Agawam, MA 01001
|
1,262 sq. feet
|
1 baths 3 beds |
show details | |

|
#45
Cherokee Dr
Springfield, MA 01109
|
966 sq. feet
|
1 baths 3 beds |
show details | |

|
#46
Malden St
Springfield, MA 01108
|
1,154 sq. feet
|
1 baths 2 beds |
show details | |

|
#47
Derryfield Ave
Springfield, MA 01118
|
1,188 sq. feet
|
1 baths 3 beds |
show details | |

|
#48
Acrebrook Rd
Springfield, MA 01129
|
2,246 sq. feet
|
2 baths 4 beds |
show details | |

|
#49
Parents Way
Bloomfield, CT 06002
|
1,230 sq. feet
|
3 baths 4 beds |
show details | |

|
Check over 1 million property listings on Foreclosure.com!
|
browse all offers | |||
Latest news about housing in Ellington, CT collected exclusively by city-data.com from local newspapers, TV, and radio stations

 | Looking for Indian community apartment or town homes to buy in east windsor (3 replies) |
| Connecticut TOWN TOURNAMENT V (2022) (831 replies) |
| Desegregate Connecticut---Raised CT Zoning Bill (2519 replies) |
| Opinions of Rentability of Home in Ellington area (2 replies) |
| Crumbling Foundations (98 replies) |
| Need a home to rent ASAP north eastern part of ct (0 replies) |

Household type by relationship:
Households: 136,574- In family households: 112,649 (26,574 male householders, 10,133 female householders)
29,922 spouses, 38,844 children (36,460 natural, 1,015 adopted, 1,369 stepchildren), 1,606 grandchildren, 688 brothers or sisters, 931 parents, foster children, 693 other relatives, 2,519 non-relatives
- In nonfamily households: 23,925 (8,485 male householders (5,980 living alone)), 9,285 female householders (7,198 living alone)), 6,155 nonrelatives
- In group quarters: 16,117 (4,028 institutionalized population)
24,754 married couples with children.
5,247 single-parent households (1,309 men, 3,938 women).
93.5% of residents of Ellington speak English at home.
1.6% of residents speak Spanish at home (75% speak English very well, 17% speak English well, 4% speak English not well, 4% don't speak English at all).
4.2% of residents speak other Indo-European language at home (77% speak English very well, 17% speak English well, 6% speak English not well).
0.5% of residents speak Asian or Pacific Island language at home (23% speak English very well, 39% speak English well, 39% speak English not well).
0.1% of residents speak other language at home (100% speak English very well).
Foreign born population: 729 (5.2%)
(73.1% of them are naturalized citizens)
| Here: | 6.6 |
| State: | 6.5 |
| Here: | 3.1 |
| State: | 4.0 |

- Bedrooms in owner-occupied houses and condos in Ellington, Connecticut
- 0no bedroom
- 2311 bedroom
- 5262 bedrooms
- 1,6293 bedrooms
- 1,0594 bedrooms
- 1285+ bedrooms

- Bedrooms in renter-occupied apartments in Ellington, Connecticut
- 54no bedroom
- 9511 bedroom
- 4652 bedrooms
- 1223 bedrooms
- 304 bedrooms
- 05+ bedrooms

- Cars and other vehicles available in Ellington in owner-occupied houses/condos
- 90no vehicle
- 6421 vehicle
- 1,8402 vehicles
- 6913 vehicles
- 2054 vehicles
- 1055+ vehicles

- Cars and other vehicles available in Ellington in renter-occupied apartments
- 74no vehicle
- 8781 vehicle
- 5392 vehicles
- 1083 vehicles
- 184 vehicles
- 55+ vehicles

- Rooms in owner-occupied houses in Ellington, Connecticut
- 01 room
- 232 rooms
- 1043 rooms
- 1904 rooms
- 5765 rooms
- 7446 rooms
- 7957 rooms
- 7428 rooms
- 3999+ rooms

- Rooms in renter-occupied apartments in Ellington, Connecticut
- 451 room
- 1892 rooms
- 6153 rooms
- 3634 rooms
- 2655 rooms
- 946 rooms
- 267 rooms
- 08 rooms
- 259+ rooms


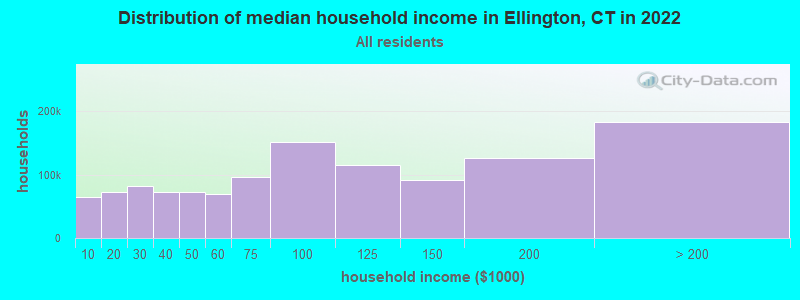
Ellington, CT household income distribution

- 61,893Less than $10,000
- 70,528$10,000 to $19,999
- 79,016$20,000 to $29,999
- 69,753$30,000 to $39,999
- 70,006$40,000 to $49,999
- 67,933$50,000 to $59,999
- 93,187$60,000 to $74,999
- 146,383$75,000 to $99,999
- 112,127$100,000 to $124,999
- 89,469$125,000 to $149,999
- 121,811$150,000 to $199,999
- 177,990$200,000 or more
Percentage of workers working in this county: 32.9%
Number of people working at home: 1,333 (16.3% of all workers)
Travel time to work (commute)
- Less than 5 minutes: 130
- 5 to 9 minutes: 620
- 10 to 14 minutes: 838
- 15 to 19 minutes: 780
- 20 to 24 minutes: 1,087
- 25 to 29 minutes: 914
- 30 to 34 minutes: 1,315
- 35 to 39 minutes: 339
- 40 to 44 minutes: 303
- 45 to 59 minutes: 436
- 60 to 89 minutes: 243
- 90 or more minutes: 146
Means of transportation to work:
- Drove a car alone: 6,539 (89.7%)
- Carpooled: 472 (6.5%)
- Bus or trolley bus: 71 (1.0%)
- Taxi: 6 (0.1%)
- Bicycle: 18 (0.2%)
- Walked: 45 (0.6%)
- Worked at home: 140 (1.9%)


- Year of entry for the foreign-born population in Ellington, Connecticut
- 731995 to March 2000
- 721990 to 1994
- 821985 to 1989
- 361980 to 1984
- 331975 to 1979
- 271970 to 1974
- 521965 to 1969
- 92Before 1965

First ancestries reported:
- Irish: 2,719 (16.1%)
- German: 2,052 (12.2%)
- Italian: 1,980 (11.7%)
- French: 1,812 (10.7%)
- English: 1,611 (9.6%)
- Polish: 1,524 (9.0%)
- Other: 1,189 (7.0%)
- French Canadian: 585 (3.5%)
- United States: 533 (3.2%)
- Swiss: 517 (3.1%)
- Swedish: 406 (2.4%)
- Lithuanian: 289 (1.7%)
- Scottish: 280 (1.7%)
- Russian: 207 (1.2%)
- Scotch-Irish: 164 (1.0%)
- Greek: 159 (0.9%)
- Hungarian: 136 (0.8%)
- Danish: 121 (0.7%)
- Welsh: 98 (0.6%)
- Portuguese: 82 (0.5%)
- Arab: 81 (0.5%)
- Slovak: 81 (0.5%)
- Czech: 68 (0.4%)
- Norwegian: 50 (0.3%)
- Dutch: 48 (0.3%)
- Ukrainian: 42 (0.2%)
- Subsaharan African: 24 (0.1%)
- West Indian: 8 (0.05%)
Most common places of birth for foreign-born residents (%):
| Ellington: | 17.8% (83) |
| Connecticut: | 5.2% (19,083) |
| Ellington: | 11.8% (55) |
| Connecticut: | 6.9% (25,507) |
| Ellington: | 8.8% (41) |
| Connecticut: | 1.7% (6,247) |
| Ellington: | 7.3% (34) |
| Connecticut: | 3.1% (11,432) |
| Ellington: | 4.5% (21) |
| Connecticut: | 1.5% (5,508) |
| Ellington: | 4.3% (20) |
| Connecticut: | 0.3% (1,242) |
| Ellington: | 3.6% (17) |
| Connecticut: | 1.4% (5,021) |
| Ellington: | 3.6% (17) |
| Connecticut: | 0.3% (1,213) |
| Ellington: | 3.2% (15) |
| Connecticut: | 4.4% (16,395) |
| Ellington: | 3.0% (14) |
| Connecticut: | 0.9% (3,472) |
| Ellington: | 3.0% (14) |
| Connecticut: | 4.1% (15,108) |
| Ellington: | 2.8% (13) |
| Connecticut: | 0.3% (1,224) |
| Ellington: | 2.6% (12) |
| Connecticut: | 0.6% (2,106) |
| Ellington: | 2.4% (11) |
| Connecticut: | 0.4% (1,503) |
| Ellington: | 1.9% (9) |
| Connecticut: | 7.0% (26,023) |
| Ellington: | 1.9% (9) |
| Connecticut: | 1.8% (6,680) |
| Ellington: | 1.7% (8) |
| Connecticut: | 0.5% (1,983) |
| Ellington: | 1.7% (8) |
| Connecticut: | 0.3% (1,110) |
| Ellington: | 1.7% (8) |
| Connecticut: | 3.6% (13,282) |
Place of birth for U.S.-born residents:
- This state: 8,612
- Other state: 3,744
- Northeast: 2,741
- Midwest: 441
- South: 365
- West: 197
61% of Ellington residents lived in the same house 5 years ago.
Out of people who lived in different houses, 42% lived in this county.
Out of people who lived in different counties, 65% lived in Connecticut.
Education attainment for males 25 years and older:
- No schooling: 24
- Nursery to 4th grade: 0
- 5th and 6th grade: 33
- 7th and 8th grade: 64
- 9th grade: 65
- 10th grade: 58
- 11th grade: 32
- 12th grade, no diploma: 124
- High school graduate (or equivalency): 1,230
- Less than 1 year of college: 283
- Some college more than 1 year, no degree: 563
- Associate degree: 429
- Bachelor's degree: 935
- Master's degree: 366
- Professional school degree: 87
- Doctorate degree: 38

Education attainment for females 25 years and older:
- No schooling: 17
- Nursery to 4th grade: 0
- 5th and 6th grade: 11
- 7th and 8th grade: 51
- 9th grade: 31
- 10th grade: 63
- 11th grade: 43
- 12th grade, no diploma: 104
- High school graduate (or equivalency): 1,351
- Less than 1 year of college: 348
- Some college more than 1 year, no degree: 524
- Associate degree: 526
- Bachelor's degree: 838
- Master's degree: 409
- Professional school degree: 149
- Doctorate degree: 0


Housing units in structures:
- One, detached: 3,504
- One, attached: 172
- Two: 191
- 3 or 4: 310
- 5 to 9: 566
- 10 to 19: 452
- 20 to 49: 136
- 50 or more: 69
- Mobile homes: 17
Median worth of mobile homes: $526,180
Housing units lacking complete kitchen facilities: 0.5%

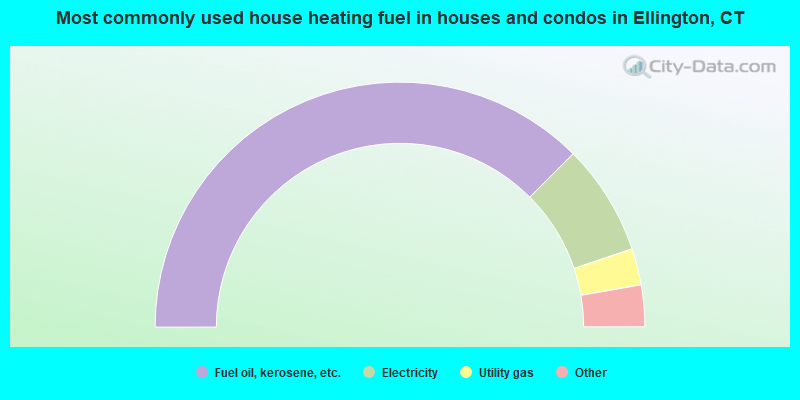
- 75.0%Fuel oil, kerosene, etc.
- 14.7%Electricity
- 4.8%Utility gas
- 2.5%Bottled, tank, or LP gas
- 2.1%Wood
- 0.6%Other fuel
- 0.3%Coal or coke
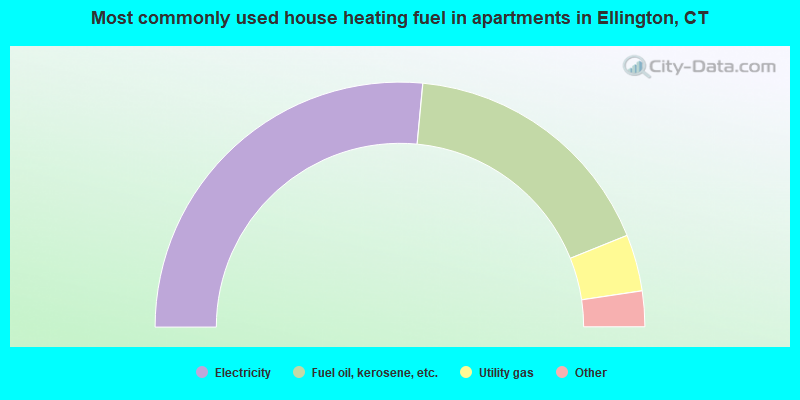
- 53.0%Electricity
- 34.8%Fuel oil, kerosene, etc.
- 7.5%Utility gas
- 3.8%Bottled, tank, or LP gas
- 1.0%Other fuel
Private vs. public school enrollment:
| Here: | 4.9% |
| Connecticut: | 9.9% |
| Here: | 4.2% |
| Connecticut: | 11.0% |
| Here: | 18.9% |
| Connecticut: | 33.4% |


