Elk Valley, TN (Tennessee) Houses and Residents
| Elk Valley: | $110,300 |
| Tennessee: | $284,800 |
Total population: 4,649 (Urban population: 0, Rural population: 4,569 (40 farm, 4,529 nonfarm))
Houses: 2,019 (1,851 occupied: 1,341 owner occupied, 510 renter occupied)
| % of renters here: | 28% |
| State: | 33% |
Housing density: 29 houses/condos per square mile
Median price asked for vacant for-sale houses and condos in 2022 in this county: $157,395.
Median contract rent in 2022: $375 (lower quartile is $256, upper quartile is $503)
Median rent asked for vacant for-rent units in 2022: $462
Median gross rent in Elk Valley, TN in 2022: $534
Housing units in Elk Valley with a mortgage: 295 (25 second mortgage, 25 home equity loan, 0 both second mortgage and home equity loan)
Houses without a mortgage: 505


Household type by relationship:
Households: 40,197- In family households: 34,467 (8,063 male householders, 3,375 female householders)
8,438 spouses, 10,708 children (9,645 natural, 354 adopted, 709 stepchildren), 1,414 grandchildren, 367 brothers or sisters, 303 parents, foster children, 501 other relatives, 1,015 non-relatives
- In nonfamily households: 5,730 (2,265 male householders (1,870 living alone)), 2,651 female householders (2,390 living alone)), 814 nonrelatives
- In group quarters: 519 (492 institutionalized population)
6,046 married couples with children.
2,080 single-parent households (427 men, 1,653 women).
98.4% of residents of Elk Valley speak English at home.
0.3% of residents speak Spanish at home (50% speak English very well, 50% speak English not well).
1.2% of residents speak other Indo-European language at home (85% speak English very well, 15% speak English well).
Foreign born population: 65 (1.2%)
(81.5% of them are naturalized citizens)
| Here: | 6.3 |
| State: | 6.5 |
| Here: | 4.9 |
| State: | 4.4 |

- Bedrooms in owner-occupied houses and condos in Elk Valley, Tennessee
- 6no bedroom
- 611 bedroom
- 4992 bedrooms
- 6633 bedrooms
- 954 bedrooms
- 175+ bedrooms

- Bedrooms in renter-occupied apartments in Elk Valley, Tennessee
- 4no bedroom
- 1501 bedroom
- 1792 bedrooms
- 1243 bedrooms
- 424 bedrooms
- 115+ bedrooms

- Cars and other vehicles available in Elk Valley in owner-occupied houses/condos
- 120no vehicle
- 4781 vehicle
- 5142 vehicles
- 1533 vehicles
- 614 vehicles
- 155+ vehicles

- Cars and other vehicles available in Elk Valley in renter-occupied apartments
- 176no vehicle
- 2021 vehicle
- 1032 vehicles
- 223 vehicles
- 74 vehicles
- 05+ vehicles

- Rooms in owner-occupied houses in Elk Valley, Tennessee
- 61 room
- 82 rooms
- 273 rooms
- 2814 rooms
- 4865 rooms
- 2776 rooms
- 1687 rooms
- 448 rooms
- 449+ rooms

- Rooms in renter-occupied apartments in Elk Valley, Tennessee
- 41 room
- 462 rooms
- 933 rooms
- 1294 rooms
- 975 rooms
- 906 rooms
- 357 rooms
- 38 rooms
- 139+ rooms


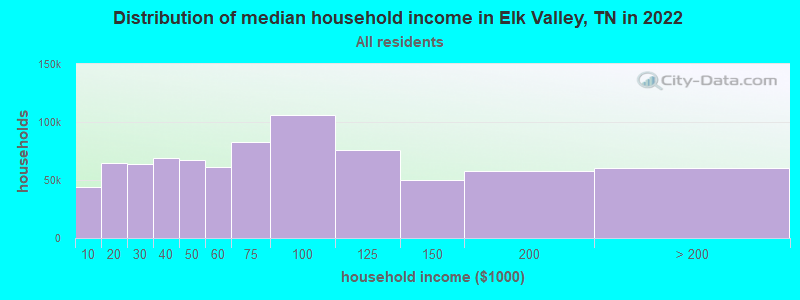
Elk Valley, TN household income distribution

- 28,877Less than $10,000
- 48,435$10,000 to $19,999
- 45,935$20,000 to $29,999
- 46,966$30,000 to $39,999
- 45,410$40,000 to $49,999
- 42,030$50,000 to $59,999
- 57,304$60,000 to $74,999
- 73,041$75,000 to $99,999
- 54,626$100,000 to $124,999
- 32,538$125,000 to $149,999
- 35,713$150,000 to $199,999
- 30,190$200,000 or more
Percentage of workers working in this county: 60.4%
Number of people working at home: 174 (9.8% of all workers)
Travel time to work (commute)
- Less than 5 minutes: 149
- 5 to 9 minutes: 289
- 10 to 14 minutes: 222
- 15 to 19 minutes: 121
- 20 to 24 minutes: 115
- 25 to 29 minutes: 31
- 30 to 34 minutes: 128
- 35 to 39 minutes: 43
- 40 to 44 minutes: 65
- 45 to 59 minutes: 179
- 60 to 89 minutes: 172
- 90 or more minutes: 46
Means of transportation to work:
- Drove a car alone: 1,218 (76.7%)
- Carpooled: 284 (17.9%)
- Walked: 17 (1.1%)
- Other means: 41 (2.6%)
- Worked at home: 27 (1.7%)


- Year of entry for the foreign-born population in Elk Valley, Tennessee
- 61995 to March 2000
- 161990 to 1994
- 01985 to 1989
- 01980 to 1984
- 101975 to 1979
- 01970 to 1974
- 01965 to 1969
- 0Before 1965
Most common places of birth for foreign-born residents (%):
| Elk Valley: | 50.0% (16) |
| Tennessee: | 0.3% (404) |
| Elk Valley: | 25.0% (8) |
| Tennessee: | 4.8% (7,701) |
| Elk Valley: | 18.8% (6) |
| Tennessee: | 4.4% (6,981) |
| Elk Valley: | 6.2% (2) |
| Tennessee: | 0.2% (295) |
Place of birth for U.S.-born residents:
- This state: 3,122
- Other state: 1,409
- Northeast: 24
- Midwest: 445
- South: 911
- West: 29
65% of Elk Valley residents lived in the same house 5 years ago.
Out of people who lived in different houses, 53% lived in this county.
Out of people who lived in different counties, 22% lived in Tennessee.
Education attainment for males 25 years and older:
- No schooling: 66
- Nursery to 4th grade: 79
- 5th and 6th grade: 58
- 7th and 8th grade: 165
- 9th grade: 77
- 10th grade: 66
- 11th grade: 81
- 12th grade, no diploma: 70
- High school graduate (or equivalency): 509
- Less than 1 year of college: 42
- Some college more than 1 year, no degree: 79
- Associate degree: 10
- Bachelor's degree: 54
- Master's degree: 45
- Professional school degree: 23
- Doctorate degree: 4

Education attainment for females 25 years and older:
- No schooling: 67
- Nursery to 4th grade: 74
- 5th and 6th grade: 74
- 7th and 8th grade: 236
- 9th grade: 80
- 10th grade: 97
- 11th grade: 73
- 12th grade, no diploma: 59
- High school graduate (or equivalency): 607
- Less than 1 year of college: 54
- Some college more than 1 year, no degree: 122
- Associate degree: 46
- Bachelor's degree: 56
- Master's degree: 52
- Professional school degree: 11
- Doctorate degree: 0


Housing units in structures:
- One, detached: 1,140
- One, attached: 16
- Two: 79
- 3 or 4: 37
- 5 to 9: 9
- 10 to 19: 19
- 20 to 49: 34
- 50 or more: 74
- Mobile homes: 611
Median worth of mobile homes: $46,233
Housing units lacking complete kitchen facilities: 1.0%

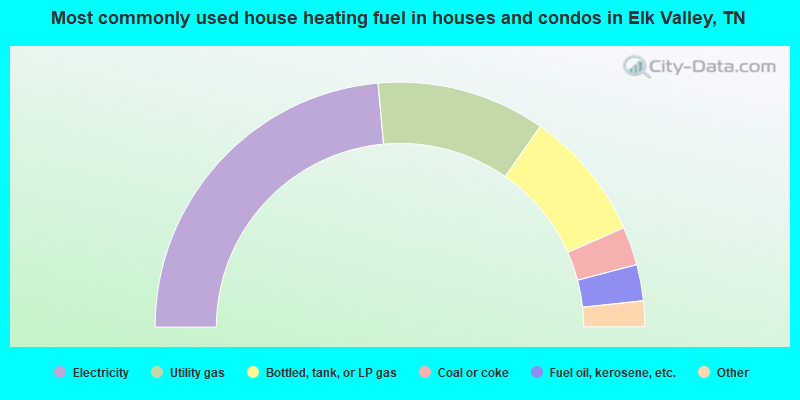
- 47.2%Electricity
- 22.3%Utility gas
- 17.3%Bottled, tank, or LP gas
- 5.1%Coal or coke
- 4.8%Fuel oil, kerosene, etc.
- 2.9%Wood
- 0.4%No fuel used
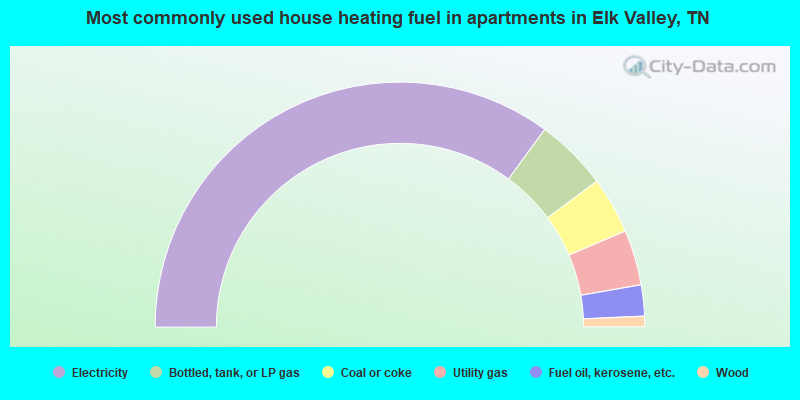
- 70.2%Electricity
- 9.6%Bottled, tank, or LP gas
- 7.5%Coal or coke
- 7.3%Utility gas
- 4.1%Fuel oil, kerosene, etc.
- 1.4%Wood
Private vs. public school enrollment:
| Here: | 2.9% |
| Tennessee: | 9.5% |
| Here: | 2.2% |
| Tennessee: | 10.4% |
| Here: | 52.6% |
| Tennessee: | 22.8% |


