El Sobrante, CA (California) Houses and Residents
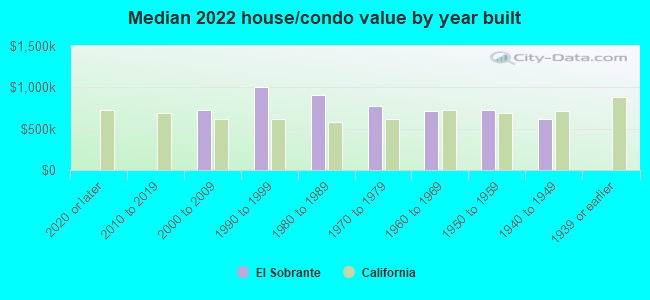
| El Sobrante: | $752,310 |
| California: | $715,900 |
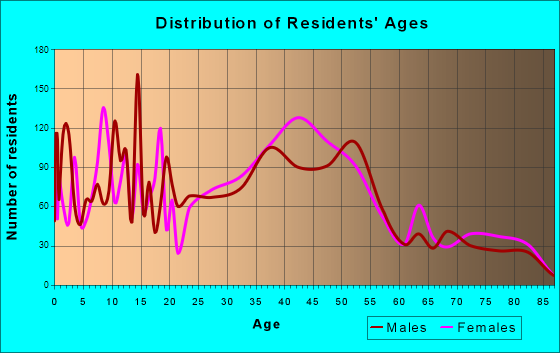
Total population: 12,669 (Urban population: 11,605, Rural population: 0)
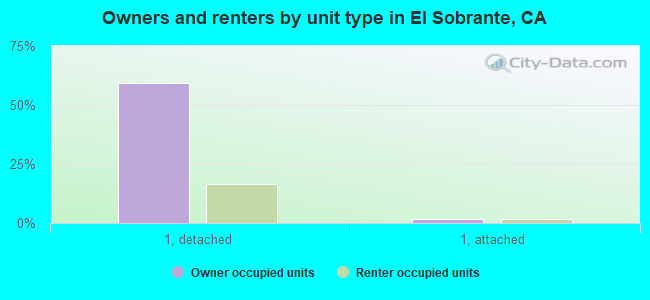
Houses: 5,830 (5,507 occupied: 3,454 owner occupied, 2,065 renter occupied)
| % of renters here: | 37% |
| State: | 44% |
Housing density: 1,880 houses/condos per square mile
Median price asked for vacant for-sale houses and condos in 2022: $929,689.
Median contract rent in 2022: $1,751 (lower quartile is $1,505, upper quartile is over $2,000)
Median rent asked for vacant for-rent units in 2022: $2,041
Median gross rent in El Sobrante, CA in 2022: over $2,000
Housing units in El Sobrante with a mortgage: 2,358 (333 second mortgage, 0 home equity loan, 268 both second mortgage and home equity loan)
Houses without a mortgage: 24
Median household income for houses/condos with a mortgage: $127,423
Median household income for apartments without a mortgage: $111,635
Median monthly housing costs: $1,999
Compare current foreclosures in El Sobrante, CA:
| Photo | Address | Area | Beds / Baths | Price | Details |
|---|---|---|---|---|---|

|
#1
Rancho Rd
El Sobrante, CA 94803
|
1,644 sq. feet
|
2 baths 4 beds |
show details | |

|
#2
Rain Cloud Dr
El Sobrante, CA 94803
|
2,235 sq. feet
|
3 baths 4 beds |
show details | |

|
#3
Heide Ct
El Sobrante, CA 94803
|
4,151 sq. feet
|
3 baths 5 beds |
show details | |

|
#4
Harmon Rd
El Sobrante, CA 94803
|
1,031 sq. feet
|
1 baths 3 beds |
show details | |

|
#5
Raton Ct
El Sobrante, CA 94803
|
1,138 sq. feet
|
1 baths 3 beds |
show details | |

|
#6
Fran Way
El Sobrante, CA 94803
|
1,962 sq. feet
|
2 baths 3 beds |
show details | |

|
#7
Thunderhead Ct
El Sobrante, CA 94803
|
1,936 sq. feet
|
2 baths 4 beds |
show details | |

|
#8
Surrey Ln
El Sobrante, CA 94803
|
2,362 sq. feet
|
3 baths 4 beds |
show details | |

|
#9
Kelvin Rd
El Sobrante, CA 94803
|
1,249 sq. feet
|
2 baths 2 beds |
show details | |

|
#10
Parkside Dr
El Sobrante, CA 94803
|
1,421 sq. feet
|
2 baths 3 beds |
show details |
| Photo | Address | Area | Beds / Baths | Price | Details |
|---|---|---|---|---|---|

|
#11
Sunset Dr
El Sobrante, CA 94803
|
2,044 sq. feet
|
3 baths 4 beds |
show details | |

|
#12
Rincon Rd
El Sobrante, CA 94803
|
980 sq. feet
|
1 baths 3 beds |
show details | |

|
#13
Santa Rita Rd
El Sobrante, CA 94803
|
1,101 sq. feet
|
2 baths 3 beds |
show details | |

|
#14
Pebble Dr
El Sobrante, CA 94803
|
1,392 sq. feet
|
2 baths 3 beds |
show details | |

|
#15
Hilltop Dr
El Sobrante, CA 94803
|
2,464 sq. feet
|
2 baths 4 beds |
show details | |

|
#16
Saddleback Ct
El Sobrante, CA 94803
|
2,498 sq. feet
|
2 baths 4 beds |
show details | |

|
#17
Orion Ct
El Sobrante, CA 94803
|
3,228 sq. feet
|
3 baths 5 beds |
show details | |

|
#18
Del Valle Cir
El Sobrante, CA 94803
|
1,022 sq. feet
|
1 baths 2 beds |
show details | |

|
#19
Rain Cloud Dr
El Sobrante, CA 94803
|
2,235 sq. feet
|
3 baths 4 beds |
show details | |

|
#20
Keith Dr
El Sobrante, CA 94803
|
1,634 sq. feet
|
2 baths 4 beds |
show details |
| Photo | Address | Area | Beds / Baths | Price | Details |
|---|---|---|---|---|---|

|
#21
Ridgeview Cir Unit 6
El Sobrante, CA 94803
|
611 sq. feet
|
1 baths 1 beds |
show details | |

|
#22
Longhorn Ct
El Sobrante, CA 94803
|
1,656 sq. feet
|
2 baths 4 beds |
show details | |

|
#23
Bridgeway Cir
El Sobrante, CA 94803
|
2,721 sq. feet
|
3 baths 5 beds |
show details | |

|
#24
Santa Maria Rd
El Sobrante, CA 94803
|
1,519 sq. feet
|
1 baths 2 beds |
show details | |

|
#25
Harmon Rd
El Sobrante, CA 94803
|
1,031 sq. feet
|
1 baths 3 beds |
show details | |

|
#26
Garden Ln
El Sobrante, CA 94803
|
1,978 sq. feet
|
2 baths 4 beds |
show details | |

|
#27
Via Verdi
El Sobrante, CA 94803
|
815 sq. feet
|
1 baths 1 beds |
show details | |

|
#28
Fran Way
El Sobrante, CA 94803
|
1,297 sq. feet
|
2 baths 3 beds |
show details | |

|
#29
Santa Rita Rd
El Sobrante, CA 94803
|
1,435 sq. feet
|
2 baths 3 beds |
show details | |

|
#30
Appian Way # 10
El Sobrante, CA 94803
|
- sq. feet
|
- baths - beds |
show details |
| Photo | Address | Area | Beds / Baths | Price | Details |
|---|---|---|---|---|---|

|
#31
El Centro Rd
El Sobrante, CA 94803
|
- sq. feet
|
- baths - beds |
show details | |

|
#32
San Pablo Dam Rd
El Sobrante, CA 94803
|
- sq. feet
|
- baths - beds |
show details | |

|
#33
Heide Ct
El Sobrante, CA 94803
|
- sq. feet
|
- baths - beds |
show details | |

|
#34
Appian Way, Trlr 19
El Sobrante, CA 94803
|
- sq. feet
|
- baths - beds |
show details | |

|
#35
Santa Rita Rd
El Sobrante, CA 94803
|
- sq. feet
|
- baths - beds |
show details | |

|
#36
Parkridge Dr
El Sobrante, CA 94803
|
- sq. feet
|
- baths - beds |
show details | |

|
#37
San Pablo Dam Rd
El Sobrante, CA 94803
|
- sq. feet
|
- baths - beds |
show details | |

|
Check over 1 million property listings on Foreclosure.com!
|
browse all offers | |||


 | Sacramento homeless issues - what is the latest? (132 replies) |
| How the hell do I find apartments in east bay? (19 replies) |
| Buy in Richmond vs. Rent in Berkeley (51 replies) |
| SF/Bay Area Crime Thread (1410 replies) |
| Moving from LA to the Bay Area (52 replies) |
| Why does El Sobrante feel so rural? (8 replies) |
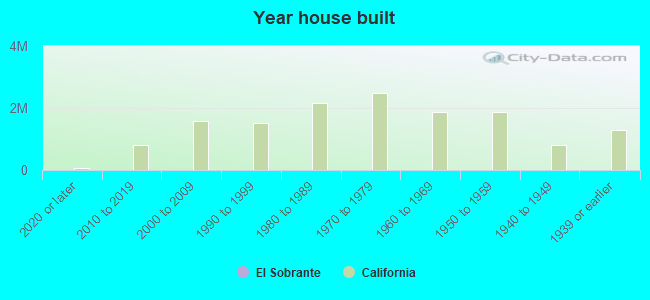
Median year apartment built: 1967
Household type by relationship:
Households: 15,421- Male householders: 2,684 (279 living alone), Female householders: 2,719 (634 living alone)
2,707 spouses (2,581 opposite-sex spouses), 536 unmarried partners, (523 opposite-sex unmarried partners), 4,138 children (3,958 natural, 31 adopted, 148 stepchildren), 463 grandchildren, 210 brothers or sisters, 526 parents, 0 foster children, 476 other relatives, 883 non-relatives
- In group quarters: 72
Size of family households: 1,417 2-persons, 984 3-persons, 1,136 4-persons, 326 5-persons, 116 6-persons, 152 7-or-more-persons.
Size of nonfamily households: 925 1-person, 378 2-persons, 65 3-persons.
1,634 married couples with children.
779 single-parent households (238 men, 541 women).
60.5% of residents of El Sobrante speak English at home.
19.7% of residents speak Spanish at home (56% speak English very well, 21% speak English well, 17% speak English not well, 5% don't speak English at all).
8.8% of residents speak other Indo-European language at home (53% speak English very well, 26% speak English well, 20% speak English not well).
10.0% of residents speak Asian or Pacific Island language at home (58% speak English very well, 26% speak English well, 8% speak English not well, 8% don't speak English at all).
1.1% of residents speak other language at home (81% speak English very well, 5% speak English well, 14% speak English not well).
Foreign born population: 4,554 (29.5%)
(51.8% of them are naturalized citizens)
| Here: | 5.9 |
| State: | 6.0 |
| Here: | 4.3 |
| State: | 3.9 |
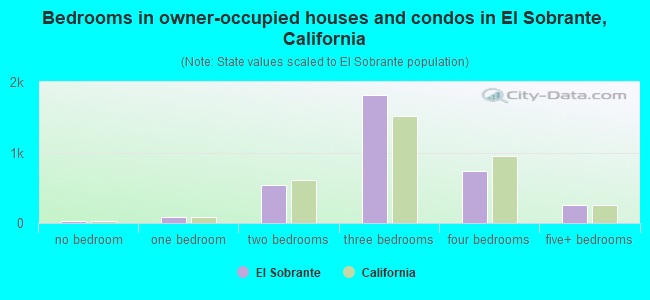
- Bedrooms in owner-occupied houses and condos in El Sobrante, California
- 27no bedroom
- 881 bedroom
- 5352 bedrooms
- 1,8093 bedrooms
- 7334 bedrooms
- 2625+ bedrooms
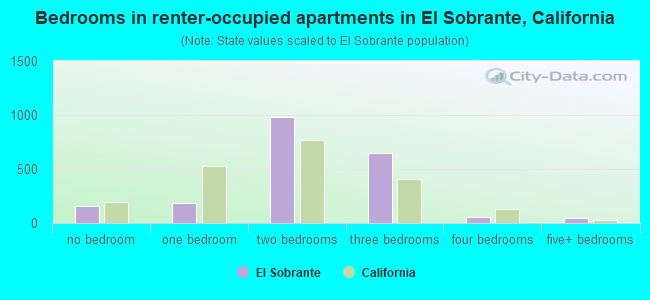
- Bedrooms in renter-occupied apartments in El Sobrante, California
- 159no bedroom
- 1831 bedroom
- 9782 bedrooms
- 6523 bedrooms
- 524 bedrooms
- 425+ bedrooms
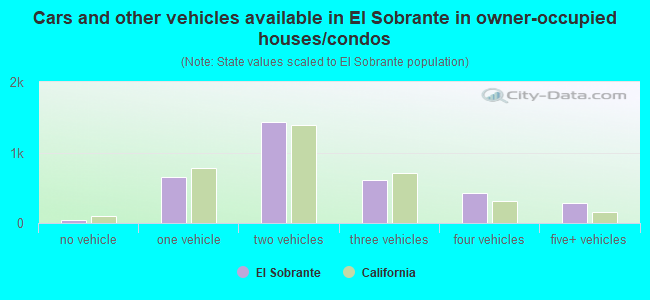
- Cars and other vehicles available in El Sobrante in owner-occupied houses/condos
- 49no vehicle
- 6481 vehicle
- 1,4372 vehicles
- 6123 vehicles
- 4224 vehicles
- 2875+ vehicles
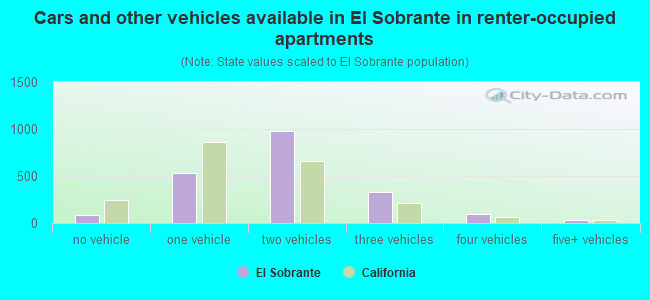
- Cars and other vehicles available in El Sobrante in renter-occupied apartments
- 90no vehicle
- 5321 vehicle
- 9832 vehicles
- 3263 vehicles
- 1004 vehicles
- 355+ vehicles
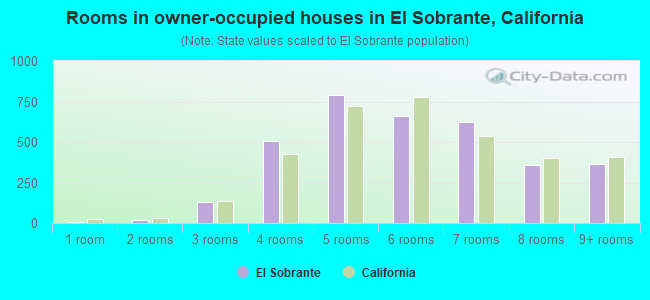
- Rooms in owner-occupied houses in El Sobrante, California
- 41 room
- 212 rooms
- 1293 rooms
- 5044 rooms
- 7905 rooms
- 6616 rooms
- 6257 rooms
- 3588 rooms
- 3639+ rooms
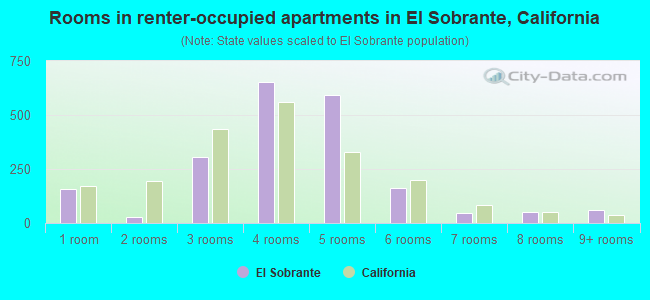
- Rooms in renter-occupied apartments in El Sobrante, California
- 1591 room
- 302 rooms
- 3073 rooms
- 6544 rooms
- 5915 rooms
- 1646 rooms
- 467 rooms
- 528 rooms
- 629+ rooms
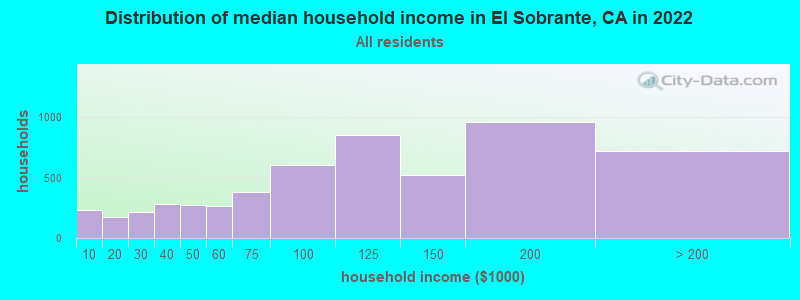
El Sobrante, CA household income distribution

- 229Less than $10,000
- 174$10,000 to $19,999
- 216$20,000 to $29,999
- 280$30,000 to $39,999
- 275$40,000 to $49,999
- 265$50,000 to $59,999
- 378$60,000 to $74,999
- 607$75,000 to $99,999
- 851$100,000 to $124,999
- 519$125,000 to $149,999
- 961$150,000 to $199,999
- 720$200,000 or more
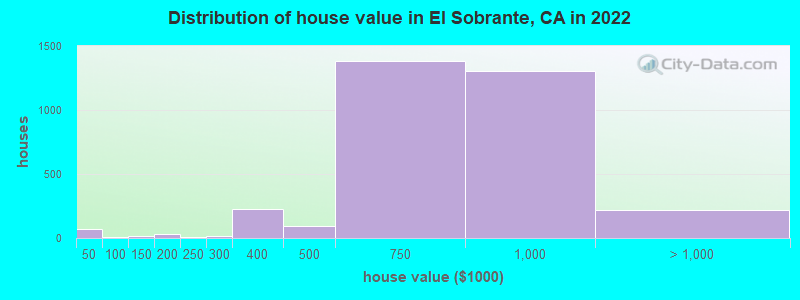
Home value of owner - occupied houses in 2022 in El Sobrante, CA
-
- 52Less than $10,000
- 14$10,000 to $14,999
- 8$60,000 to $69,999
- 16$100,000 to $124,999
- 27$150,000 to $174,999
- 7$200,000 to $249,999
- 15$250,000 to $299,999
- 225$300,000 to $399,999
- 94$400,000 to $499,999
- 1,379$500,000 to $749,999
- 1,307$750,000 to $999,999
- 173$1,000,000 to $1,499,999
- 42$2,000,000 or more
Rent paid by renters in 2022 in El Sobrante, CA
-
- 9Less than $100
- 60$250 to $299
- 5$450 to $499
- 40$500 to $549
- 6$600 to $649
- 35$800 to $899
- 40$900 to $999
- 65$1,000 to $1,249
- 206$1,250 to $1,499
- 885$1,500 to $1,999
- 273$2,000 to $2,499
- 232$2,500 to $2,999
- 102$3,000 to $3,499
- 33$3,500 or more
- 39No cash rent

Percentage of workers working in this county: 54.9%
Number of people working at home: 1,231 (16.6% of all workers)
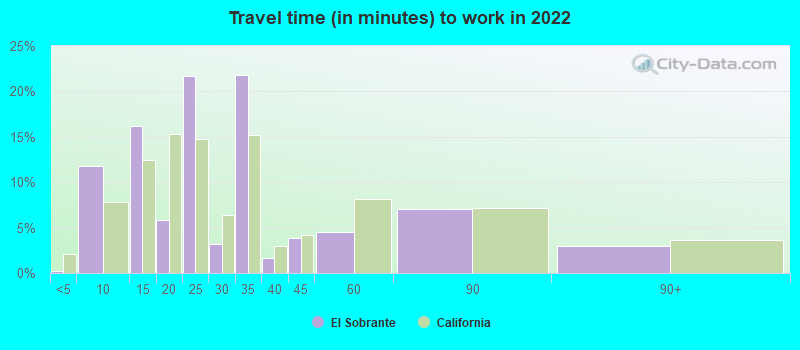
Travel time to work (commute)
- Less than 5 minutes: 63
- 5 to 9 minutes: 248
- 10 to 14 minutes: 455
- 15 to 19 minutes: 791
- 20 to 24 minutes: 977
- 25 to 29 minutes: 199
- 30 to 34 minutes: 1,134
- 35 to 39 minutes: 251
- 40 to 44 minutes: 331
- 45 to 59 minutes: 604
- 60 to 89 minutes: 895
- 90 or more minutes: 179
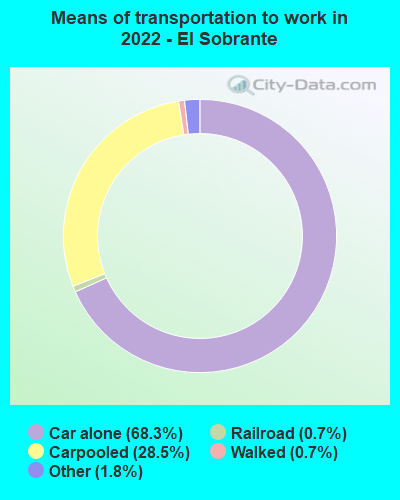
Means of transportation to work:
- Drove a car alone: 1,225 (41.2%)
- Carpooled: 571 (19.2%)
- Light rail, streetcar or trolley: 8 (0.3%)
- Taxi: 35 (1.2%)
- Walked: 17 (0.6%)
- Worked at home: 1,231 (41.4%)
- Unemployment by race in 2022
- Unemployment rate for White non-Hispanic residents
- 4.5%Males
- 2.1%Females
- Unemployment rate for Black residents
- 5.5%Males
- 8.8%Females
- Unemployment rate for Asian residents
- 1.1%Males
- 1.3%Females
- Unemployment rate for other race residents
- 12.3%Males
- Unemployment rate for two or more race residents
- 3.7%Males
- 12.2%Females
- Unemployment rate for Hispanic or Latino residents
- 5.5%Males
- 7.7%Females
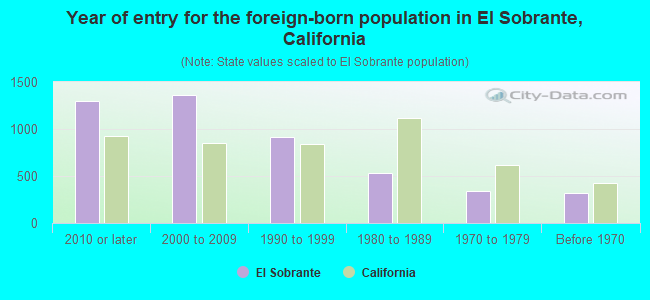
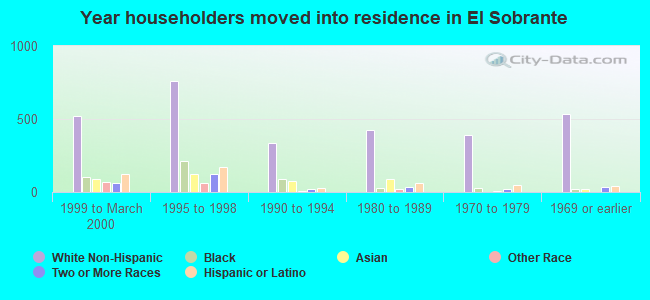
- Year of entry for the foreign-born population in El Sobrante, California
- 1,2932010 or later
- 1,3632000 to 2009
- 9191990 to 1999
- 5361980 to 1989
- 3361970 to 1979
- 323Before 1970
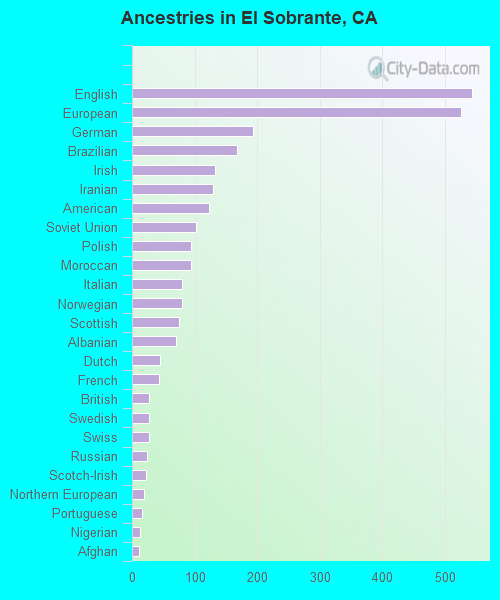
First ancestries reported:
- English: 544 (5.8%)
- European: 526 (5.6%)
- German: 194 (2.1%)
- Brazilian: 168 (1.8%)
- Irish: 133 (1.4%)
- Iranian: 130 (1.4%)
- American: 124 (1.3%)
- Soviet Union: 103 (1.1%)
- Polish: 95 (1.0%)
- Moroccan: 94 (1.0%)
- Italian: 80 (0.8%)
- Norwegian: 80 (0.8%)
- Scottish: 75 (0.8%)
- Albanian: 70 (0.7%)
- Dutch: 45 (0.5%)
- French: 43 (0.5%)
- British: 27 (0.3%)
- Swedish: 27 (0.3%)
- Swiss: 27 (0.3%)
- Russian: 24 (0.3%)
- Scotch-Irish: 22 (0.2%)
- Northern European: 19 (0.2%)
- Portuguese: 16 (0.2%)
- Nigerian: 13 (0.1%)
- Afghan: 12 (0.1%)
- Lithuanian: 10 (0.1%)
- Cape Verdean: 10 (0.1%)
- New Zealander: 8 (0.08%)
- Jamaican: 8 (0.08%)
- Assyrian: 7 (0.07%)
Most common places of birth for foreign-born residents (%):
| El Sobrante: | 21.6% (932) |
| California: | 37.2% (3,881,193) |
| El Sobrante: | 8.4% (361) |
| California: | 6.6% (684,672) |
| El Sobrante: | 8.3% (356) |
| California: | 7.8% (818,297) |
| El Sobrante: | 7.5% (324) |
| California: | 5.2% (539,184) |
| El Sobrante: | 7.2% (309) |
| California: | 4.2% (440,287) |
| El Sobrante: | 4.0% (172) |
| California: | 0.6% (58,161) |
| El Sobrante: | 3.9% (168) |
| California: | 0.5% (49,399) |
| El Sobrante: | 3.6% (157) |
| California: | 0.2% (16,541) |
| El Sobrante: | 3.4% (147) |
| California: | 0.5% (53,222) |
| El Sobrante: | 3.0% (130) |
| California: | 0.7% (74,025) |
| El Sobrante: | 2.6% (114) |
| California: | 0.0% (2,667) |
| El Sobrante: | 1.9% (82) |
| California: | 0.2% (17,699) |
| El Sobrante: | 1.8% (79) |
| California: | 2.0% (206,004) |
| El Sobrante: | 1.7% (74) |
| California: | 0.1% (12,623) |
| El Sobrante: | 1.7% (73) |
| California: | 0.0% (668) |
| El Sobrante: | 1.6% (68) |
| California: | 2.8% (290,436) |
Place of birth for U.S.-born residents:
- This state: 8,130
- Other state: 2,529
- Northeast: 441
- Midwest: 647
- South: 981
- West: 447
91.3% of El Sobrante residents lived in the same house 1 years ago.
Out of people who lived in different houses, 41.1% lived in this county.
Out of people who lived in different counties, 93.2% lived in California.
| El Sobrante: | 91.3% |
| State average: | 88.9% |
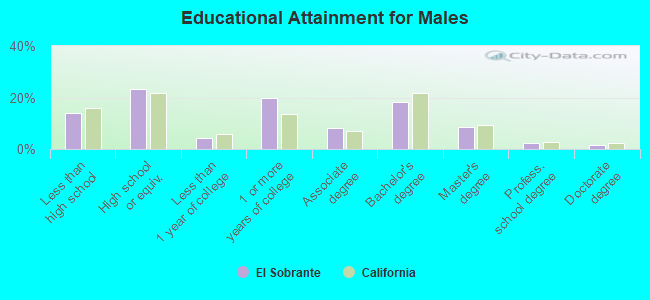
Education attainment for males 25 years and older:
- No schooling: 240
- Nursery to 4th grade: 110
- 5th and 6th grade: 14
- 7th and 8th grade: 5
- 9th grade: 36
- 10th grade: 30
- 11th grade: 57
- 12th grade, no diploma: 317
- High school graduate (or equivalency): 1,362
- Less than 1 year of college: 243
- Some college more than 1 year, no degree: 1,155
- Associate degree: 470
- Bachelor's degree: 1,079
- Master's degree: 509
- Professional school degree: 136
- Doctorate degree: 93
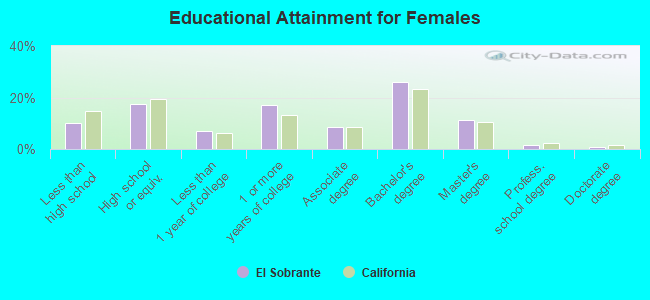
Education attainment for females 25 years and older:
- No schooling: 173
- Nursery to 4th grade: 17
- 5th and 6th grade: 52
- 7th and 8th grade: 1
- 9th grade: 75
- 10th grade: 38
- 11th grade: 121
- 12th grade, no diploma: 99
- High school graduate (or equivalency): 1,018
- Less than 1 year of college: 403
- Some college more than 1 year, no degree: 981
- Associate degree: 484
- Bachelor's degree: 1,512
- Master's degree: 659
- Professional school degree: 99
- Doctorate degree: 43
Housing units in structures:
- One, detached: 4,196
- One, attached: 249
- Two: 123
- 3 or 4: 258
- 5 to 9: 209
- 10 to 19: 170
- 20 to 49: 362
- 50 or more: 209
- Mobile homes: 39
- Boats, RVs, vans, etc.: 10
Housing units lacking complete kitchen facilities in 2022: 0.9%
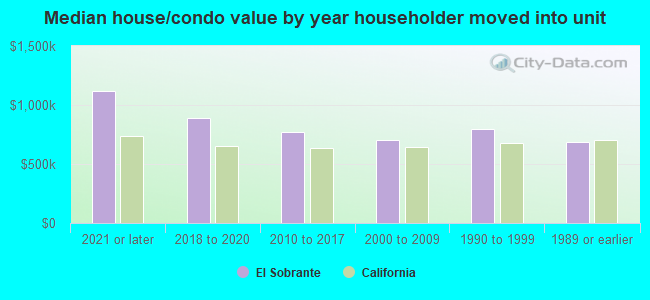
House/condo owner moved in on average 17 years ago
Renter moved in on average 6 years ago
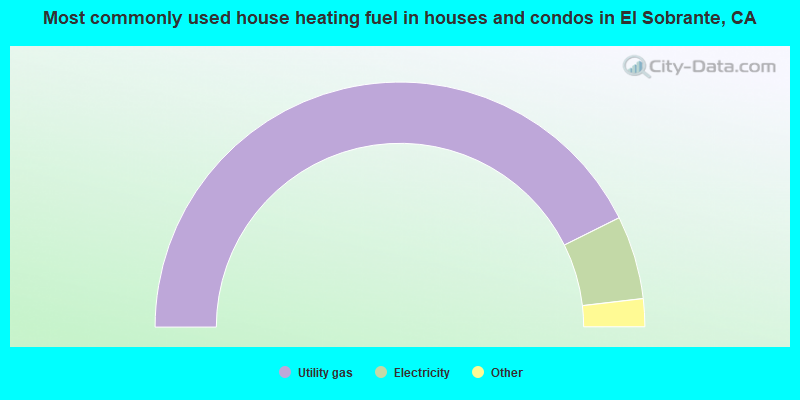
- 85.3%Utility gas
- 11.0%Electricity
- 2.0%Solar energy
- 1.4%Wood
- 0.2%No fuel used
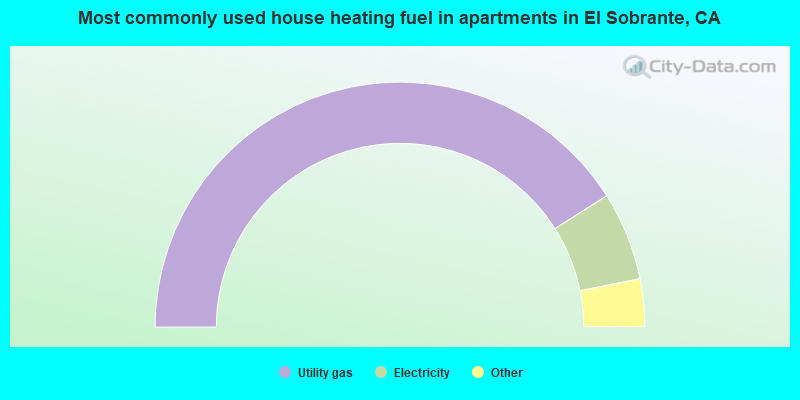
- 82.1%Utility gas
- 11.7%Electricity
- 2.1%Solar energy
- 1.6%No fuel used
- 1.3%Bottled, tank, or LP gas
- 1.2%Fuel oil, kerosene, etc.
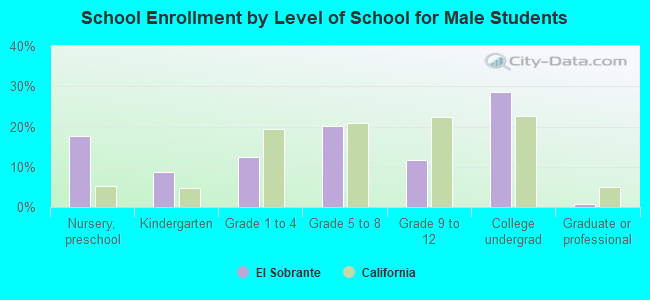
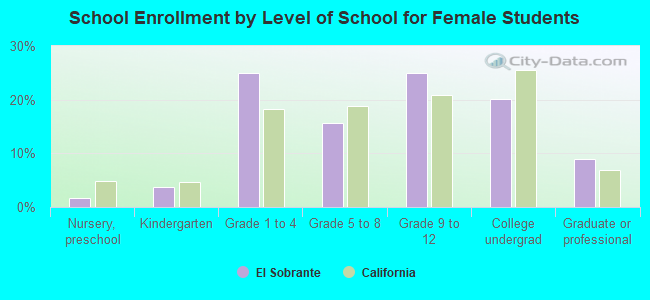
Private vs. public school enrollment:
| Here: | 20.7% |
| California: | 10.5% |
| Here: | 13.6% |
| California: | 8.5% |
| Here: | 16.7% |
| California: | 15.9% |