El Reno, OK (Oklahoma) Houses and Residents
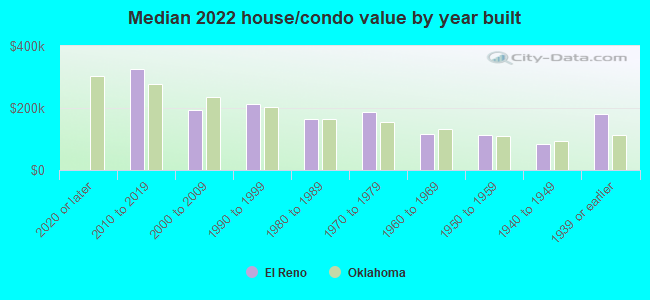
| El Reno: | $156,664 |
| Oklahoma: | $191,700 |
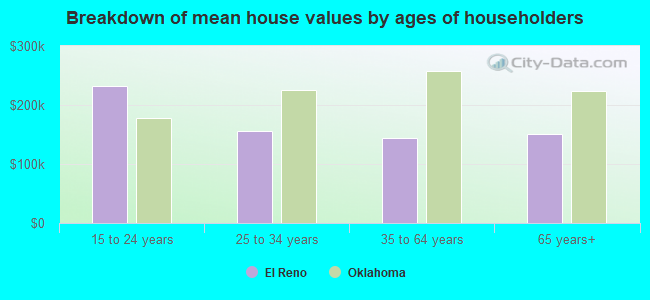
Mean price in 2022:
Detached houses: $176,071
Here: $176,071 State: $255,409 Townhouses or other attached units: $118,200
Here: $118,200 State: $206,466 Mobile homes: $153,458
Here: $153,458 State: $110,804
Total population: 18,153 (Urban population: 14,661 (all inside urban clusters), Rural population: 1,613 (132 farm, 1,481 nonfarm))
Houses: 7,215 (6,395 occupied: 3,753 owner occupied, 2,701 renter occupied)
| % of renters here: | 42% |
| State: | 35% |
Housing density: 90 houses/condos per square mile
Median price asked for vacant for-sale houses and condos in 2022: $84,282.
Median contract rent in 2022: $662 (lower quartile is $492, upper quartile is $864)
Median rent asked for vacant for-rent units in 2022: $2,147
Median gross rent in El Reno, OK in 2022: $859
Housing units in El Reno with a mortgage: 1,922 (84 second mortgage, 0 home equity loan, 64 both second mortgage and home equity loan)
Houses without a mortgage: 0
Median household income for houses/condos with a mortgage: $80,799
Median household income for apartments without a mortgage: $52,705
Median monthly housing costs: $823
Compare current foreclosures in El Reno, OK:
| Photo | Address | Area | Beds / Baths | Price | Details |
|---|---|---|---|---|---|

|
#1
S Jensen Ave
El Reno, OK 73036
|
1,693 sq. feet
|
2 baths 3 beds |
show details | |

|
#2
S David Dr
El Reno, OK 73036
|
1,688 sq. feet
|
2 baths 3 beds |
show details | |

|
#3
S Ellison Ave
El Reno, OK 73036
|
1,683 sq. feet
|
1 baths 3 beds |
show details | |

|
#4
S Roberts Ave
El Reno, OK 73036
|
1,798 sq. feet
|
1 baths 3 beds |
show details | |

|
#5
Kerry Ln
El Reno, OK 73036
|
1,630 sq. feet
|
2 baths 3 beds |
show details | |

|
#6
E Wade St
El Reno, OK 73036
|
1,898 sq. feet
|
2 baths 4 beds |
show details | |

|
#7
SW 26th Pl
El Reno, OK 73036
|
1,698 sq. feet
|
1 baths 3 beds |
show details | |

|
#8
W Oak St
El Reno, OK 73036
|
1,684 sq. feet
|
1 baths 4 beds |
show details | |

|
#9
SW 24th St
El Reno, OK 73036
|
1,181 sq. feet
|
2 baths 3 beds |
show details | |

|
#10
E Wade St
El Reno, OK 73036
|
1,848 sq. feet
|
1 baths 3 beds |
show details |
| Photo | Address | Area | Beds / Baths | Price | Details |
|---|---|---|---|---|---|

|
#11
SW 44th St
El Reno, OK 73036
|
1,588 sq. feet
|
2 baths 3 beds |
show details | |

|
#12
N Macomb Ave
El Reno, OK 73036
|
1,040 sq. feet
|
1 baths 3 beds |
show details | |

|
#13
Pleasant View Dr
El Reno, OK 73036
|
2,073 sq. feet
|
2 baths 3 beds |
show details | |

|
#14
Prairie Cir
El Reno, OK 73036
|
2,200 sq. feet
|
1 baths 3 beds |
show details | |

|
#15
S Macomb Ave
El Reno, OK 73036
|
1,523 sq. feet
|
1 baths 2 beds |
show details | |

|
#16
Villa Dr
El Reno, OK 73036
|
1,430 sq. feet
|
2 baths 3 beds |
show details | |

|
#17
Holbrook Dr
El Reno, OK 73036
|
1,214 sq. feet
|
1 baths 3 beds |
show details | |

|
#18
Villa Dr
El Reno, OK 73036
|
2,061 sq. feet
|
2 baths 3 beds |
show details | |

|
#19
S Dille Ave
El Reno, OK 73036
|
1,400 sq. feet
|
1 baths 3 beds |
show details | |

|
#20
S Estate Dr
El Reno, OK 73036
|
1,342 sq. feet
|
2 baths 3 beds |
show details |
| Photo | Address | Area | Beds / Baths | Price | Details |
|---|---|---|---|---|---|

|
#21
W Oak St
El Reno, OK 73036
|
986 sq. feet
|
1 baths 3 beds |
show details | |

|
#22
Fedderson Dr
El Reno, OK 73036
|
1,765 sq. feet
|
2 baths 3 beds |
show details | |

|
#23
Soth Williams Street
El Reno, OK 73036
|
- sq. feet
|
- baths - beds |
show details | |

|
#24
Single Tree
El Reno, OK 73036
|
- sq. feet
|
- baths - beds |
show details | |

|
#25
Palomino Dr
El Reno, OK 73036
|
- sq. feet
|
- baths - beds |
show details | |

|
#26
S Shepard Ave Apt 314
El Reno, OK 73036
|
- sq. feet
|
- baths - beds |
show details | |

|
#27
SW 28th St
El Reno, OK 73036
|
- sq. feet
|
- baths - beds |
show details | |

|
#28
Scarlet Cir
El Reno, OK 73036
|
- sq. feet
|
- baths - beds |
show details | |

|
#29
Holbrook Dr
El Reno, OK 73036
|
- sq. feet
|
- baths - beds |
show details | |

|
#30
Fort Reno Dr, Trlr 109
El Reno, OK 73036
|
- sq. feet
|
- baths - beds |
show details |
| Photo | Address | Area | Beds / Baths | Price | Details |
|---|---|---|---|---|---|

|
#31
E Rogers St
El Reno, OK 73036
|
- sq. feet
|
- baths - beds |
show details | |

|
#32
S Shepard Ave
El Reno, OK 73036
|
- sq. feet
|
- baths - beds |
show details | |

|
#33
E Cavanaugh St
El Reno, OK 73036
|
- sq. feet
|
- baths - beds |
show details | |

|
#34
Abbey Rd
El Reno, OK 73036
|
- sq. feet
|
- baths - beds |
show details | |

|
#35
W Watts St
El Reno, OK 73036
|
- sq. feet
|
- baths - beds |
show details | |

|
#36
E Riley St
El Reno, OK 73036
|
- sq. feet
|
- baths - beds |
show details | |

|
#37
S Frances Ave
El Reno, OK 73036
|
- sq. feet
|
- baths - beds |
show details | |

|
#38
Chuck Wagon Dr
El Reno, OK 73036
|
- sq. feet
|
- baths - beds |
show details | |

|
#39
S Manning Rd
El Reno, OK 73036
|
- sq. feet
|
- baths - beds |
show details | |

|
#40
S Brandley Rd
El Reno, OK 73036
|
- sq. feet
|
- baths - beds |
show details |
| Photo | Address | Area | Beds / Baths | Price | Details |
|---|---|---|---|---|---|

|
#41
S Ellison Ave
El Reno, OK 73036
|
- sq. feet
|
- baths - beds |
show details | |

|
#42
E Us Highway 66
El Reno, OK 73036
|
- sq. feet
|
- baths - beds |
show details | |

|
#43
Sunset Dr
El Reno, OK 73036
|
- sq. feet
|
- baths - beds |
show details | |

|
Check over 1 million property listings on Foreclosure.com!
|
browse all offers | |||


 | Would love to move to OKC but. Concerned abt Tornado (78 replies) |
| Family-Friendly places to rent in the El Reno/Yukon Area (0 replies) |
| New to OK! (7 replies) |
| Recommendations for a 1 day visit (2 replies) |
| Moving to OKC from Phoenix metro and traffic/crowds (63 replies) |
| OK Route 66 in a 56-Year Old 356: what are your Route 66 “must see” spots in Oklahoma? (19 replies) |
Median year apartment built: 1972
Household type by relationship:
Households: 18,864- Male householders: 3,059 (899 living alone), Female householders: 3,587 (1,224 living alone)
2,621 spouses (2,581 opposite-sex spouses), 535 unmarried partners, (527 opposite-sex unmarried partners), 5,178 children (4,468 natural, 292 adopted, 417 stepchildren), 560 grandchildren, 354 brothers or sisters, 299 parents, 41 foster children, 181 other relatives, 699 non-relatives
- In group quarters: 1,746
Size of family households: 1,681 2-persons, 788 3-persons, 847 4-persons, 415 5-persons, 113 6-persons, 67 7-or-more-persons.
Size of nonfamily households: 2,194 1-person, 328 2-persons, 60 3-persons, 3 4-persons.
2,330 married couples with children.
1,404 single-parent households (303 men, 1,101 women).
89.0% of residents of El Reno speak English at home.
10.1% of residents speak Spanish at home (50% speak English very well, 20% speak English well, 22% speak English not well, 8% don't speak English at all).
0.2% of residents speak other Indo-European language at home (73% speak English very well, 27% speak English not well).
0.4% of residents speak Asian or Pacific Island language at home (86% speak English well, 14% speak English not well).
0.2% of residents speak other language at home (92% speak English very well, 8% speak English well).
Foreign born population: 962 (5.1%)
(38.0% of them are naturalized citizens)
| Here: | 6.0 |
| State: | 6.1 |
| Here: | 4.2 |
| State: | 4.5 |
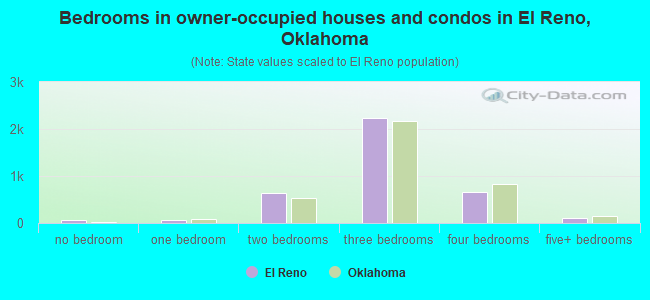
- Bedrooms in owner-occupied houses and condos in El Reno, Oklahoma
- 56no bedroom
- 591 bedroom
- 6412 bedrooms
- 2,2283 bedrooms
- 6634 bedrooms
- 1085+ bedrooms
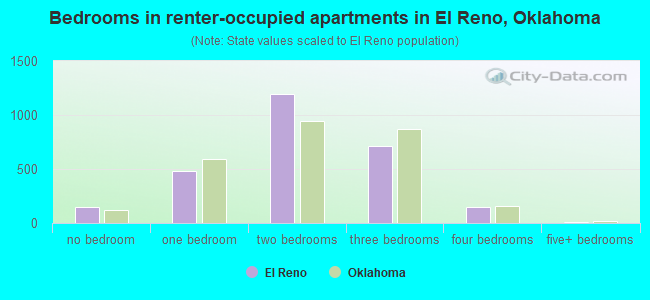
- Bedrooms in renter-occupied apartments in El Reno, Oklahoma
- 144no bedroom
- 4841 bedroom
- 1,1992 bedrooms
- 7153 bedrooms
- 1504 bedrooms
- 95+ bedrooms
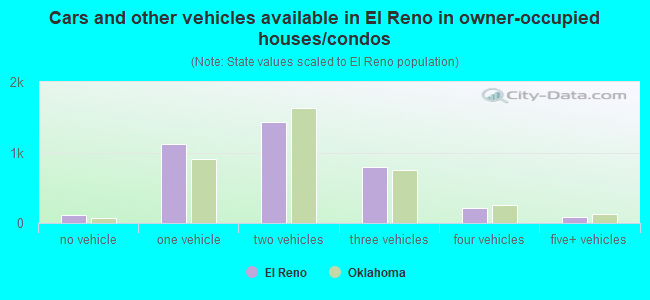
- Cars and other vehicles available in El Reno in owner-occupied houses/condos
- 110no vehicle
- 1,1251 vehicle
- 1,4282 vehicles
- 7973 vehicles
- 2074 vehicles
- 875+ vehicles
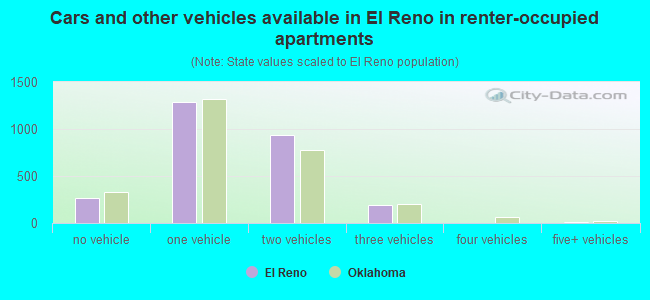
- Cars and other vehicles available in El Reno in renter-occupied apartments
- 270no vehicle
- 1,2901 vehicle
- 9382 vehicles
- 1873 vehicles
- 54 vehicles
- 125+ vehicles
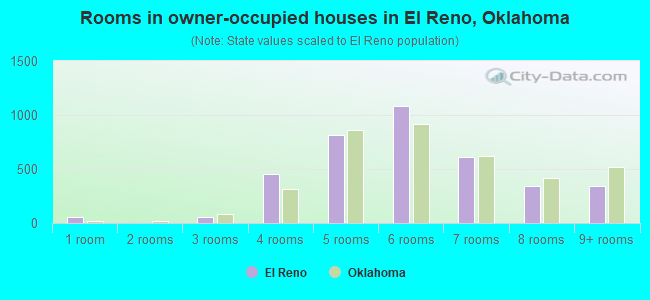
- Rooms in owner-occupied houses in El Reno, Oklahoma
- 561 room
- 02 rooms
- 533 rooms
- 4524 rooms
- 8175 rooms
- 1,0846 rooms
- 6097 rooms
- 3388 rooms
- 3459+ rooms
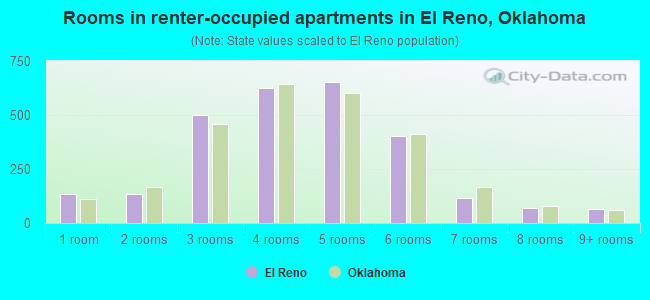
- Rooms in renter-occupied apartments in El Reno, Oklahoma
- 1321 room
- 1362 rooms
- 5023 rooms
- 6234 rooms
- 6545 rooms
- 4036 rooms
- 1167 rooms
- 718 rooms
- 649+ rooms
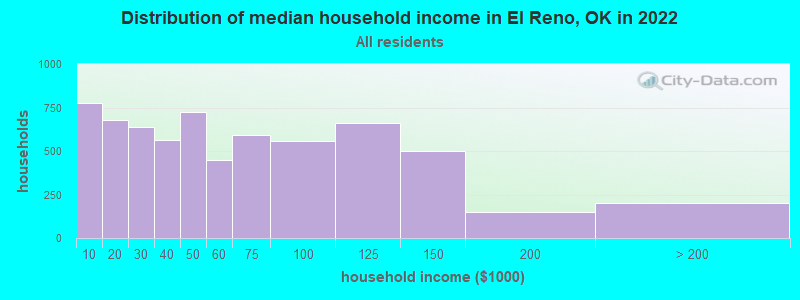
El Reno, OK household income distribution

- 776Less than $10,000
- 680$10,000 to $19,999
- 638$20,000 to $29,999
- 564$30,000 to $39,999
- 723$40,000 to $49,999
- 449$50,000 to $59,999
- 590$60,000 to $74,999
- 559$75,000 to $99,999
- 660$100,000 to $124,999
- 500$125,000 to $149,999
- 148$150,000 to $199,999
- 204$200,000 or more
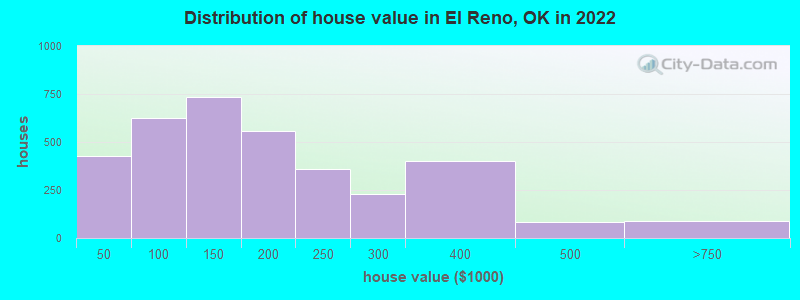
Home value of owner - occupied houses in 2022 in El Reno, OK
-
- 76Less than $10,000
- 39$10,000 to $14,999
- 38$20,000 to $24,999
- 170$25,000 to $29,999
- 13$30,000 to $34,999
- 40$35,000 to $39,999
- 49$40,000 to $49,999
- 110$50,000 to $59,999
- 39$60,000 to $69,999
- 190$70,000 to $79,999
- 151$80,000 to $89,999
- 84$90,000 to $99,999
- 505$100,000 to $124,999
- 227$125,000 to $149,999
- 349$150,000 to $174,999
- 206$175,000 to $199,999
- 359$200,000 to $249,999
- 228$250,000 to $299,999
- 400$300,000 to $399,999
- 83$400,000 to $499,999
- 82$500,000 to $749,999
- 2$750,000 to $999,999
- 3$2,000,000 or more
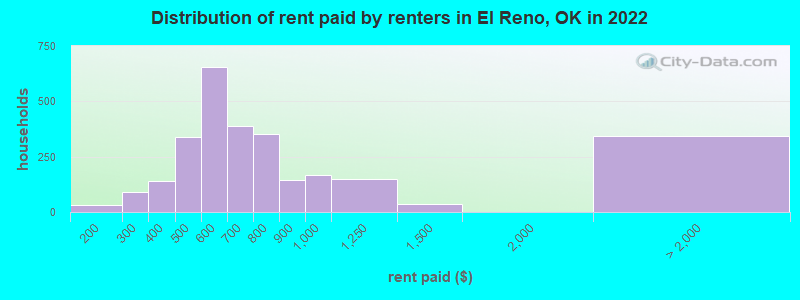
Rent paid by renters in 2022 in El Reno, OK
-
- 24$100 to $149
- 6$150 to $199
- 43$200 to $249
- 47$250 to $299
- 26$300 to $349
- 113$350 to $399
- 114$400 to $449
- 226$450 to $499
- 513$500 to $549
- 142$550 to $599
- 240$600 to $649
- 148$650 to $699
- 156$700 to $749
- 194$750 to $799
- 143$800 to $899
- 168$900 to $999
- 147$1,000 to $1,249
- 35$1,250 to $1,499
- 19$2,500 to $2,999
- 32$3,500 or more
- 290No cash rent
Percentage of workers working in this county: 71.0%
Number of people working at home: 588 (7.8% of all workers)
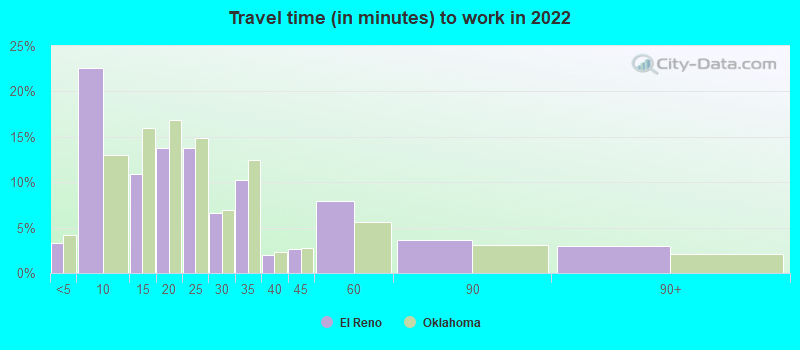
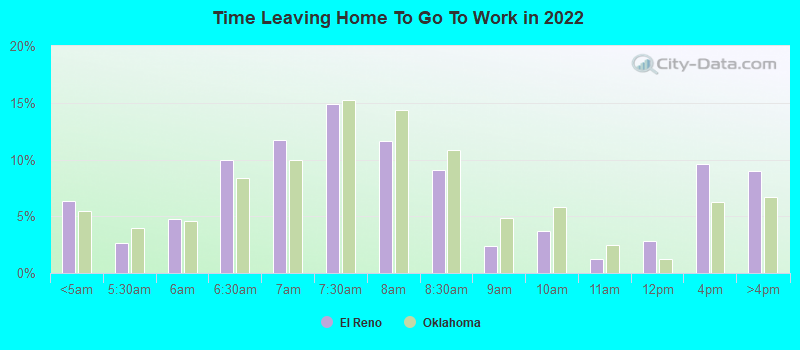
Travel time to work (commute)
- Less than 5 minutes: 361
- 5 to 9 minutes: 2,012
- 10 to 14 minutes: 1,096
- 15 to 19 minutes: 1,049
- 20 to 24 minutes: 788
- 25 to 29 minutes: 389
- 30 to 34 minutes: 716
- 35 to 39 minutes: 214
- 40 to 44 minutes: 329
- 45 to 59 minutes: 466
- 60 to 89 minutes: 175
- 90 or more minutes: 145
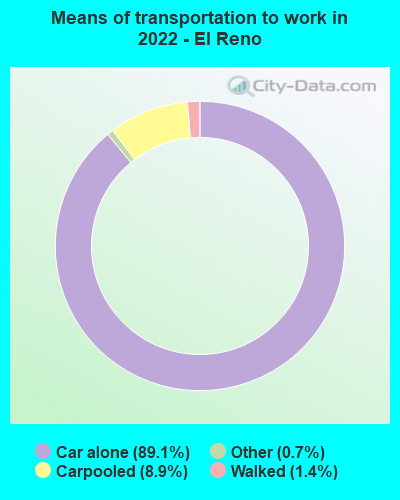
Means of transportation to work:
- Drove a car alone: 7,813 (82.7%)
- Carpooled: 792 (8.4%)
- Taxi: 55 (0.6%)
- Walked: 123 (1.3%)
- Worked at home: 588 (6.2%)
- Unemployment by race in 2022
- Unemployment rate for White non-Hispanic residents
- 1.4%Males
- 7.3%Females
- Unemployment rate for Black residents
- 16.0%Females
- Unemployment rate for American Indian and Alaska Native residents
- 9.1%Males
- 33.3%Females
- Unemployment rate for Asian residents
- 100.0%Males
- Unemployment rate for other race residents
- 4.8%Males
- Unemployment rate for two or more race residents
- 18.8%Males
- 2.7%Females
- Unemployment rate for Hispanic or Latino residents
- 13.1%Males
- 6.1%Females
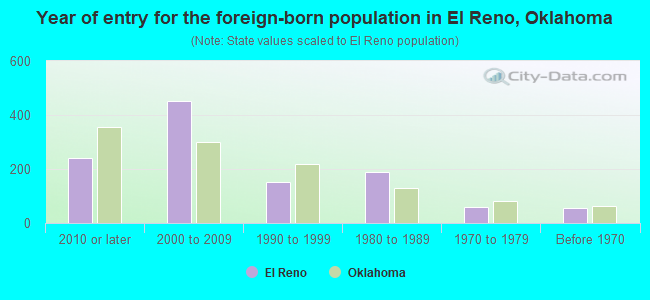
- Year of entry for the foreign-born population in El Reno, Oklahoma
- 2392010 or later
- 4532000 to 2009
- 1521990 to 1999
- 1901980 to 1989
- 601970 to 1979
- 54Before 1970
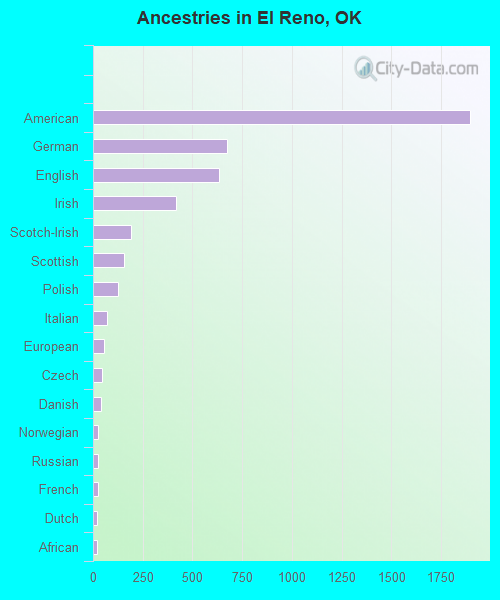
First ancestries reported:
- American: 1,897 (20.2%)
- German: 673 (7.2%)
- English: 634 (6.8%)
- Irish: 415 (4.4%)
- Scotch-Irish: 190 (2.0%)
- Scottish: 154 (1.6%)
- Polish: 127 (1.4%)
- Italian: 70 (0.7%)
- European: 54 (0.6%)
- Czech: 45 (0.5%)
- Danish: 39 (0.4%)
- Norwegian: 26 (0.3%)
- Russian: 24 (0.3%)
- French: 23 (0.2%)
- Dutch: 19 (0.2%)
- African: 18 (0.2%)
- Eastern European: 14 (0.1%)
- Swiss: 9 (0.10%)
- Ukrainian: 8 (0.09%)
Most common places of birth for foreign-born residents (%):
| El Reno: | 91.3% (931) |
| Oklahoma: | 42.4% (103,425) |
| El Reno: | 3.6% (37) |
| Oklahoma: | 4.2% (10,287) |
| El Reno: | 2.9% (30) |
| Oklahoma: | 0.3% (633) |
Place of birth for U.S.-born residents:
- This state: 11,822
- Other state: 5,831
- Northeast: 485
- Midwest: 1,257
- South: 2,541
- West: 1,571
81.8% of El Reno residents lived in the same house 1 years ago.
Out of people who lived in different houses, 24.5% lived in this county.
Out of people who lived in different counties, 67.3% lived in Oklahoma.
| El Reno: | 81.8% |
| State average: | 85.5% |
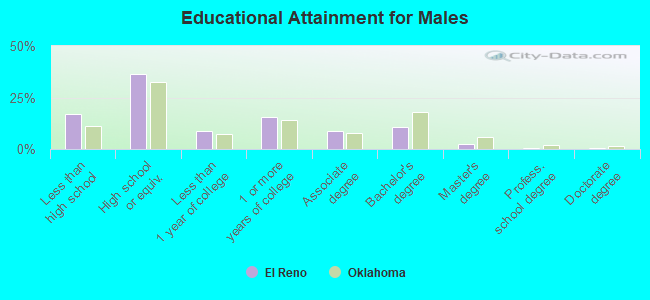
Education attainment for males 25 years and older:
- No schooling: 60
- Nursery to 4th grade: 36
- 5th and 6th grade: 166
- 7th and 8th grade: 35
- 9th grade: 182
- 10th grade: 221
- 11th grade: 188
- 12th grade, no diploma: 179
- High school graduate (or equivalency): 2,291
- Less than 1 year of college: 544
- Some college more than 1 year, no degree: 981
- Associate degree: 550
- Bachelor's degree: 678
- Master's degree: 146
- Professional school degree: 32
- Doctorate degree: 27
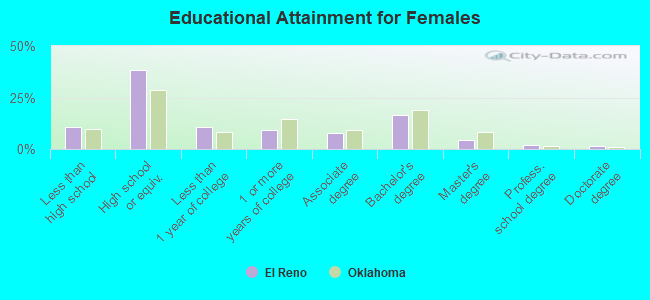
Education attainment for females 25 years and older:
- No schooling: 54
- Nursery to 4th grade: 12
- 5th and 6th grade: 34
- 7th and 8th grade: 15
- 9th grade: 95
- 10th grade: 202
- 11th grade: 148
- 12th grade, no diploma: 78
- High school graduate (or equivalency): 2,316
- Less than 1 year of college: 656
- Some college more than 1 year, no degree: 569
- Associate degree: 458
- Bachelor's degree: 988
- Master's degree: 257
- Professional school degree: 108
- Doctorate degree: 78
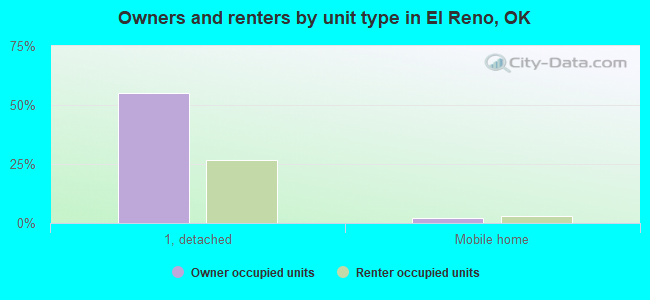
Housing units in structures:
- One, detached: 5,586
- One, attached: 149
- Two: 165
- 3 or 4: 249
- 5 to 9: 410
- 10 to 19: 110
- 20 to 49: 54
- 50 or more: 86
- Mobile homes: 404
Housing units lacking complete kitchen facilities in 2022: 6.3%
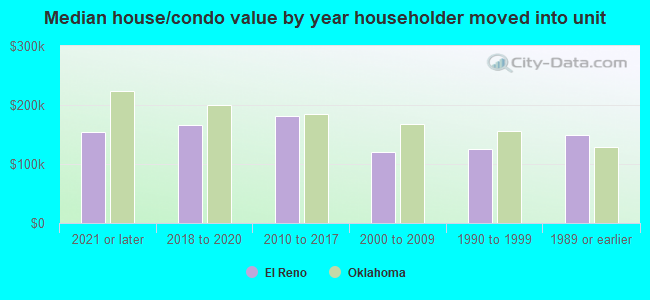
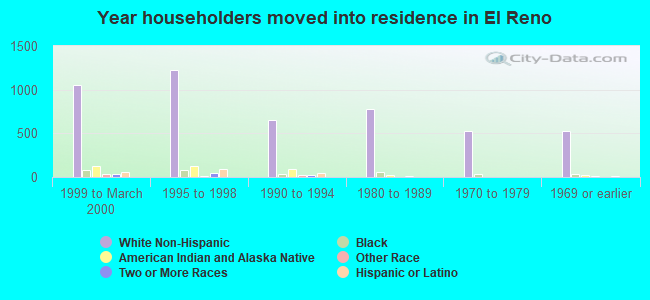
House/condo owner moved in on average 11 years ago
Renter moved in on average 4 years ago
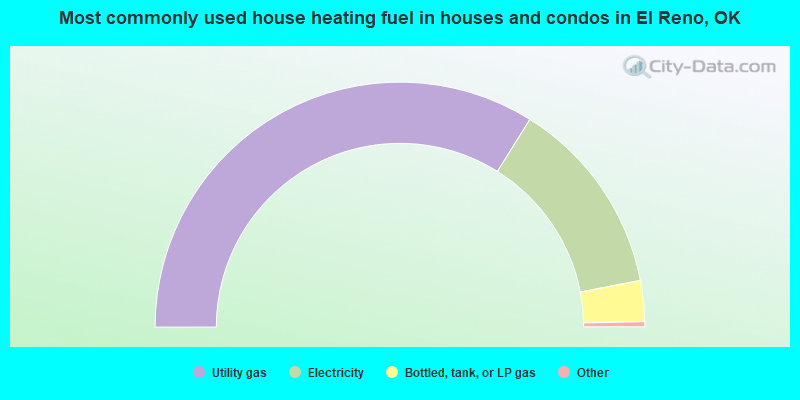
- 67.9%Utility gas
- 26.1%Electricity
- 5.4%Bottled, tank, or LP gas
- 0.4%Solar energy
- 0.1%Other fuel
- 0.1%No fuel used
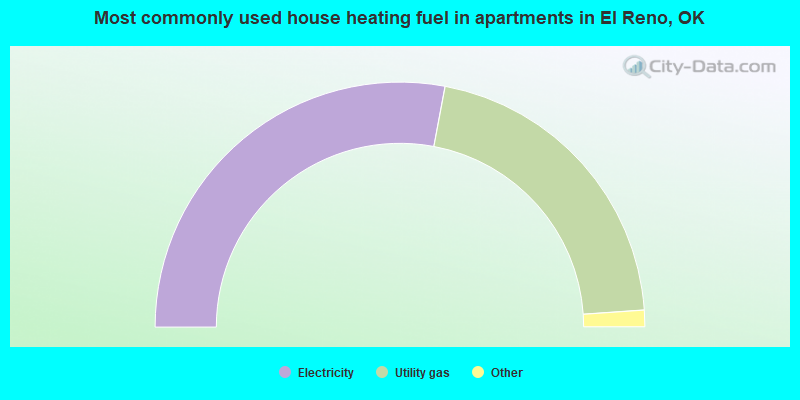
- 55.9%Electricity
- 41.9%Utility gas
- 1.4%No fuel used
- 0.4%Wood
- 0.2%Bottled, tank, or LP gas
- 0.1%Fuel oil, kerosene, etc.
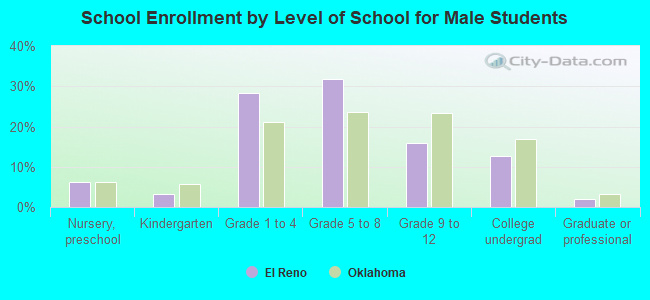
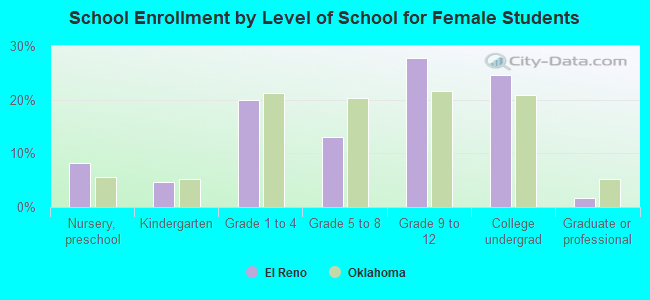
Private vs. public school enrollment:
| Here: | 8.6% |
| Oklahoma: | 11.7% |
| Here: | 7.9% |
| Oklahoma: | 11.7% |
| Here: | 10.9% |
| Oklahoma: | 19.3% |