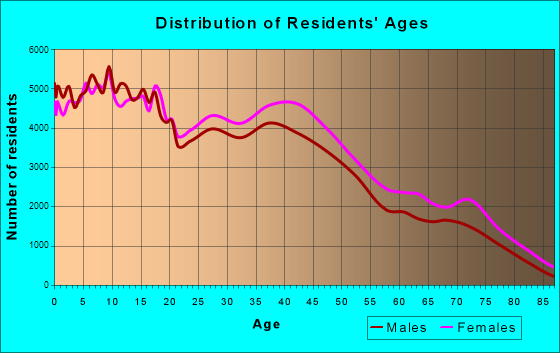
El Paso, TX (Texas) Houses and Residents
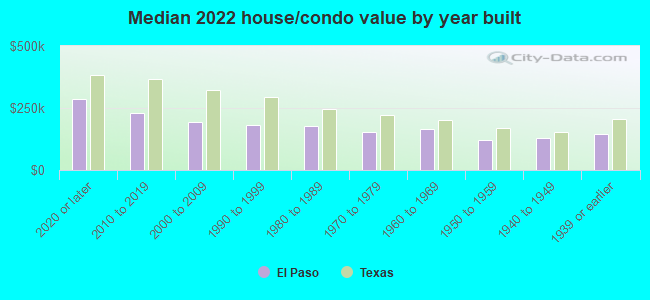
| El Paso: | $176,700 |
| Texas: | $275,400 |
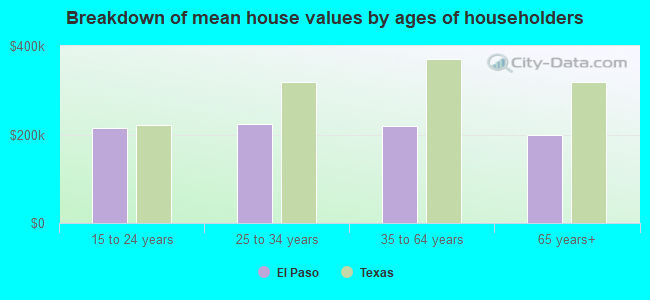
Mean price in 2022:
Detached houses: $217,870
Here: $217,870 State: $369,058 Townhouses or other attached units: $205,324
Here: $205,324 State: $327,631 In 2-unit structures: $123,074
Here: $123,074 State: $374,947 In 3-to-4-unit structures: $136,683
Here: $136,683 State: $209,652 In 5-or-more-unit structures: $528,240
Here: $528,240 State: $413,944 Mobile homes: $38,929
Here: $38,929 State: $124,413 Occupied boats, RVs, vans, etc.: $17,392
Here: $17,392 State: $73,921
Total population: 679,036 (Urban population: 557,950, Rural population: 6,330 (109 farm, 6,221 nonfarm))
Houses: 266,913 (246,839 occupied: 145,878 owner occupied, 100,961 renter occupied)
| % of renters here: | 41% |
| State: | 38% |
Housing density: 1,072 houses/condos per square mile
Median price asked for vacant for-sale houses and condos in 2022: $179,723.
Median contract rent in 2022: $826 (lower quartile is $632, upper quartile is $1,060)
Median rent asked for vacant for-rent units in 2022: $616
Median gross rent in El Paso, TX in 2022: $981
Housing units in El Paso with a mortgage: 76,356 (2,880 second mortgage, 198 home equity loan, 1,960 both second mortgage and home equity loan)
Houses without a mortgage: 861
Median household income for houses/condos with a mortgage: $79,773
Median household income for apartments without a mortgage: $57,383
Median monthly housing costs: $974
Compare current foreclosures in El Paso, TX:
| Photo | Address | Area | Beds / Baths | Price | Details |
|---|---|---|---|---|---|

|
#1
Anita Cir
El Paso, TX 79905
|
1,723 sq. feet
|
2 baths 4 beds |
$132,000
|
show details |

|
#2
Blue Cove Drive
El Paso, TX 79938
|
- sq. feet
|
2 baths 4 beds |
show details | |

|
#3
Woodmanstone Rd
El Paso, TX 79928
|
- sq. feet
|
2 baths 4 beds |
show details | |

|
#4
Mitchell Jones Dr
El Paso, TX 79936
|
1,796 sq. feet
|
2 baths 3 beds |
show details | |

|
#5
Red Orchard Dr
El Paso, TX 79938
|
2,906 sq. feet
|
3 baths 4 beds |
show details | |

|
#6
Loma Esmeralda Dr
El Paso, TX 79938
|
- sq. feet
|
2 baths 3 beds |
show details | |

|
#7
Fir St
El Paso, TX 79925
|
2,322 sq. feet
|
2 baths 3 beds |
show details | |

|
#8
Charles Owens Dr
El Paso, TX 79936
|
1,092 sq. feet
|
2 baths 3 beds |
show details | |

|
#9
Camino Barranca
El Paso, TX 79912
|
2,518 sq. feet
|
3 baths 4 beds |
show details | |

|
#10
Mclean St
El Paso, TX 79936
|
2,301 sq. feet
|
2 baths 3 beds |
show details |
| Photo | Address | Area | Beds / Baths | Price | Details |
|---|---|---|---|---|---|

|
#11
Tierra Pueblo
El Paso, TX 79938
|
1,403 sq. feet
|
2 baths 4 beds |
show details | |

|
#12
Kingsbury Ave
El Paso, TX 79928
|
- sq. feet
|
2 baths 3 beds |
show details | |

|
#13
Laramie Cir
El Paso, TX 79924
|
1,045 sq. feet
|
2 baths 3 beds |
show details | |

|
#14
Emerald Vista Pl
El Paso, TX 79928
|
2,002 sq. feet
|
3 baths 3 beds |
show details | |

|
#15
Franklin Ridge Dr
El Paso, TX 79912
|
1,657 sq. feet
|
2 baths 4 beds |
show details | |

|
#16
Bluff Canyon Cir
El Paso, TX 79912
|
1,711 sq. feet
|
2 baths 3 beds |
show details | |

|
#17
N Stanton St
El Paso, TX 79902
|
2,395 sq. feet
|
3 baths 4 beds |
show details | |

|
#18
Solar Point Ln
El Paso, TX 79938
|
2,350 sq. feet
|
6 baths 4 beds |
show details | |

|
#19
William Caples St
El Paso, TX 79938
|
1,451 sq. feet
|
2 baths 3 beds |
show details | |

|
#20
Pleasant Sand Dr
El Paso, TX 79924
|
2,417 sq. feet
|
3 baths 4 beds |
show details |
| Photo | Address | Area | Beds / Baths | Price | Details |
|---|---|---|---|---|---|

|
#21
Rutherglen St
El Paso, TX 79925
|
2,110 sq. feet
|
2 baths 3 beds |
show details | |

|
#22
Round Rock Dr
El Paso, TX 79924
|
2,230 sq. feet
|
3 baths 4 beds |
show details | |

|
#23
Via Inca Dr
El Paso, TX 79936
|
1,837 sq. feet
|
2 baths 4 beds |
show details | |

|
#24
Ralph Janes Pl
El Paso, TX 79936
|
1,633 sq. feet
|
2 baths 4 beds |
show details | |

|
#25
Lago Seco Dr
El Paso, TX 79928
|
1,821 sq. feet
|
2 baths 4 beds |
show details | |

|
#26
Black Bear Ln
El Paso, TX 79938
|
640 sq. feet
|
1 baths 2 beds |
show details | |

|
#27
John Phelan Dr
El Paso, TX 79936
|
1,612 sq. feet
|
2 baths 3 beds |
show details | |

|
#28
Tierra Berlin Ln
El Paso, TX 79938
|
2,695 sq. feet
|
2 baths 4 beds |
show details | |

|
#29
Colin Powell Ave
El Paso, TX 79934
|
1,637 sq. feet
|
2 baths 3 beds |
show details | |

|
#30
Venecia Dr
El Paso, TX 79928
|
1,093 sq. feet
|
2 baths 3 beds |
show details |
| Photo | Address | Area | Beds / Baths | Price | Details |
|---|---|---|---|---|---|

|
#31
Bellrose Dr
El Paso, TX 79925
|
1,307 sq. feet
|
1 baths 3 beds |
show details | |

|
#32
Paseo Del Rey Dr
El Paso, TX 79936
|
2,493 sq. feet
|
3 baths 3 beds |
show details | |

|
#33
Ratner Cir
El Paso, TX 79936
|
1,746 sq. feet
|
2 baths 3 beds |
show details | |

|
#34
Honey Point Dr
El Paso, TX 79938
|
1,801 sq. feet
|
2 baths 3 beds |
show details | |

|
#35
Banner Run Dr
El Paso, TX 79936
|
1,873 sq. feet
|
2 baths 4 beds |
show details | |

|
#36
Regal Banner Ln
El Paso, TX 79936
|
1,248 sq. feet
|
2 baths 1 beds |
show details | |

|
#37
Idalia Ave
El Paso, TX 79930
|
1,170 sq. feet
|
2 baths 3 beds |
show details | |

|
#38
Sun Chariot Dr
El Paso, TX 79938
|
3,140 sq. feet
|
2 baths 3 beds |
show details | |

|
#39
Wood Quail Way
El Paso, TX 79936
|
1,559 sq. feet
|
3 baths 3 beds |
show details | |

|
#40
Tierra Morena Dr
El Paso, TX 79938
|
1,361 sq. feet
|
2 baths 4 beds |
show details |
| Photo | Address | Area | Beds / Baths | Price | Details |
|---|---|---|---|---|---|

|
#41
Moonlight Ave
El Paso, TX 79904
|
1,855 sq. feet
|
2 baths 4 beds |
show details | |

|
#42
Rathmore Dr
El Paso, TX 79928
|
2,652 sq. feet
|
2 baths 4 beds |
show details | |

|
#43
Delilah Ave
El Paso, TX 79927
|
784 sq. feet
|
1 baths 2 beds |
show details | |

|
#44
Redstone Ln
El Paso, TX 79924
|
1,539 sq. feet
|
2 baths 4 beds |
show details | |

|
#45
E Yandell Dr
El Paso, TX 79903
|
1,558 sq. feet
|
2 baths 3 beds |
show details | |

|
#46
Lee Starling Dr
El Paso, TX 79907
|
1,553 sq. feet
|
2 baths 3 beds |
show details | |

|
#47
Tania Dr
El Paso, TX 79927
|
812 sq. feet
|
1 baths 2 beds |
show details | |

|
#48
Mike Godwin Dr
El Paso, TX 79936
|
1,460 sq. feet
|
2 baths 4 beds |
show details | |

|
#49
Crest Gate Way
El Paso, TX 79936
|
1,701 sq. feet
|
2 baths 3 beds |
show details | |

|
Check over 1 million property listings on Foreclosure.com!
|
browse all offers | |||


 | Cost of Housing/Living in El Paso (3 replies) |
| DOG FREE APARTMENTS in EL PASO??? (2 replies) |
| Short term furnished apartments in El Paso (8 replies) |
| Thinking of Moving to El Paso from LA (safety, gun culture, crime) (57 replies) |
| AOL Real Estate: El Paso among 10 best cities to be a homeowner (0 replies) |
| El Paso impressions (25 replies) |
Median year apartment built: 1984
Household type by relationship:
Households: 677,469- Male householders: 120,333 (31,429 living alone), Female householders: 126,506 (35,683 living alone)
107,629 spouses (106,780 opposite-sex spouses), 14,911 unmarried partners, (14,478 opposite-sex unmarried partners), 232,514 children (216,173 natural, 3,089 adopted, 13,252 stepchildren), 24,122 grandchildren, 8,601 brothers or sisters, 11,929 parents, 119 foster children, 12,070 other relatives, 13,200 non-relatives
- In group quarters: 5,535
Size of family households: 56,374 2-persons, 48,640 3-persons, 33,624 4-persons, 17,799 5-persons, 7,033 6-persons, 3,346 7-or-more-persons.
Size of nonfamily households: 67,112 1-person, 11,565 2-persons, 687 3-persons, 359 4-persons, 300 5-persons.
92,034 married couples with children.
53,379 single-parent households (10,130 men, 43,249 women).
32.8% of residents of El Paso speak English at home.
64.6% of residents speak Spanish at home (62% speak English very well, 20% speak English well, 10% speak English not well, 7% don't speak English at all).
1.6% of residents speak other Indo-European language at home (82% speak English very well, 14% speak English well, 3% speak English not well, 1% don't speak English at all).
1.1% of residents speak Asian or Pacific Island language at home (68% speak English very well, 23% speak English well, 8% speak English not well, 2% don't speak English at all).
0.4% of residents speak other language at home (77% speak English very well, 21% speak English well, 3% speak English not well).
Foreign born population: 155,286 (22.9%)
(57.0% of them are naturalized citizens)
| Here: | 6.1 |
| State: | 6.3 |
| Here: | 4.1 |
| State: | 4.0 |
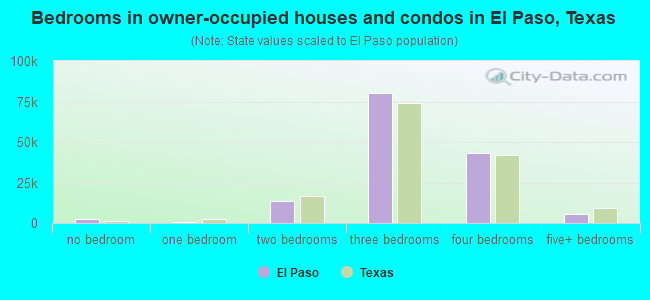
- Bedrooms in owner-occupied houses and condos in El Paso, Texas
- 2,206no bedroom
- 7111 bedroom
- 13,8002 bedrooms
- 80,4913 bedrooms
- 43,3584 bedrooms
- 5,3125+ bedrooms
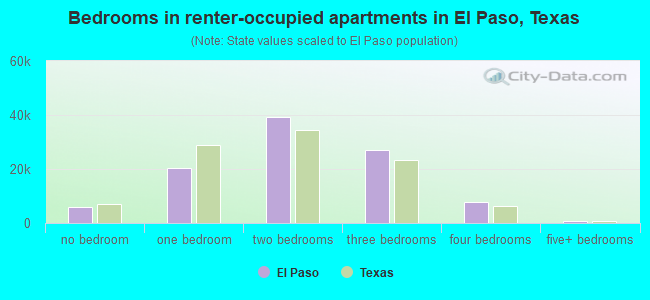
- Bedrooms in renter-occupied apartments in El Paso, Texas
- 5,941no bedroom
- 20,5421 bedroom
- 39,3472 bedrooms
- 26,8923 bedrooms
- 7,6714 bedrooms
- 5685+ bedrooms
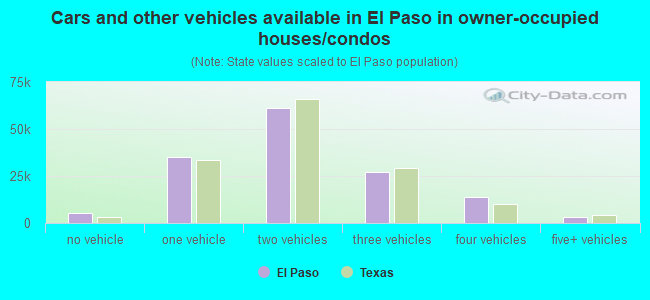
- Cars and other vehicles available in El Paso in owner-occupied houses/condos
- 5,326no vehicle
- 35,3711 vehicle
- 61,3222 vehicles
- 27,0013 vehicles
- 13,6064 vehicles
- 3,2525+ vehicles
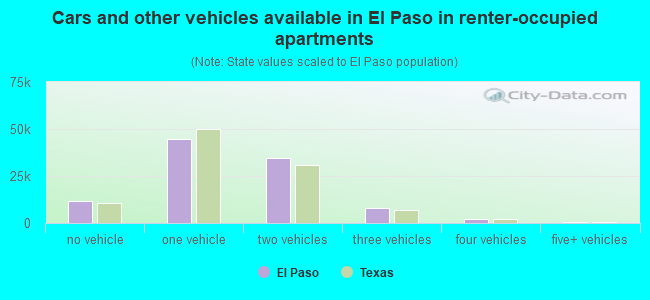
- Cars and other vehicles available in El Paso in renter-occupied apartments
- 11,700no vehicle
- 44,7151 vehicle
- 34,4752 vehicles
- 7,7853 vehicles
- 1,9794 vehicles
- 3075+ vehicles
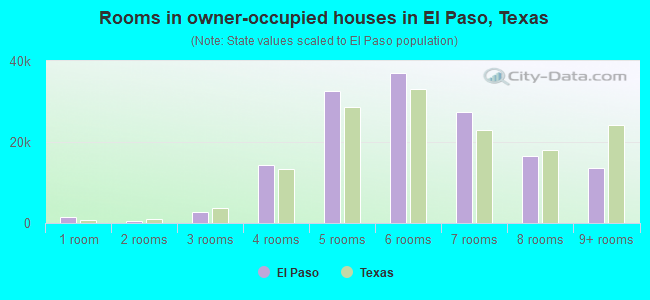
- Rooms in owner-occupied houses in El Paso, Texas
- 1,4291 room
- 4992 rooms
- 2,6173 rooms
- 14,2764 rooms
- 32,4725 rooms
- 37,0146 rooms
- 27,3577 rooms
- 16,5348 rooms
- 13,6809+ rooms
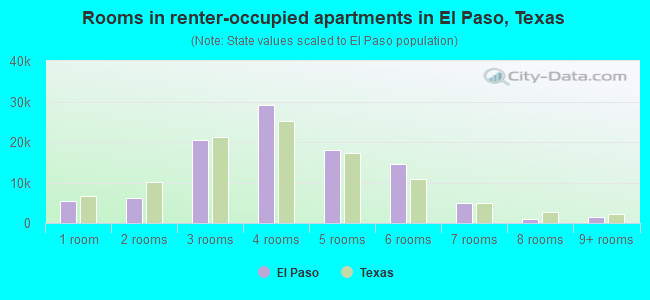
- Rooms in renter-occupied apartments in El Paso, Texas
- 5,4291 room
- 6,0792 rooms
- 20,4713 rooms
- 29,1234 rooms
- 18,0885 rooms
- 14,5236 rooms
- 4,9557 rooms
- 9108 rooms
- 1,3839+ rooms
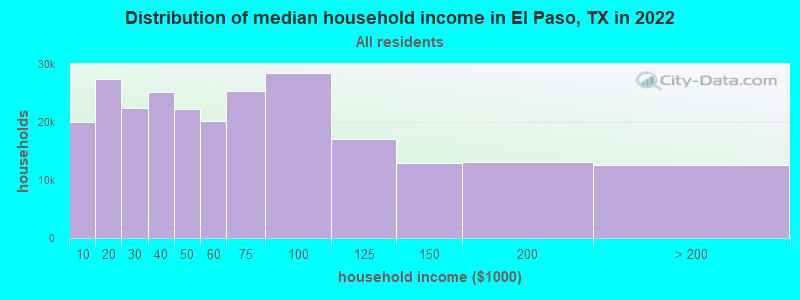
El Paso, TX household income distribution

- 20,016Less than $10,000
- 27,343$10,000 to $19,999
- 22,423$20,000 to $29,999
- 25,089$30,000 to $39,999
- 22,167$40,000 to $49,999
- 20,257$50,000 to $59,999
- 25,339$60,000 to $74,999
- 28,415$75,000 to $99,999
- 17,135$100,000 to $124,999
- 12,846$125,000 to $149,999
- 13,155$150,000 to $199,999
- 12,654$200,000 or more
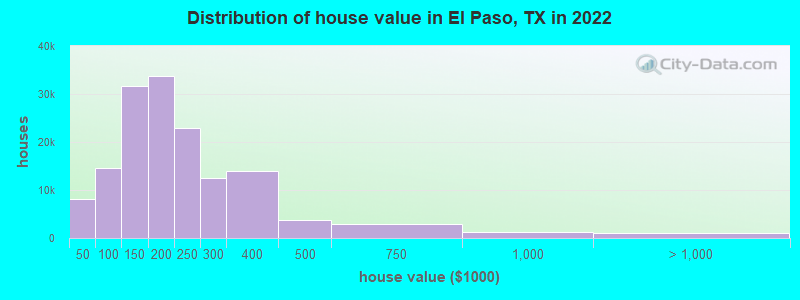
Home value of owner - occupied houses in 2022 in El Paso, TX
-
- 1,429Less than $10,000
- 1,793$10,000 to $14,999
- 1,983$15,000 to $19,999
- 1,097$20,000 to $24,999
- 315$25,000 to $29,999
- 478$30,000 to $34,999
- 450$35,000 to $39,999
- 671$40,000 to $49,999
- 689$50,000 to $59,999
- 307$60,000 to $69,999
- 2,353$70,000 to $79,999
- 5,606$80,000 to $89,999
- 4,943$90,000 to $99,999
- 14,814$100,000 to $124,999
- 16,827$125,000 to $149,999
- 18,121$150,000 to $174,999
- 15,703$175,000 to $199,999
- 22,820$200,000 to $249,999
- 12,501$250,000 to $299,999
- 14,040$300,000 to $399,999
- 3,755$400,000 to $499,999
- 2,897$500,000 to $749,999
- 1,185$750,000 to $999,999
- 435$1,000,000 to $1,499,999
- 666$2,000,000 or more
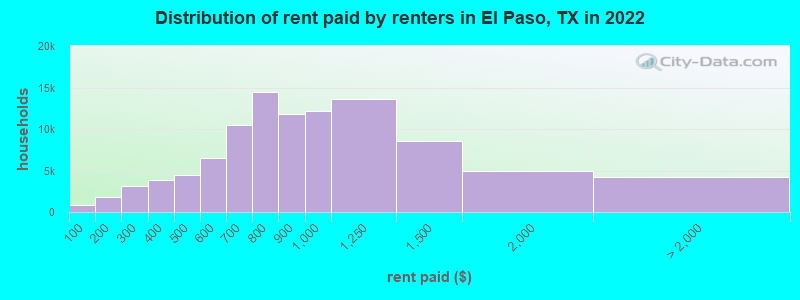
Rent paid by renters in 2022 in El Paso, TX
-
- 842Less than $100
- 538$100 to $149
- 1,299$150 to $199
- 1,688$200 to $249
- 1,496$250 to $299
- 1,342$300 to $349
- 2,472$350 to $399
- 2,241$400 to $449
- 2,159$450 to $499
- 3,612$500 to $549
- 2,902$550 to $599
- 5,859$600 to $649
- 4,636$650 to $699
- 5,763$700 to $749
- 8,700$750 to $799
- 11,807$800 to $899
- 12,219$900 to $999
- 13,658$1,000 to $1,249
- 8,523$1,250 to $1,499
- 4,947$1,500 to $1,999
- 197$2,000 to $2,499
- 181$3,000 to $3,499
- 68$3,500 or more
- 3,812No cash rent

Percentage of workers working in this county: 93.3%
Number of people working at home: 27,988 (9.2% of all workers)

Travel time to work (commute)
- Less than 5 minutes: 2,865
- 5 to 9 minutes: 19,092
- 10 to 14 minutes: 36,067
- 15 to 19 minutes: 52,795
- 20 to 24 minutes: 53,227
- 25 to 29 minutes: 24,739
- 30 to 34 minutes: 45,338
- 35 to 39 minutes: 5,118
- 40 to 44 minutes: 12,753
- 45 to 59 minutes: 12,671
- 60 to 89 minutes: 6,276
- 90 or more minutes: 4,819

Means of transportation to work:
- Drove a car alone: 232,907 (75.3%)
- Carpooled: 38,509 (12.5%)
- Bus: 1,773 (0.6%)
- Taxi: 4,518 (1.5%)
- Bicycle: 124 (0.0%)
- Walked: 3,438 (1.1%)
- Worked at home: 27,988 (9.1%)
- Unemployment by race in 2022
- Unemployment rate for White non-Hispanic residents
- 5.0%Males
- 4.1%Females
- Unemployment rate for Black residents
- 18.0%Males
- 3.5%Females
- Unemployment rate for American Indian and Alaska Native residents
- 8.9%Males
- 2.0%Females
- Unemployment rate for Asian residents
- 18.7%Males
- Unemployment rate for other race residents
- 6.7%Males
- 3.3%Females
- Unemployment rate for two or more race residents
- 7.1%Males
- 5.9%Females
- Unemployment rate for Hispanic or Latino residents
- 6.4%Males
- 4.9%Females
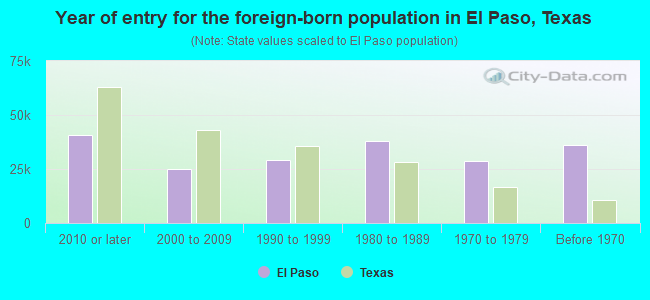
- Year of entry for the foreign-born population in El Paso, Texas
- 40,5202010 or later
- 25,1662000 to 2009
- 29,0881990 to 1999
- 37,8261980 to 1989
- 28,7181970 to 1979
- 36,286Before 1970
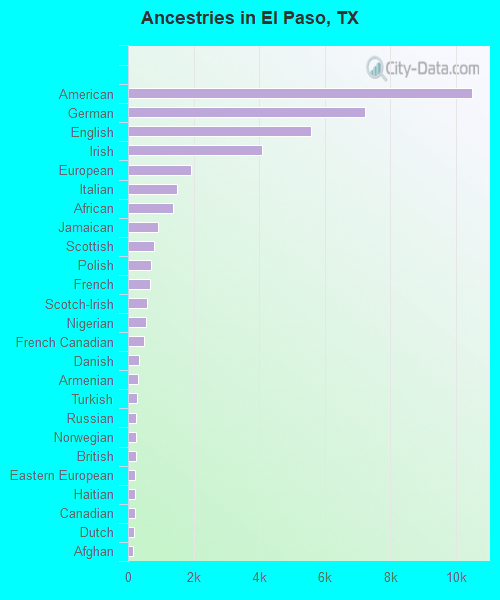
First ancestries reported:
- American: 10,494 (2.1%)
- German: 7,224 (1.5%)
- English: 5,585 (1.1%)
- Irish: 4,082 (0.8%)
- European: 1,938 (0.4%)
- Italian: 1,510 (0.3%)
- African: 1,371 (0.3%)
- Jamaican: 927 (0.2%)
- Scottish: 784 (0.2%)
- Polish: 701 (0.1%)
- French: 664 (0.1%)
- Scotch-Irish: 565 (0.1%)
- Nigerian: 541 (0.1%)
- French Canadian: 493 (0.10%)
- Danish: 346 (0.07%)
- Armenian: 296 (0.06%)
- Turkish: 285 (0.06%)
- Russian: 253 (0.05%)
- Norwegian: 236 (0.05%)
- British: 236 (0.05%)
- Eastern European: 205 (0.04%)
- Haitian: 203 (0.04%)
- Canadian: 203 (0.04%)
- Dutch: 188 (0.04%)
- Afghan: 158 (0.03%)
- Ghanaian: 151 (0.03%)
- Finnish: 143 (0.03%)
- Austrian: 138 (0.03%)
- Lebanese: 135 (0.03%)
- Welsh: 131 (0.03%)
- Iranian: 124 (0.03%)
- Senegalese: 124 (0.03%)
- Portuguese: 120 (0.02%)
- Czech: 113 (0.02%)
- Greek: 111 (0.02%)
- Northern European: 109 (0.02%)
- Syrian: 98 (0.02%)
- Hungarian: 98 (0.02%)
- Scandinavian: 96 (0.02%)
- Swedish: 88 (0.02%)
- Ethiopian: 85 (0.02%)
- Czechoslovakian: 83 (0.02%)
- Cajun: 68 (0.01%)
- Yugoslavian: 66 (0.01%)
- West Indian: 66 (0.01%)
- Brazilian: 61 (0.01%)
- Moroccan: 58 (0.01%)
- Jordanian: 57 (0.01%)
- Basque: 53 (0.01%)
- Trinidadian and Tobagonian: 50 (0.01%)
- Egyptian: 45 (0.01%)
- Barbadian: 45 (0.01%)
- Ukrainian: 42 (0.01%)
- Swiss: 39 (0.01%)
- Ugandan: 35 (0.01%)
- Lithuanian: 33 (0.01%)
- Slovene: 26 (0.01%)
Most common places of birth for foreign-born residents (%):
| El Paso: | 83.3% (132,283) |
| Texas: | 48.4% (2,411,723) |
Place of birth for U.S.-born residents:
- This state: 400,030
- Other state: 106,104
- Northeast: 9,562
- Midwest: 19,274
- South: 25,102
- West: 52,166
87.6% of El Paso residents lived in the same house 1 years ago.
Out of people who lived in different houses, 42.3% lived in this county.
Out of people who lived in different counties, 20.3% lived in Texas.
| El Paso: | 87.6% |
| State average: | 85.7% |
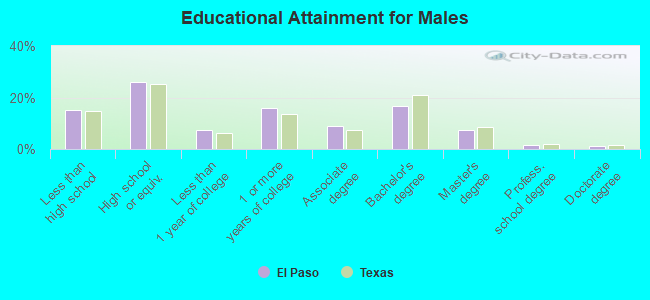
Education attainment for males 25 years and older:
- No schooling: 6,268
- Nursery to 4th grade: 1,870
- 5th and 6th grade: 6,327
- 7th and 8th grade: 2,547
- 9th grade: 3,841
- 10th grade: 2,514
- 11th grade: 3,064
- 12th grade, no diploma: 5,003
- High school graduate (or equivalency): 54,548
- Less than 1 year of college: 15,047
- Some college more than 1 year, no degree: 33,027
- Associate degree: 19,050
- Bachelor's degree: 34,949
- Master's degree: 15,349
- Professional school degree: 3,453
- Doctorate degree: 2,398
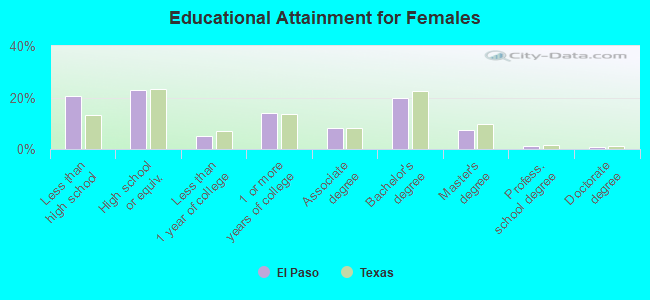
Education attainment for females 25 years and older:
- No schooling: 9,133
- Nursery to 4th grade: 3,285
- 5th and 6th grade: 10,884
- 7th and 8th grade: 5,307
- 9th grade: 4,641
- 10th grade: 3,604
- 11th grade: 2,600
- 12th grade, no diploma: 6,913
- High school graduate (or equivalency): 51,616
- Less than 1 year of college: 11,248
- Some college more than 1 year, no degree: 31,927
- Associate degree: 18,243
- Bachelor's degree: 44,787
- Master's degree: 16,885
- Professional school degree: 2,518
- Doctorate degree: 1,708
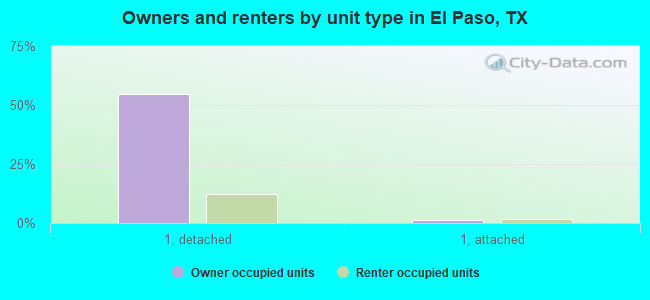
Housing units in structures:
- One, detached: 175,328
- One, attached: 8,503
- Two: 6,346
- 3 or 4: 13,489
- 5 to 9: 18,177
- 10 to 19: 15,090
- 20 to 49: 10,531
- 50 or more: 11,192
- Mobile homes: 7,793
- Boats, RVs, vans, etc.: 464
Median worth of mobile homes: $22,200
Housing units lacking complete kitchen facilities in 2022: 2.2%
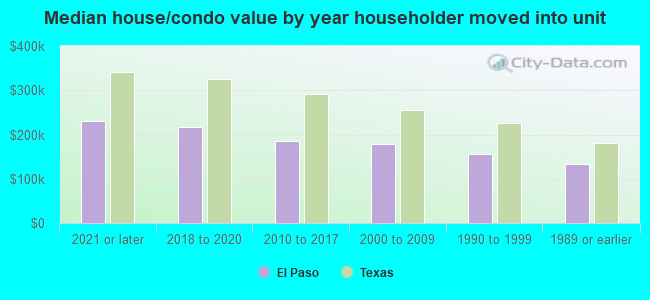
House/condo owner moved in on average 13 years ago
Renter moved in on average 2 years ago
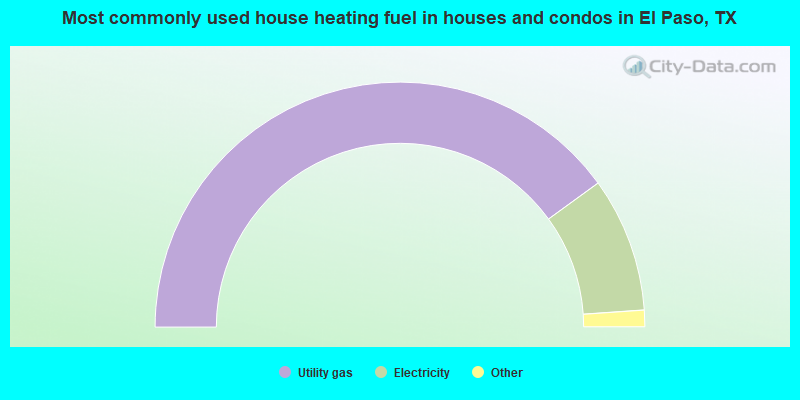
- 80.0%Utility gas
- 17.8%Electricity
- 1.3%Bottled, tank, or LP gas
- 0.5%Solar energy
- 0.2%No fuel used
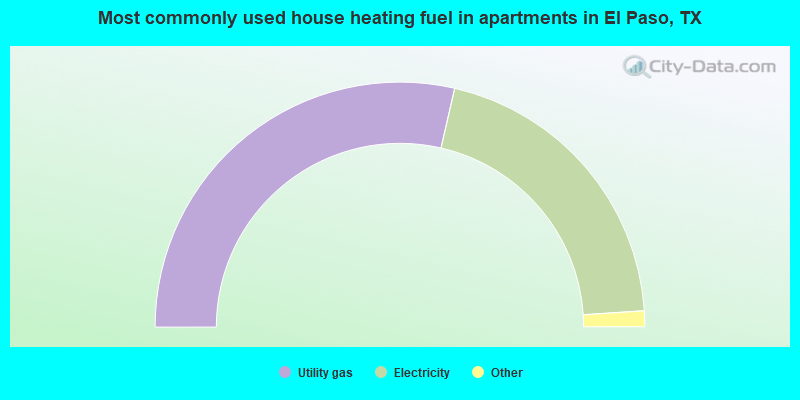
- 57.2%Utility gas
- 40.7%Electricity
- 1.3%Bottled, tank, or LP gas
- 0.4%No fuel used
- 0.2%Solar energy
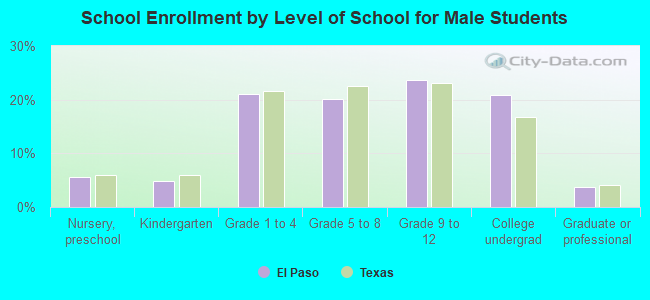
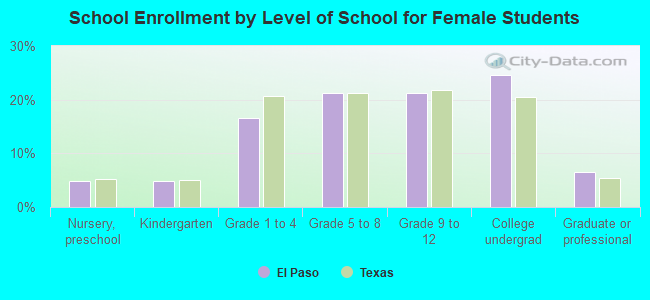
Private vs. public school enrollment:
| Here: | 6.6% |
| Texas: | 8.8% |
| Here: | 4.1% |
| Texas: | 8.0% |
| Here: | 10.5% |
| Texas: | 16.2% |