Housing density: 2,359 houses/condos per square mile
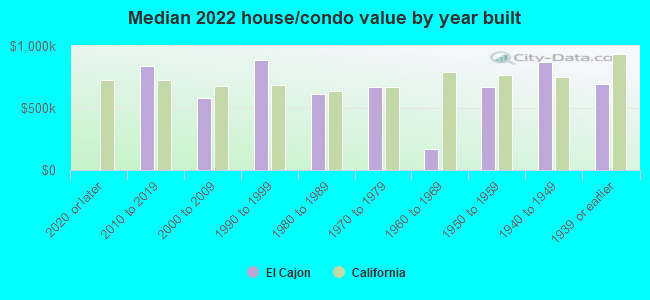
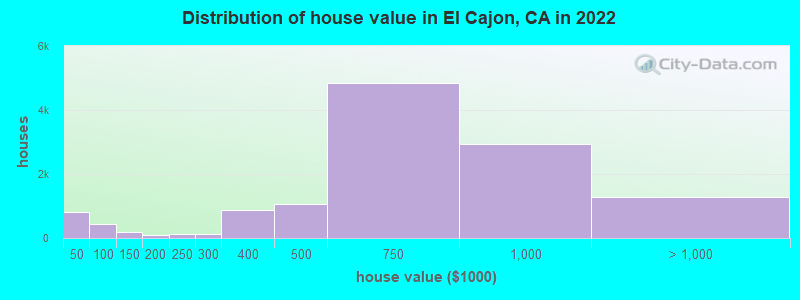
Median price asked for vacant for-sale houses and condos in 2022: $1,057,624.
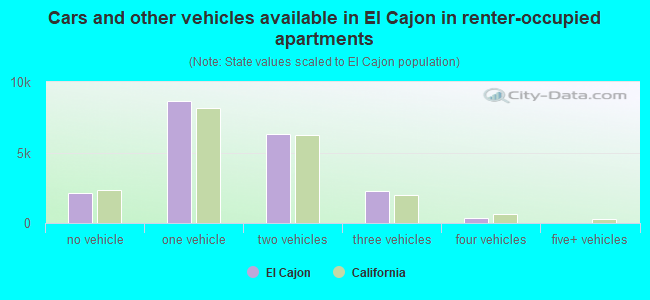
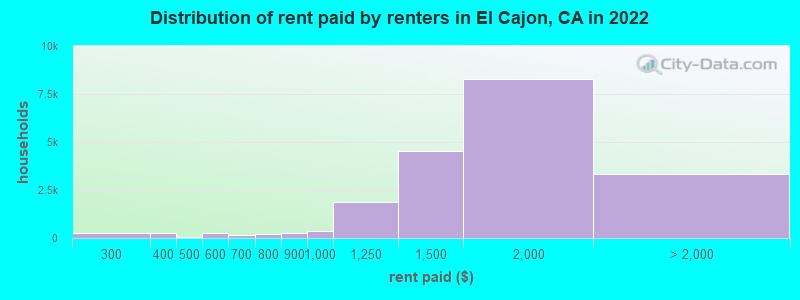
Median contract rent in 2022: $1,566 (lower quartile is $1,315, upper quartile is $1,866)
Median rent asked for vacant for-rent units in 2022: $1,631
Median gross rent in El Cajon, CA in 2022: $1,673
Housing units in El Cajon with a mortgage: 10,369 (993 second mortgage, 4 home equity loan, 873 both second mortgage and home equity loan) Houses without a mortgage: 232
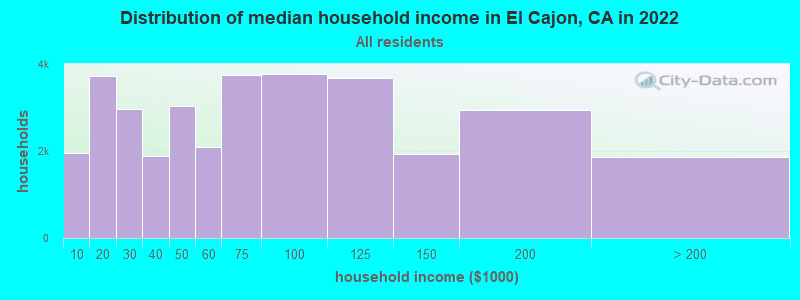
Median household income for houses/condos with a mortgage: $122,401
Median household income for apartments without a mortgage: $56,439
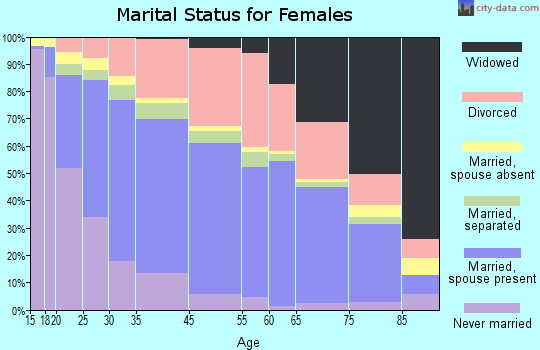
18,861 married couples with children.
4,755 single-parent households (1,292 men, 3,463 women).
51.2% of residents of El Cajon speak English at home.
25.9% of residents speak Spanish at home (62% speak English very well, 21% speak English well, 12% speak English not well, 5% don't speak English at all).
5.2% of residents speak other Indo-European language at home (43% speak English very well, 34% speak English well, 16% speak English not well, 7% don't speak English at all).
2.0% of residents speak Asian or Pacific Island language at home (81% speak English very well, 6% speak English well, 8% speak English not well, 5% don't speak English at all).
15.8% of residents speak other language at home (39% speak English very well, 32% speak English well, 21% speak English not well, 8% don't speak English at all).
Foreign born population: 29,137 (27.9%)
(61.6% of them are naturalized citizens)
Percentage of workers working in this county: 99.1% Number of people working at home: 5,154 (11.0% of all workers)
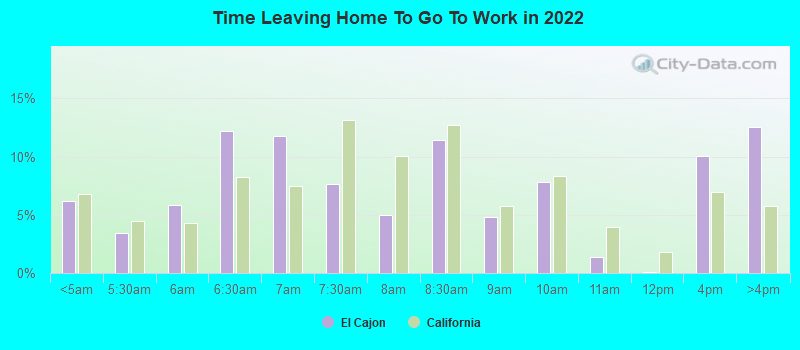
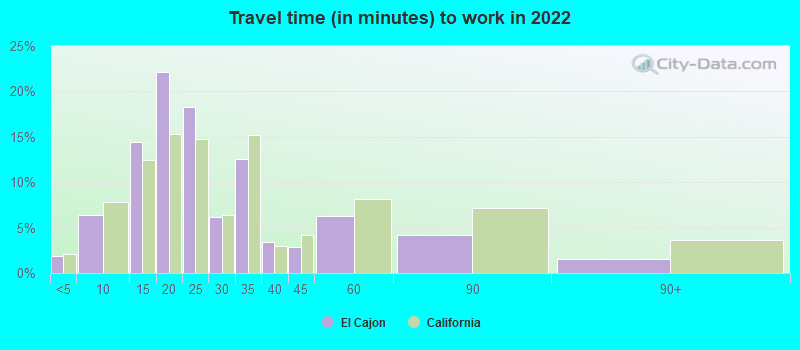
Travel time to work (commute)
Less than 5 minutes: 185
5 to 9 minutes: 1,556
10 to 14 minutes: 4,916
15 to 19 minutes: 6,958
20 to 24 minutes: 6,846
25 to 29 minutes: 2,598
30 to 34 minutes: 7,548
35 to 39 minutes: 2,746
40 to 44 minutes: 1,187
45 to 59 minutes: 2,091
60 to 89 minutes: 1,102
90 or more minutes: 792
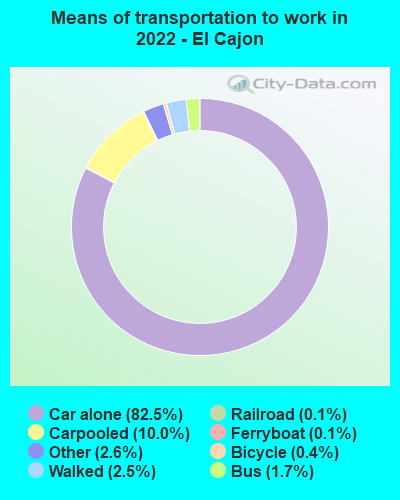
Means of transportation to work:
Drove a car alone: 31,447 (71.1%)
Carpooled: 3,965 (9.0%)
Bus: 607 (1.4%)
Long-distance train or commuter rail: 14 (0.0%)
Light rail, streetcar or trolley: 49 (0.1%)
Ferryboat: 34 (0.1%)
Taxi: 1,031 (2.3%)
Bicycle: 159 (0.4%)
Walked: 1,052 (2.4%)
Worked at home: 5,154 (11.7%)
Unemployment by race in 2022
Unemployment rate for White non-Hispanic residents
8.7%Males
9.2%Females
Unemployment rate for Black residents
3.9%Males
3.4%Females
Unemployment rate for Asian residents
10.2%Males
6.2%Females
Unemployment rate for other race residents
8.4%Males
18.2%Females
Unemployment rate for two or more race residents
13.5%Males
3.7%Females
Unemployment rate for Hispanic or Latino residents
8.8%Males
9.3%Females
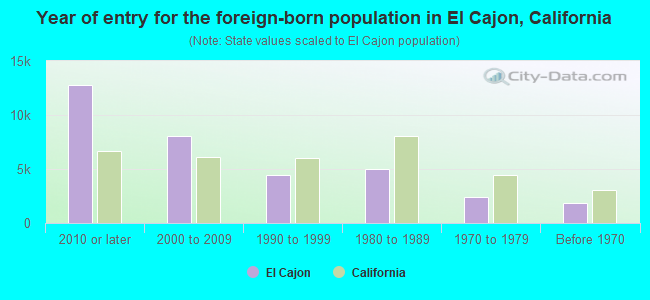
Year of entry for the foreign-born population in El Cajon, California
12,7692010 or later
8,0142000 to 2009
4,4801990 to 1999
4,9911980 to 1989
2,3891970 to 1979
1,870Before 1970
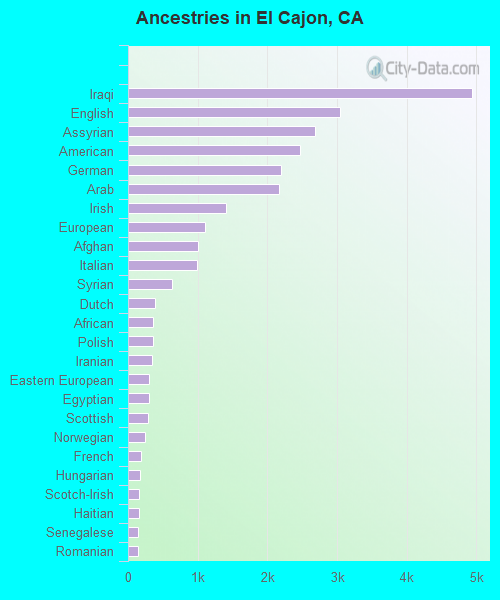
First ancestries reported:
Iraqi: 4,934 (8.2%)
English: 3,036 (5.1%)
Assyrian: 2,687 (4.5%)
American: 2,468 (4.1%)
German: 2,193 (3.7%)
Arab: 2,166 (3.6%)
Irish: 1,403 (2.3%)
European: 1,107 (1.8%)
Afghan: 1,003 (1.7%)
Italian: 994 (1.7%)
Syrian: 638 (1.1%)
Dutch: 382 (0.6%)
African: 357 (0.6%)
Polish: 356 (0.6%)
Iranian: 340 (0.6%)
Eastern European: 301 (0.5%)
Egyptian: 300 (0.5%)
Scottish: 290 (0.5%)
Norwegian: 242 (0.4%)
French: 180 (0.3%)
Hungarian: 168 (0.3%)
Scotch-Irish: 161 (0.3%)
Haitian: 156 (0.3%)
Senegalese: 145 (0.2%)
Romanian: 141 (0.2%)
Northern European: 139 (0.2%)
Brazilian: 138 (0.2%)
Scandinavian: 127 (0.2%)
Swedish: 126 (0.2%)
Ethiopian: 120 (0.2%)
Jordanian: 118 (0.2%)
Portuguese: 118 (0.2%)
Lithuanian: 114 (0.2%)
Russian: 109 (0.2%)
Welsh: 107 (0.2%)
French Canadian: 93 (0.2%)
Danish: 92 (0.2%)
Sudanese: 80 (0.1%)
Jamaican: 78 (0.1%)
Canadian: 68 (0.1%)
Ukrainian: 62 (0.1%)
Czech: 58 (0.10%)
West Indian: 56 (0.09%)
British: 53 (0.09%)
Bulgarian: 53 (0.09%)
Greek: 45 (0.08%)
Turkish: 38 (0.06%)
Palestinian: 35 (0.06%)
Lebanese: 33 (0.06%)
Armenian: 32 (0.05%)
Kenyan: 26 (0.04%)
Belgian: 21 (0.04%)
Basque: 19 (0.03%)
Yugoslavian: 13 (0.02%)
Pennsylvania German: 12 (0.02%)
Czechoslovakian: 12 (0.02%)
Slovak: 12 (0.02%)
Nigerian: 7 (0.01%)
Latvian: 6 (0.01%)
Austrian: 5 (0.01%)
Belizean: 3 (0.01%)
Most common places of birth for foreign-born residents (%):
Iraq
El Cajon:
41.6% (12,496)
California:
0.4% (40,941)
Mexico
El Cajon:
28.4% (8,519)
California:
37.2% (3,881,193)
Afghanistan
El Cajon:
3.9% (1,165)
California:
0.5% (53,260)
Philippines
El Cajon:
3.6% (1,084)
California:
7.8% (818,297)
Syria
El Cajon:
3.4% (1,028)
California:
0.3% (30,949)
Vietnam
El Cajon:
1.8% (555)
California:
4.9% (512,335)
Place of birth for U.S.-born residents:
This state: 54,851
Other state: 18,435
Northeast: 3,404
Midwest: 5,486
South: 5,648
West: 3,897
88.8% of El Cajon residents lived in the same house 1 years ago. Out of people who lived in different houses, 40.9% lived in this county. Out of people who lived in different counties, 36.9% lived in California.
El Cajon:
88.8%
State average:
88.9%
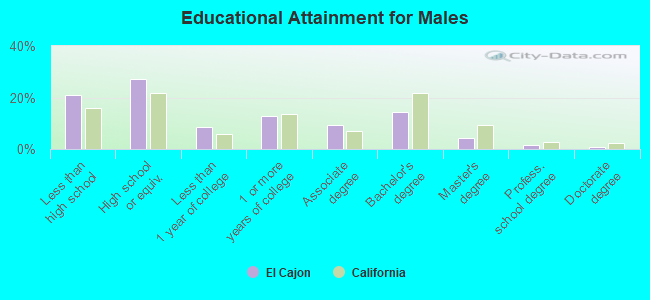
Education attainment for males 25 years and older:
No schooling: 1,741
Nursery to 4th grade: 259
5th and 6th grade: 555
7th and 8th grade: 755
9th grade: 110
10th grade: 1,403
11th grade: 975
12th grade, no diploma: 1,083
High school graduate (or equivalency): 8,986
Less than 1 year of college: 2,854
Some college more than 1 year, no degree: 4,213
Associate degree: 3,133
Bachelor's degree: 4,810
Master's degree: 1,476
Professional school degree: 530
Doctorate degree: 219
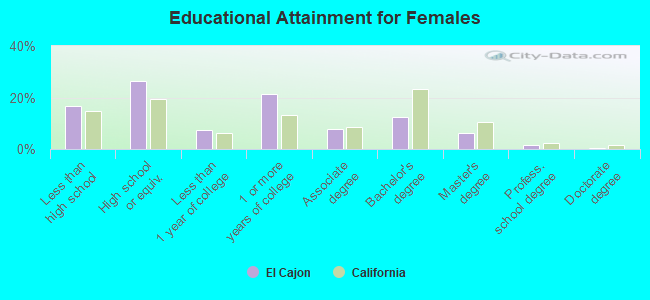
Education attainment for females 25 years and older:
No schooling: 1,689
Nursery to 4th grade: 610
5th and 6th grade: 773
7th and 8th grade: 60
9th grade: 396
10th grade: 90
11th grade: 1,080
12th grade, no diploma: 1,288
High school graduate (or equivalency): 9,460
Less than 1 year of college: 2,687
Some college more than 1 year, no degree: 7,661
Associate degree: 2,742
Bachelor's degree: 4,466
Master's degree: 2,287
Professional school degree: 512
Doctorate degree: 72
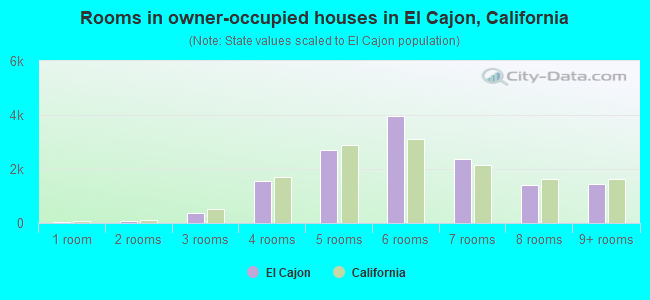
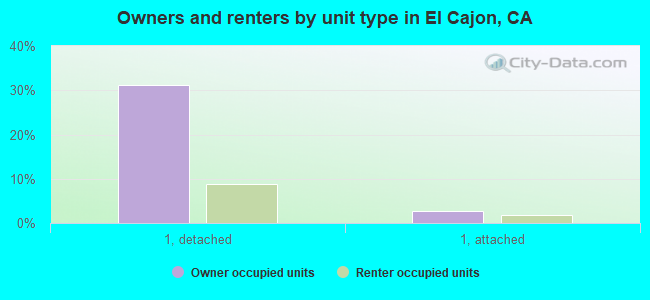
Housing units in structures:
One, detached: 13,276
One, attached: 2,152
Two: 491
3 or 4: 2,145
5 to 9: 1,732
10 to 19: 3,643
20 to 49: 5,389
50 or more: 3,598
Mobile homes: 1,599
Boats, RVs, vans, etc.: 345
Median worth of mobile homes: $73,300
Housing units lacking complete kitchen facilities in 2022: 1.0%
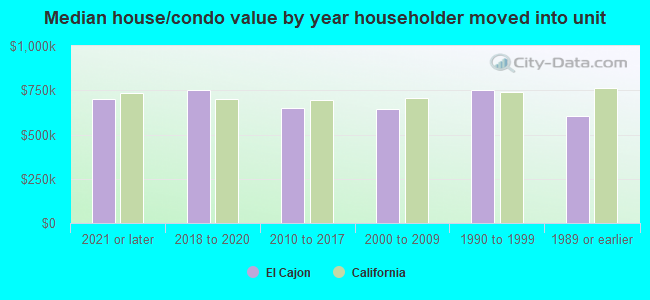
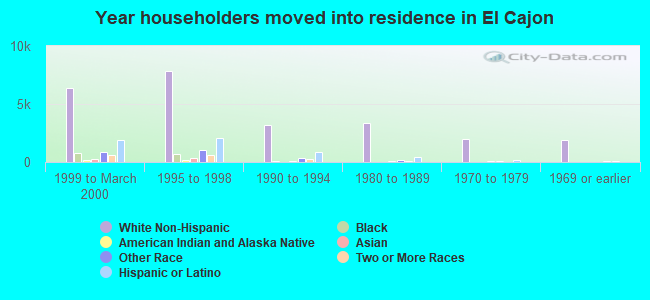
House/condo owner moved in on average 13 years ago