Easton, MD (Maryland) Houses and Residents
| Easton: | $343,172 |
| Maryland: | $398,100 |
Total population: 16,675 (Urban population: 11,252 (all inside urban clusters), Rural population: 303 (all nonfarm))
Houses: 7,753 (7,274 occupied: 4,346 owner occupied, 3,027 renter occupied)
| % of renters here: | 41% |
| State: | 32% |
Housing density: 753 houses/condos per square mile
Median price asked for vacant for-sale houses and condos in 2022: $296,968.
Median contract rent in 2022: $931 (lower quartile is $673, upper quartile is $1,371)
Median rent asked for vacant for-rent units in 2022: $1,866
Median gross rent in Easton, MD in 2022: $1,118
Housing units in Easton with a mortgage: 2,767 (284 second mortgage, 0 home equity loan, 203 both second mortgage and home equity loan)
Houses without a mortgage: 85
Median household income for houses/condos with a mortgage: $106,587
Median household income for apartments without a mortgage: $67,065
Median monthly housing costs: $1,222
Compare current foreclosures near Easton, MD:
| Photo | Address | Area | Beds / Baths | Price | Details |
|---|---|---|---|---|---|

|
#1
Lincoln Ct
Easton, MD 21601
|
2,240 sq. feet
|
2 baths - beds |
show details | |

|
#2
Wye Oak St
Easton, MD 21601
|
2,060 sq. feet
|
2 baths - beds |
show details | |

|
#3
Gannon Cir
Easton, MD 21601
|
1,856 sq. feet
|
2 baths - beds |
show details | |

|
#4
Longwoods Rd
Easton, MD 21601
|
2,266 sq. feet
|
3 baths - beds |
show details | |

|
#5
Liberty Ln
Easton, MD 21601
|
1,732 sq. feet
|
3 baths - beds |
show details | |

|
#6
Tour Dr
Easton, MD 21601
|
1,756 sq. feet
|
2 baths - beds |
show details | |

|
#7
Petunia Dr
Easton, MD 21601
|
2,200 sq. feet
|
1 baths - beds |
show details | |

|
#8
Colony Cir
Easton, MD 21601
|
1,920 sq. feet
|
2 baths - beds |
show details | |

|
#9
South St
Easton, MD 21601
|
864 sq. feet
|
1 baths - beds |
show details | |

|
#10
Pleasant Aly
Easton, MD 21601
|
1,008 sq. feet
|
1 baths - beds |
show details |
| Photo | Address | Area | Beds / Baths | Price | Details |
|---|---|---|---|---|---|

|
#11
Penny Ln
Easton, MD 21601
|
1,520 sq. feet
|
2 baths - beds |
show details | |

|
#12
Waverly Rd
Easton, MD 21601
|
2,102 sq. feet
|
1 baths - beds |
show details | |

|
#13
Village St Apt 60
Easton, MD 21601
|
- sq. feet
|
- baths - beds |
show details | |

|
#14
Standish St
Easton, MD 21601
|
- sq. feet
|
- baths - beds |
show details | |

|
#15
Newnam Rd Ste 12
Easton, MD 21601
|
- sq. feet
|
- baths - beds |
show details | |

|
#16
Chapel Rd
Easton, MD 21601
|
- sq. feet
|
- baths - beds |
show details | |

|
#17
Port St Unit 1
Easton, MD 21601
|
- sq. feet
|
- baths - beds |
show details | |

|
#18
Brant Ct # 218
Easton, MD 21601
|
- sq. feet
|
- baths - beds |
show details | |

|
#19
Matthewstown Rd
Easton, MD 21601
|
- sq. feet
|
- baths - beds |
show details | |

|
#20
Skipton Cordova Rd
Cordova, MD 21625
|
1,256 sq. feet
|
2 baths 2 beds |
$128,250
|
show details |
| Photo | Address | Area | Beds / Baths | Price | Details |
|---|---|---|---|---|---|

|
#21
W Central Ave
Federalsburg, MD 21632
|
1,670 sq. feet
|
1 baths 4 beds |
show details | |

|
#22
Marsh Creek Rd
Preston, MD 21655
|
- sq. feet
|
1 baths 2 beds |
show details | |

|
#23
Hynson Rd
Hurlock, MD 21643
|
- sq. feet
|
2 baths 3 beds |
show details | |

|
#24
Beaver Neck Village Rd
Linkwood, MD 21835
|
1,344 sq. feet
|
2 baths 3 beds |
show details | |

|
#25
Lednum Ave
Preston, MD 21655
|
- sq. feet
|
2 baths 3 beds |
show details | |

|
#26
S Main St
Hurlock, MD 21643
|
1,757 sq. feet
|
2 baths - beds |
show details | |

|
#27
Race St
Cambridge, MD 21613
|
1,495 sq. feet
|
2 baths - beds |
show details | |

|
#28
Lister Ln
Ridgely, MD 21660
|
2,448 sq. feet
|
2 baths - beds |
show details | |

|
#29
Mill St
Secretary, MD 21664
|
- sq. feet
|
2 baths - beds |
show details | |

|
#30
Evergreen Rd
Oxford, MD 21654
|
1,232 sq. feet
|
2 baths - beds |
show details |
| Photo | Address | Area | Beds / Baths | Price | Details |
|---|---|---|---|---|---|

|
#31
Belle Aire Rd
East New Market, MD 21631
|
1,583 sq. feet
|
1 baths - beds |
show details | |

|
#32
Chapel Rd
Cordova, MD 21625
|
1,160 sq. feet
|
1 baths - beds |
show details | |

|
#33
Central Ave
Cambridge, MD 21613
|
948 sq. feet
|
1 baths - beds |
show details | |

|
#34
Whitehouse Dr
Grasonville, MD 21638
|
960 sq. feet
|
1 baths - beds |
show details | |

|
#35
Commerce St
Hurlock, MD 21643
|
1,040 sq. feet
|
1 baths - beds |
show details | |

|
#36
Robbins St
Cambridge, MD 21613
|
1,248 sq. feet
|
1 baths - beds |
show details | |

|
#37
Whitehouse Dr
Grasonville, MD 21638
|
1,890 sq. feet
|
3 baths - beds |
show details | |

|
#38
Collins Ave
Hurlock, MD 21643
|
974 sq. feet
|
1 baths - beds |
show details | |

|
#39
Slippery Hill Ln
Queenstown, MD 21658
|
1,490 sq. feet
|
2 baths - beds |
show details | |

|
#40
Center St
Cambridge, MD 21613
|
576 sq. feet
|
1 baths - beds |
show details |
| Photo | Address | Area | Beds / Baths | Price | Details |
|---|---|---|---|---|---|

|
#41
Caribbean Ave
Cambridge, MD 21613
|
3,023 sq. feet
|
2 baths - beds |
show details | |

|
#42
Preston Rd
Federalsburg, MD 21632
|
2,144 sq. feet
|
2 baths - beds |
show details | |

|
#43
River Rd
Hurlock, MD 21643
|
1,664 sq. feet
|
2 baths - beds |
show details | |

|
#44
Wood Duck Dr
Cambridge, MD 21613
|
2,420 sq. feet
|
2 baths - beds |
show details | |

|
#45
Dorchester Ave
Cambridge, MD 21613
|
1,852 sq. feet
|
2 baths - beds |
show details | |

|
#46
Everlea Ct
Preston, MD 21655
|
1,344 sq. feet
|
2 baths - beds |
show details | |

|
#47
Wilson Rd
Grasonville, MD 21638
|
1,390 sq. feet
|
2 baths - beds |
show details | |

|
#48
Payne Rd
Hurlock, MD 21643
|
1,404 sq. feet
|
2 baths - beds |
show details | |

|
#49
Arrowhead Dr
Hurlock, MD 21643
|
1,596 sq. feet
|
2 baths - beds |
show details | |

|
Check over 1 million property listings on Foreclosure.com!
|
browse all offers | |||

Latest news about housing in Easton, MD collected exclusively by city-data.com from local newspapers, TV, and radio stations

 | Easton, MD area for young professionals (2 replies) |
| Easton area- near township (0 replies) |
| Need Vacation Home Advice! (2 replies) |
| Areas Near Annapolis to Retire? (36 replies) |
| Retirement on Eastern Shore (5 replies) |
| Relocating through current job to Hurlock, looking for suitable area to live. (3 replies) |
Median year apartment built: 1981
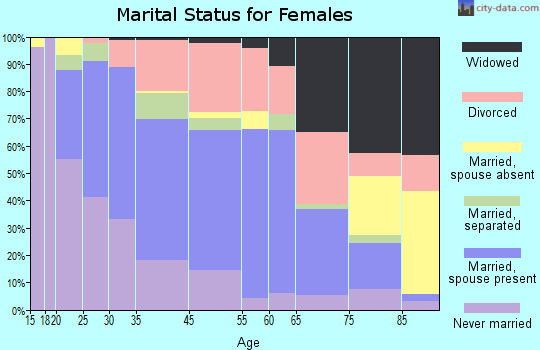
Household type by relationship:
Households: 17,126- Male householders: 3,398 (887 living alone), Female householders: 3,799 (1,868 living alone)
2,995 spouses (2,972 opposite-sex spouses), 480 unmarried partners, (480 opposite-sex unmarried partners), 4,481 children (4,192 natural, 209 adopted, 80 stepchildren), 598 grandchildren, 82 brothers or sisters, 69 parents, 0 foster children, 88 other relatives, 713 non-relatives
- In group quarters: 420
Size of family households: 2,123 2-persons, 764 3-persons, 811 4-persons, 183 5-persons, 80 6-persons, 85 7-or-more-persons.
Size of nonfamily households: 2,880 1-person, 332 2-persons, 131 3-persons, 7 4-persons, 27 7-or-more-persons.
2,335 married couples with children.
736 single-parent households (99 men, 637 women).
87.2% of residents of Easton speak English at home.
9.4% of residents speak Spanish at home (37% speak English very well, 21% speak English well, 38% speak English not well, 4% don't speak English at all).
3.1% of residents speak other Indo-European language at home (66% speak English very well, 33% speak English well, 2% speak English not well).
0.8% of residents speak Asian or Pacific Island language at home (84% speak English very well, 16% speak English not well).
Foreign born population: 1,777 (10.4%)
(37.2% of them are naturalized citizens)
| Here: | 7.0 |
| State: | 7.3 |
| Here: | 4.1 |
| State: | 4.2 |
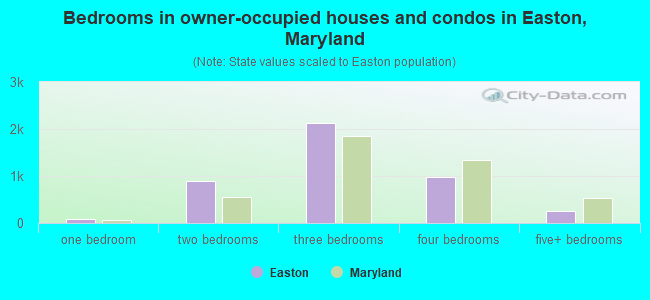
- Bedrooms in owner-occupied houses and condos in Easton, Maryland
- 0no bedroom
- 781 bedroom
- 8852 bedrooms
- 2,1353 bedrooms
- 9894 bedrooms
- 2605+ bedrooms
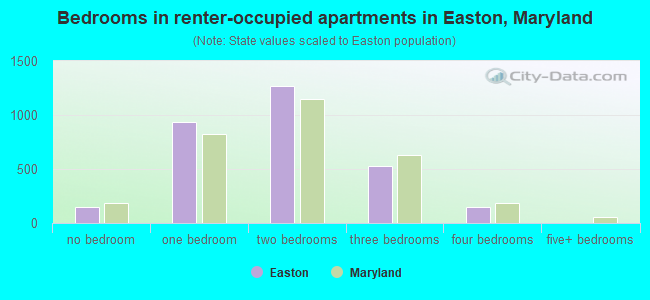
- Bedrooms in renter-occupied apartments in Easton, Maryland
- 145no bedroom
- 9351 bedroom
- 1,2702 bedrooms
- 5293 bedrooms
- 1504 bedrooms
- 05+ bedrooms
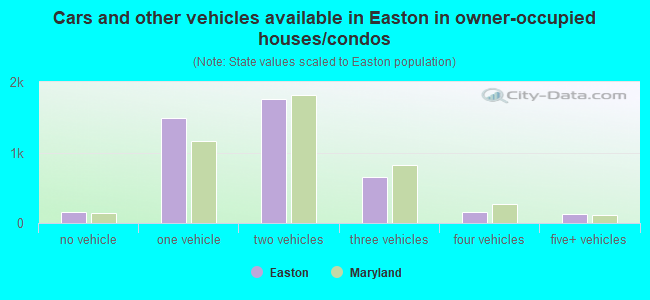
- Cars and other vehicles available in Easton in owner-occupied houses/condos
- 158no vehicle
- 1,4941 vehicle
- 1,7552 vehicles
- 6523 vehicles
- 1624 vehicles
- 1265+ vehicles
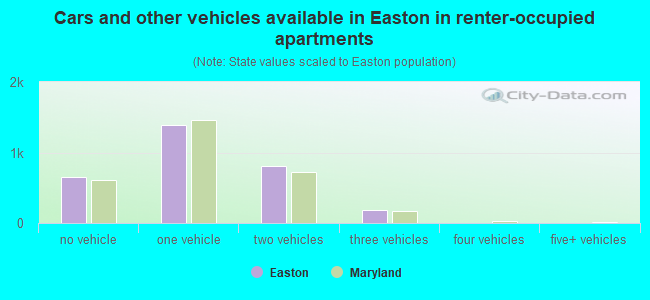
- Cars and other vehicles available in Easton in renter-occupied apartments
- 648no vehicle
- 1,3841 vehicle
- 8062 vehicles
- 1883 vehicles
- 34 vehicles
- 05+ vehicles
- Rooms in owner-occupied houses in Easton, Maryland
- 01 room
- 92 rooms
- 833 rooms
- 2524 rooms
- 6685 rooms
- 8226 rooms
- 7477 rooms
- 7058 rooms
- 1,0609+ rooms
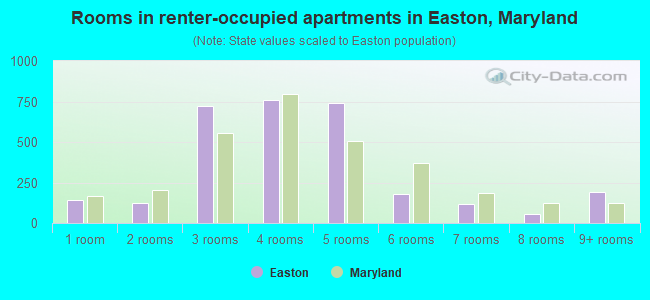
- Rooms in renter-occupied apartments in Easton, Maryland
- 1451 room
- 1222 rooms
- 7213 rooms
- 7574 rooms
- 7415 rooms
- 1796 rooms
- 1157 rooms
- 548 rooms
- 1949+ rooms
Easton, MD household income distribution

- 506Less than $10,000
- 618$10,000 to $19,999
- 615$20,000 to $29,999
- 538$30,000 to $39,999
- 491$40,000 to $49,999
- 455$50,000 to $59,999
- 591$60,000 to $74,999
- 1,149$75,000 to $99,999
- 632$100,000 to $124,999
- 511$125,000 to $149,999
- 477$150,000 to $199,999
- 872$200,000 or more
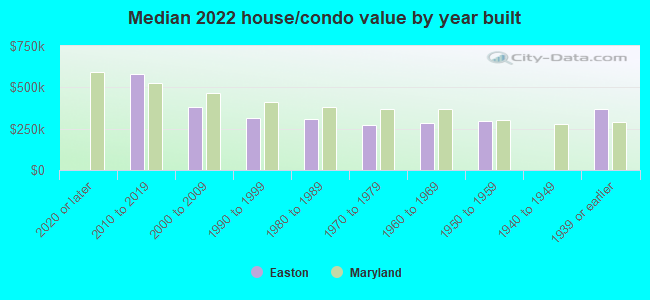
Home value of owner - occupied houses in 2022 in Easton, MD
-
- 49Less than $10,000
- 9$10,000 to $14,999
- 30$25,000 to $29,999
- 11$30,000 to $34,999
- 18$35,000 to $39,999
- 59$40,000 to $49,999
- 15$50,000 to $59,999
- 20$60,000 to $69,999
- 32$70,000 to $79,999
- 18$80,000 to $89,999
- 15$90,000 to $99,999
- 122$100,000 to $124,999
- 40$125,000 to $149,999
- 102$150,000 to $174,999
- 50$175,000 to $199,999
- 424$200,000 to $249,999
- 627$250,000 to $299,999
- 1,212$300,000 to $399,999
- 764$400,000 to $499,999
- 454$500,000 to $749,999
- 45$750,000 to $999,999
- 75$1,000,000 to $1,499,999
- 24$1,500,000 to $1,999,999
- 10$2,000,000 or more
Rent paid by renters in 2022 in Easton, MD
-
- 33Less than $100
- 44$100 to $149
- 7$150 to $199
- 116$250 to $299
- 36$300 to $349
- 49$350 to $399
- 82$400 to $449
- 36$500 to $549
- 82$550 to $599
- 68$600 to $649
- 117$650 to $699
- 174$700 to $749
- 75$750 to $799
- 356$800 to $899
- 329$900 to $999
- 349$1,000 to $1,249
- 411$1,250 to $1,499
- 311$1,500 to $1,999
- 92$2,000 to $2,499
- 71$2,500 to $2,999
- 13$3,000 to $3,499
- 23$3,500 or more
- 141No cash rent
Percentage of workers working in this county: 81.5%
Number of people working at home: 1,324 (16.7% of all workers)
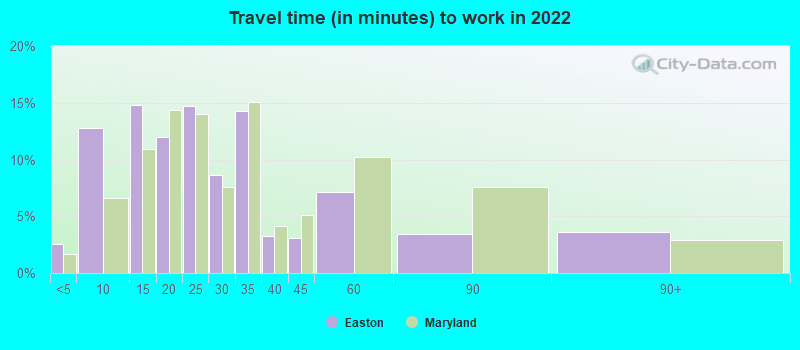
Travel time to work (commute)
- Less than 5 minutes: 282
- 5 to 9 minutes: 1,372
- 10 to 14 minutes: 1,405
- 15 to 19 minutes: 808
- 20 to 24 minutes: 550
- 25 to 29 minutes: 398
- 30 to 34 minutes: 584
- 35 to 39 minutes: 84
- 40 to 44 minutes: 63
- 45 to 59 minutes: 438
- 60 to 89 minutes: 348
- 90 or more minutes: 277
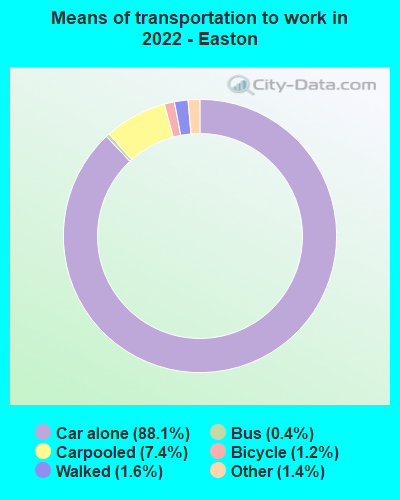
Means of transportation to work:
- Drove a car alone: 11,342 (77.5%)
- Carpooled: 1,009 (6.9%)
- Bus: 36 (0.2%)
- Taxi: 209 (1.4%)
- Bicycle: 175 (1.2%)
- Walked: 193 (1.3%)
- Worked at home: 1,324 (9.0%)
- Unemployment by race in 2022
- Unemployment rate for White non-Hispanic residents
- 1.2%Males
- 1.2%Females
- Unemployment rate for Black residents
- 2.9%Males
- Unemployment rate for Asian residents
- 6.9%Females
- Unemployment rate for two or more race residents
- 0.8%Males
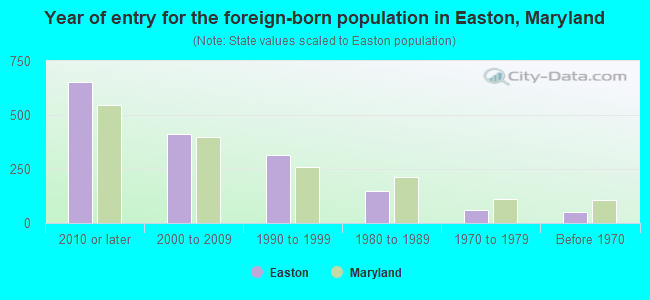
- Year of entry for the foreign-born population in Easton, Maryland
- 6532010 or later
- 4132000 to 2009
- 3141990 to 1999
- 1471980 to 1989
- 621970 to 1979
- 49Before 1970
First ancestries reported:
- English: 1,084 (13.0%)
- American: 825 (9.9%)
- Irish: 735 (8.8%)
- German: 396 (4.8%)
- Polish: 141 (1.7%)
- European: 125 (1.5%)
- Northern European: 121 (1.5%)
- Swedish: 115 (1.4%)
- Eastern European: 97 (1.2%)
- Italian: 96 (1.2%)
- Welsh: 87 (1.0%)
- Brazilian: 85 (1.0%)
- French: 78 (0.9%)
- Scottish: 67 (0.8%)
- Russian: 41 (0.5%)
- Iranian: 39 (0.5%)
- African: 39 (0.5%)
- Scotch-Irish: 29 (0.3%)
- Ukrainian: 27 (0.3%)
- Haitian: 26 (0.3%)
- Belgian: 24 (0.3%)
- French Canadian: 18 (0.2%)
- Dutch: 14 (0.2%)
- Czech: 12 (0.1%)
- Afghan: 9 (0.1%)
- British: 6 (0.07%)
- Austrian: 5 (0.06%)
- Greek: 1 (0.01%)
- Romanian: 1 (0.01%)
Most common places of birth for foreign-born residents (%):
| Easton: | 20.5% (365) |
| Maryland: | 12.0% (115,412) |
| Easton: | 17.2% (305) |
| Maryland: | 3.5% (34,065) |
| Easton: | 10.0% (178) |
| Maryland: | 2.5% (24,026) |
| Easton: | 7.6% (135) |
| Maryland: | 4.4% (42,350) |
| Easton: | 5.0% (88) |
| Maryland: | 1.2% (11,980) |
| Easton: | 4.4% (78) |
| Maryland: | 1.2% (11,265) |
| Easton: | 4.4% (78) |
| Maryland: | 3.8% (36,698) |
| Easton: | 3.1% (55) |
| Maryland: | 0.1% (789) |
| Easton: | 2.9% (52) |
| Maryland: | 1.8% (17,037) |
| Easton: | 2.8% (50) |
| Maryland: | 0.9% (8,603) |
| Easton: | 2.2% (39) |
| Maryland: | 1.3% (12,074) |
| Easton: | 2.1% (37) |
| Maryland: | 0.7% (6,724) |
| Easton: | 1.9% (33) |
| Maryland: | 0.9% (9,100) |
| Easton: | 1.8% (32) |
| Maryland: | 6.4% (61,725) |
| Easton: | 1.7% (30) |
| Maryland: | 0.7% (7,124) |
| Easton: | 1.7% (30) |
| Maryland: | 0.3% (2,452) |
| Easton: | 1.6% (28) |
| Maryland: | 1.8% (17,161) |
Place of birth for U.S.-born residents:
- This state: 9,710
- Other state: 5,342
- Northeast: 2,147
- Midwest: 592
- South: 2,100
- West: 512
86.1% of Easton residents lived in the same house 1 years ago.
Out of people who lived in different houses, 38.1% lived in this county.
Out of people who lived in different counties, 59.1% lived in Maryland.
| Easton: | 86.1% |
| State average: | 88.5% |
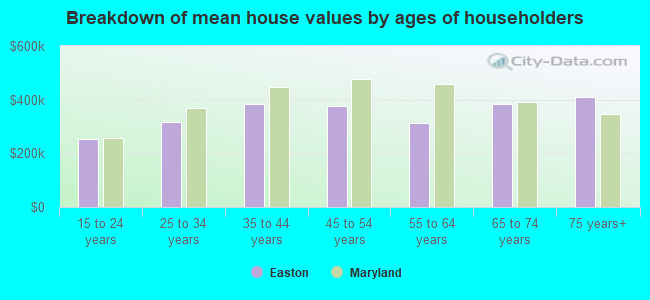
Education attainment for males 25 years and older:
- No schooling: 124
- Nursery to 4th grade: 0
- 5th and 6th grade: 50
- 7th and 8th grade: 83
- 9th grade: 85
- 10th grade: 89
- 11th grade: 125
- 12th grade, no diploma: 124
- High school graduate (or equivalency): 1,157
- Less than 1 year of college: 276
- Some college more than 1 year, no degree: 646
- Associate degree: 538
- Bachelor's degree: 1,162
- Master's degree: 572
- Professional school degree: 291
- Doctorate degree: 241
Education attainment for females 25 years and older:
- No schooling: 68
- Nursery to 4th grade: 3
- 5th and 6th grade: 2
- 7th and 8th grade: 142
- 9th grade: 36
- 10th grade: 45
- 11th grade: 101
- 12th grade, no diploma: 74
- High school graduate (or equivalency): 1,897
- Less than 1 year of college: 473
- Some college more than 1 year, no degree: 790
- Associate degree: 482
- Bachelor's degree: 1,755
- Master's degree: 734
- Professional school degree: 259
- Doctorate degree: 130
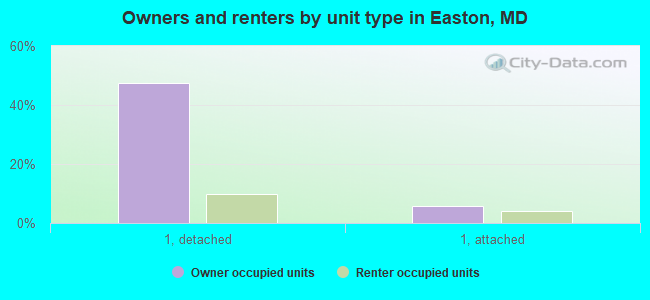
Housing units in structures:
- One, detached: 4,524
- One, attached: 751
- Two: 387
- 3 or 4: 416
- 5 to 9: 910
- 10 to 19: 170
- 20 to 49: 161
- 50 or more: 164
- Mobile homes: 265
Median worth of mobile homes: $118,871
Housing units lacking complete kitchen facilities in 2022: 2.0%
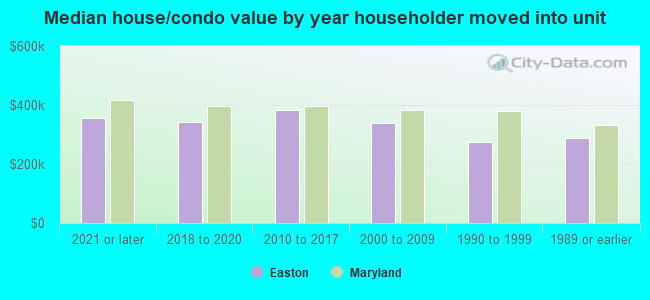
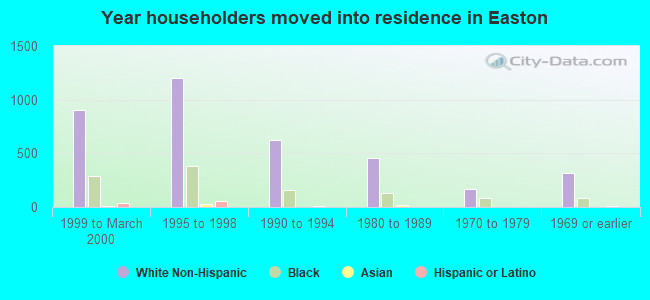
House/condo owner moved in on average 10 years ago
Renter moved in on average 5 years ago
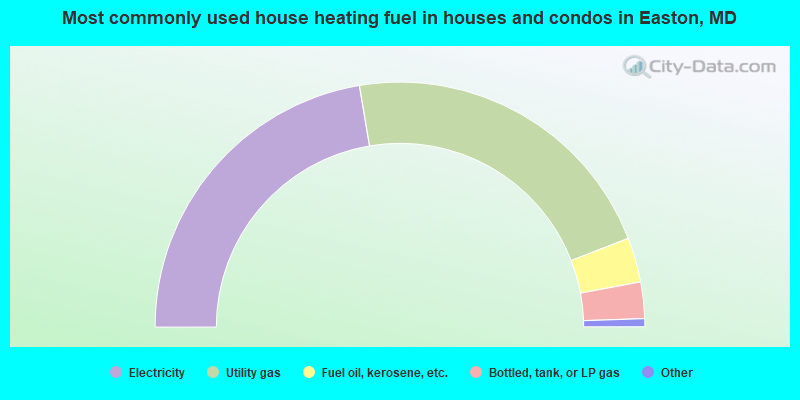
- 44.8%Electricity
- 43.6%Utility gas
- 5.9%Fuel oil, kerosene, etc.
- 4.8%Bottled, tank, or LP gas
- 0.5%Wood
- 0.3%No fuel used
- 0.2%Other fuel
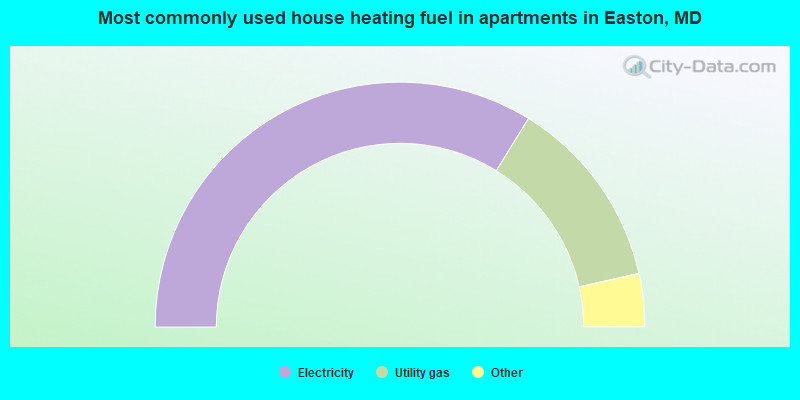
- 67.6%Electricity
- 25.4%Utility gas
- 3.6%Fuel oil, kerosene, etc.
- 2.4%Bottled, tank, or LP gas
- 1.0%No fuel used
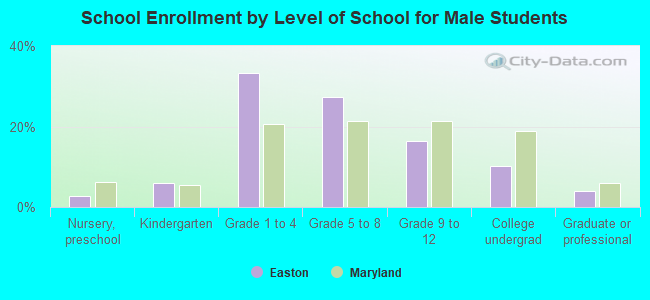
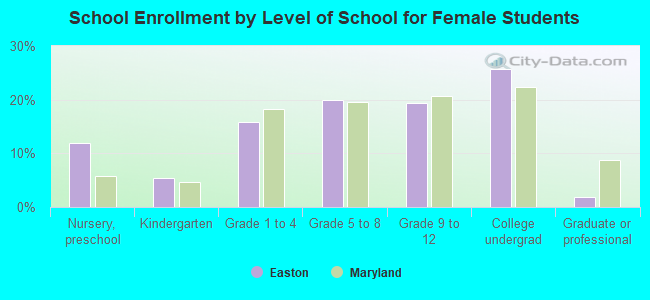
Private vs. public school enrollment:
| Here: | 22.7% |
| Maryland: | 15.2% |
| Here: | 20.8% |
| Maryland: | 14.4% |
| Here: | 24.3% |
| Maryland: | 20.2% |