East Whatcom, WA (Washington) Houses and Residents
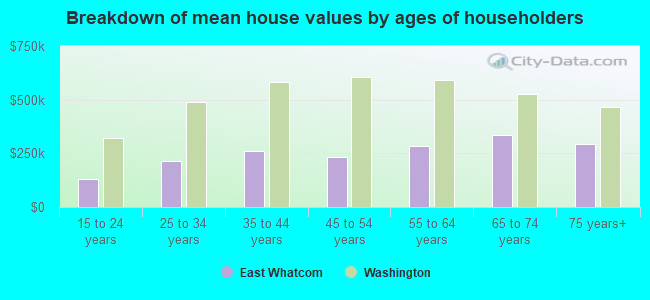
| East Whatcom: | $455,223 |
| Washington: | $569,500 |
Total population: 7,368 (Urban population: 0, Rural population: 6,432 (135 farm, 6,297 nonfarm))
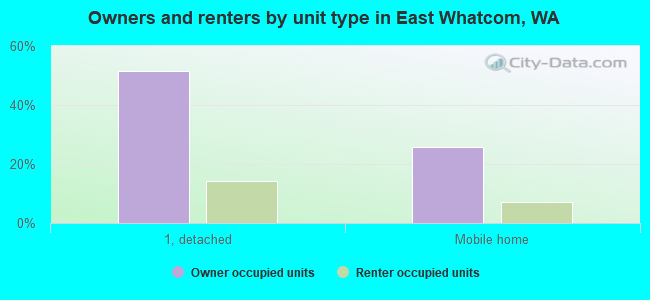
Houses: 3,129 (2,228 occupied: 1,735 owner occupied, 493 renter occupied)
| % of renters here: | 22% |
| State: | 36% |
Housing density: 2 houses/condos per square mile
Median price asked for vacant for-sale houses and condos in 2022 in this county: $799,591.
Median contract rent in 2022: $1,238 (lower quartile is $979, upper quartile is $1,531)
Median rent asked for vacant for-rent units in 2022: $1,159
Median gross rent in East Whatcom, WA in 2022: $1,439
Housing units in East Whatcom with a mortgage: 670 (33 second mortgage, 67 home equity loan, 0 both second mortgage and home equity loan)
Houses without a mortgage: 162


Household type by relationship:
Households: 195,436- In family households: 150,091 (35,414 male householders, 13,448 female householders)
38,577 spouses, 49,700 children (45,834 natural, 1,539 adopted, 2,327 stepchildren), 2,556 grandchildren, 1,556 brothers or sisters, 1,208 parents, foster children, 1,836 other relatives, 4,798 non-relatives
- In nonfamily households: 45,345 (15,226 male householders (10,293 living alone)), 16,282 female householders (12,064 living alone)), 13,837 nonrelatives
- In group quarters: 5,704 (1,259 institutionalized population)
28,721 married couples with children.
8,596 single-parent households (2,248 men, 6,348 women).
87.2% of residents of East Whatcom speak English at home.
2.1% of residents speak Spanish at home (83% speak English very well, 10% speak English well, 6% speak English not well).
10.4% of residents speak other Indo-European language at home (41% speak English very well, 25% speak English well, 24% speak English not well, 9% don't speak English at all).
0.1% of residents speak Asian or Pacific Island language at home (100% speak English very well).
0.2% of residents speak other language at home (100% speak English very well).
Foreign born population: 1,206 (13.6%)
(19.9% of them are naturalized citizens)
| Here: | 5.2 |
| State: | 6.5 |
| Here: | 4.8 |
| State: | 3.9 |
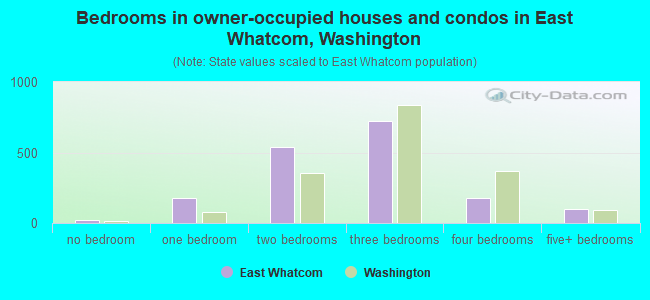
- Bedrooms in owner-occupied houses and condos in East Whatcom, Washington
- 19no bedroom
- 1791 bedroom
- 5412 bedrooms
- 7223 bedrooms
- 1774 bedrooms
- 975+ bedrooms
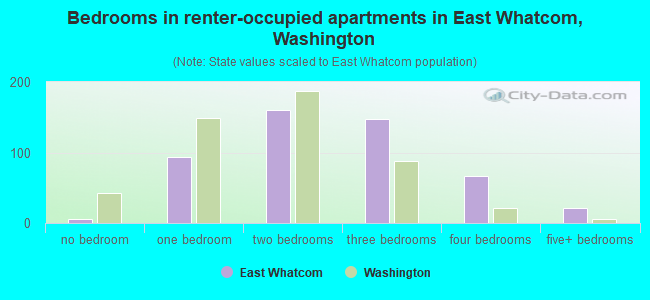
- Bedrooms in renter-occupied apartments in East Whatcom, Washington
- 6no bedroom
- 931 bedroom
- 1602 bedrooms
- 1473 bedrooms
- 664 bedrooms
- 215+ bedrooms
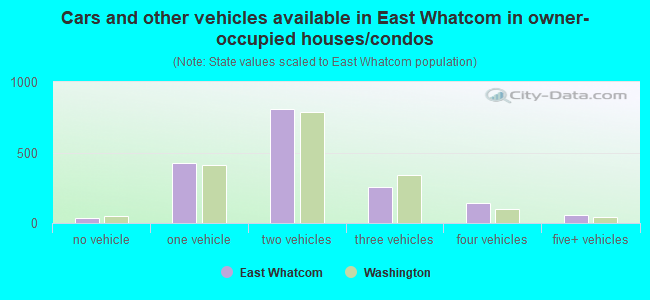
- Cars and other vehicles available in East Whatcom in owner-occupied houses/condos
- 38no vehicle
- 4291 vehicle
- 8102 vehicles
- 2583 vehicles
- 1434 vehicles
- 575+ vehicles
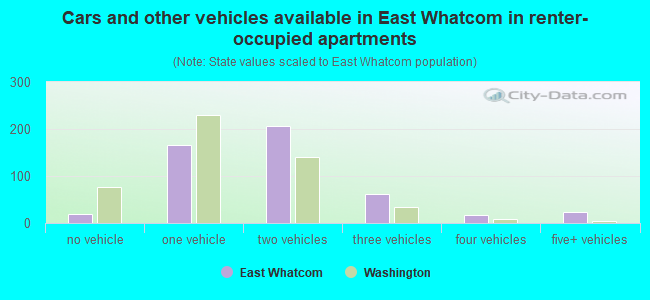
- Cars and other vehicles available in East Whatcom in renter-occupied apartments
- 20no vehicle
- 1671 vehicle
- 2062 vehicles
- 613 vehicles
- 164 vehicles
- 235+ vehicles
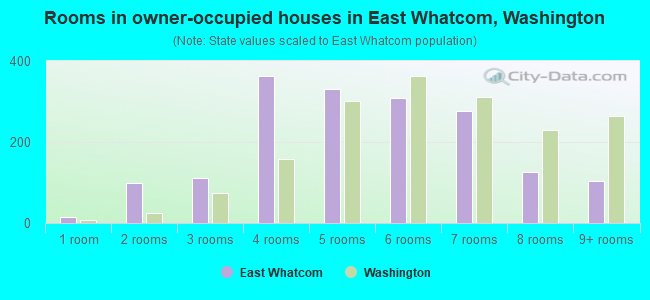
- Rooms in owner-occupied houses in East Whatcom, Washington
- 151 room
- 1002 rooms
- 1113 rooms
- 3634 rooms
- 3315 rooms
- 3096 rooms
- 2767 rooms
- 1278 rooms
- 1039+ rooms
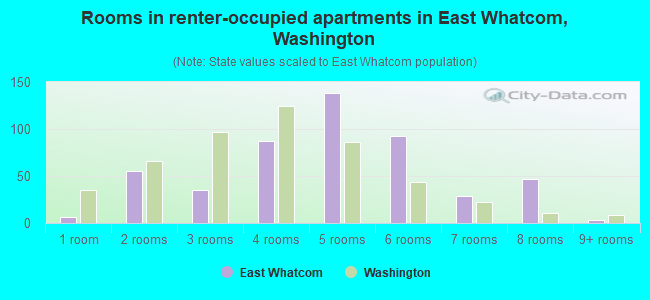
- Rooms in renter-occupied apartments in East Whatcom, Washington
- 61 room
- 552 rooms
- 353 rooms
- 874 rooms
- 1385 rooms
- 936 rooms
- 297 rooms
- 478 rooms
- 39+ rooms
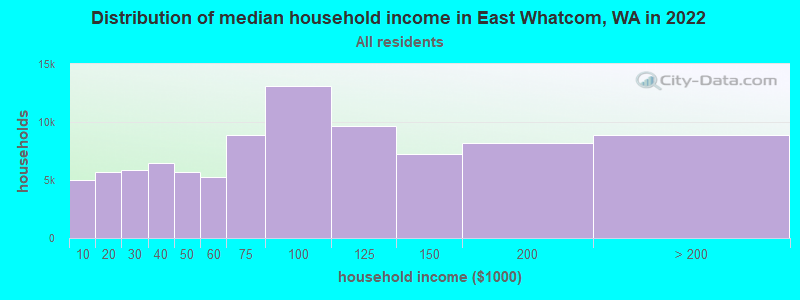
East Whatcom, WA household income distribution

- 5,037Less than $10,000
- 5,727$10,000 to $19,999
- 5,833$20,000 to $29,999
- 6,453$30,000 to $39,999
- 5,663$40,000 to $49,999
- 5,228$50,000 to $59,999
- 8,889$60,000 to $74,999
- 13,135$75,000 to $99,999
- 9,627$100,000 to $124,999
- 7,261$125,000 to $149,999
- 8,184$150,000 to $199,999
- 8,876$200,000 or more
Percentage of workers working in this county: 87.3%
Number of people working at home: 642 (15.8% of all workers)
Travel time to work (commute)
- Less than 5 minutes: 107
- 5 to 9 minutes: 222
- 10 to 14 minutes: 89
- 15 to 19 minutes: 226
- 20 to 24 minutes: 151
- 25 to 29 minutes: 122
- 30 to 34 minutes: 466
- 35 to 39 minutes: 234
- 40 to 44 minutes: 269
- 45 to 59 minutes: 420
- 60 to 89 minutes: 178
- 90 or more minutes: 120
Means of transportation to work:
- Drove a car alone: 2,053 (74.3%)
- Carpooled: 436 (15.8%)
- Bus or trolley bus: 11 (0.4%)
- Bicycle: 7 (0.3%)
- Walked: 81 (2.9%)
- Other means: 16 (0.6%)
- Worked at home: 158 (5.7%)
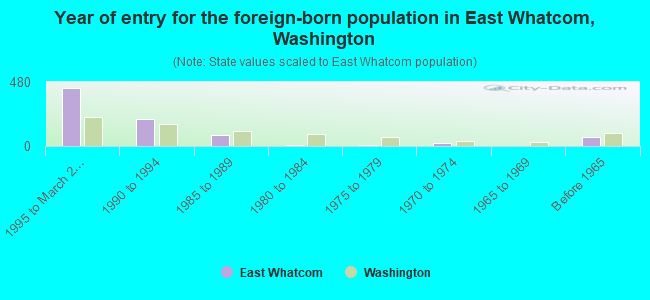
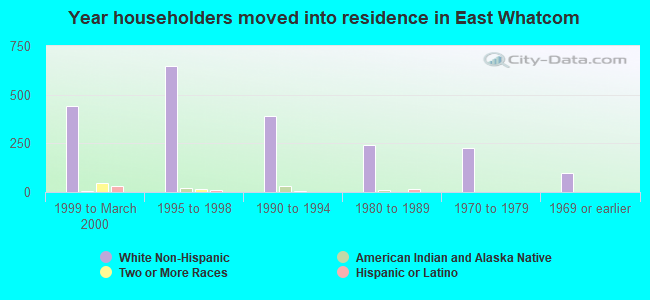
- Year of entry for the foreign-born population in East Whatcom, Washington
- 4321995 to March 2000
- 1991990 to 1994
- 841985 to 1989
- 111980 to 1984
- 71975 to 1979
- 191970 to 1974
- 01965 to 1969
- 65Before 1965
Most common places of birth for foreign-born residents (%):
| East Whatcom: | 38.6% (315) |
| Washington: | 2.5% (15,491) |
| East Whatcom: | 18.7% (153) |
| Washington: | 7.7% (47,568) |
| East Whatcom: | 15.2% (124) |
| Washington: | 3.0% (18,572) |
| East Whatcom: | 15.1% (123) |
| Washington: | 0.1% (806) |
| East Whatcom: | 3.5% (29) |
| Washington: | 1.2% (7,645) |
| East Whatcom: | 2.6% (21) |
| Washington: | 3.3% (20,321) |
| East Whatcom: | 2.0% (16) |
| Washington: | 24.1% (148,115) |
| East Whatcom: | 1.8% (15) |
| Washington: | 0.0% (64) |
Place of birth for U.S.-born residents:
- This state: 3,293
- Other state: 2,267
- Northeast: 307
- Midwest: 511
- South: 416
- West: 1,033
51% of East Whatcom residents lived in the same house 5 years ago.
Out of people who lived in different houses, 54% lived in this county.
Out of people who lived in different counties, 52% lived in Washington.
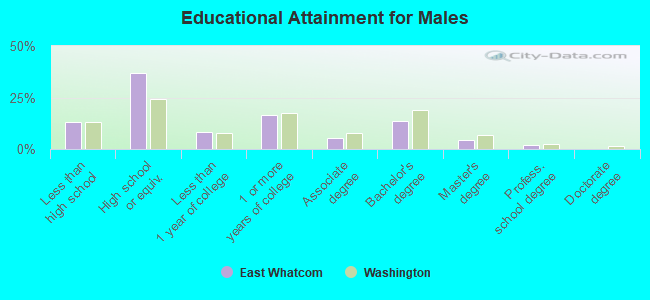
Education attainment for males 25 years and older:
- No schooling: 6
- Nursery to 4th grade: 1
- 5th and 6th grade: 5
- 7th and 8th grade: 53
- 9th grade: 16
- 10th grade: 79
- 11th grade: 62
- 12th grade, no diploma: 41
- High school graduate (or equivalency): 736
- Less than 1 year of college: 164
- Some college more than 1 year, no degree: 334
- Associate degree: 107
- Bachelor's degree: 277
- Master's degree: 86
- Professional school degree: 36
- Doctorate degree: 0
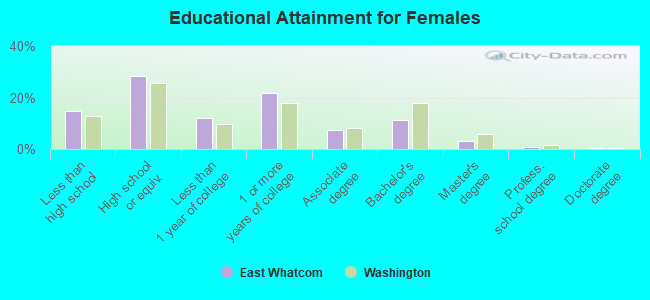
Education attainment for females 25 years and older:
- No schooling: 2
- Nursery to 4th grade: 0
- 5th and 6th grade: 0
- 7th and 8th grade: 63
- 9th grade: 34
- 10th grade: 56
- 11th grade: 68
- 12th grade, no diploma: 54
- High school graduate (or equivalency): 539
- Less than 1 year of college: 228
- Some college more than 1 year, no degree: 411
- Associate degree: 143
- Bachelor's degree: 210
- Master's degree: 62
- Professional school degree: 13
- Doctorate degree: 8
Housing units in structures:
- One, detached: 1,906
- One, attached: 12
- Two: 5
- 3 or 4: 1
- 50 or more: 179
- Mobile homes: 952
- Boats, RVs, vans, etc.: 74
Median worth of mobile homes: $150,786
Housing units lacking complete kitchen facilities: 3.9%
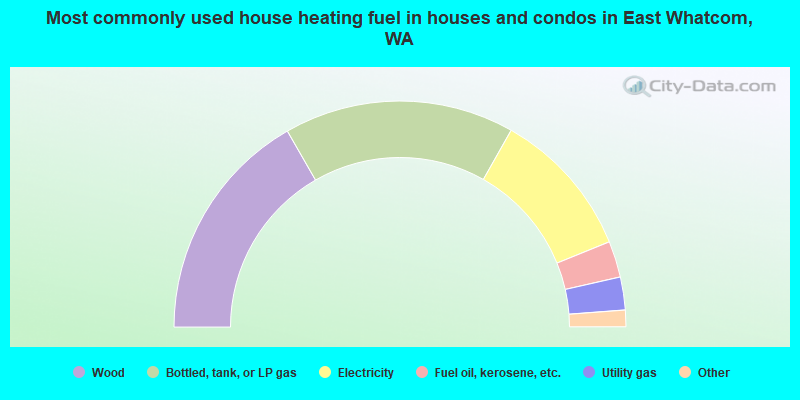
- 33.4%Wood
- 33.0%Bottled, tank, or LP gas
- 21.3%Electricity
- 5.2%Fuel oil, kerosene, etc.
- 4.7%Utility gas
- 1.6%Other fuel
- 0.4%Solar energy
- 0.4%No fuel used
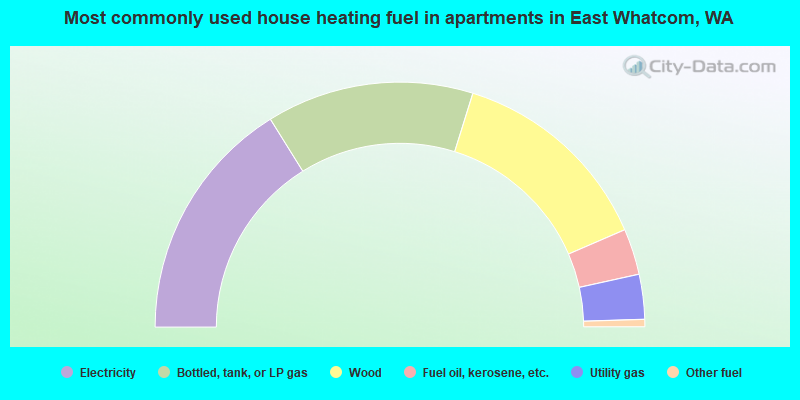
- 32.3%Electricity
- 27.4%Bottled, tank, or LP gas
- 27.4%Wood
- 6.1%Fuel oil, kerosene, etc.
- 5.9%Utility gas
- 1.0%Other fuel
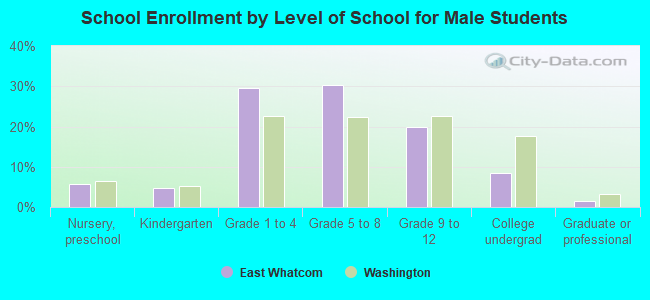
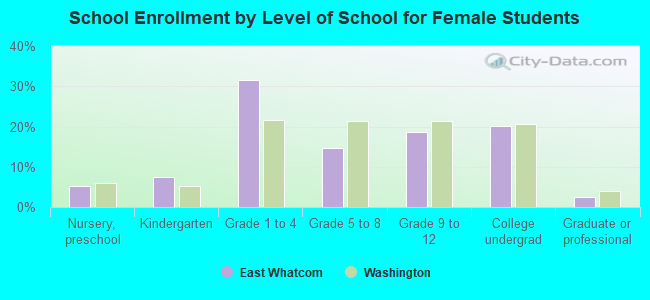
Private vs. public school enrollment:
| Here: | 4.4% |
| Washington: | 9.2% |
| Here: | 1.9% |
| Washington: | 7.0% |
| Here: | 6.7% |
| Washington: | 15.7% |