East Rockaway, NY (New York) Houses and Residents
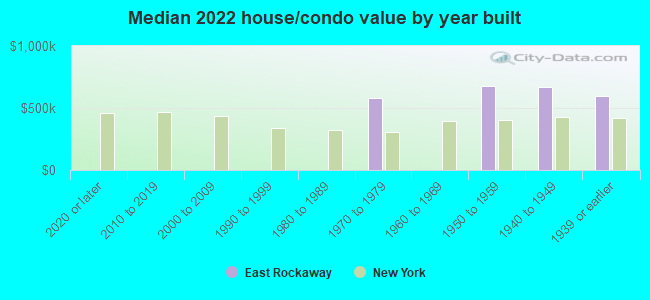
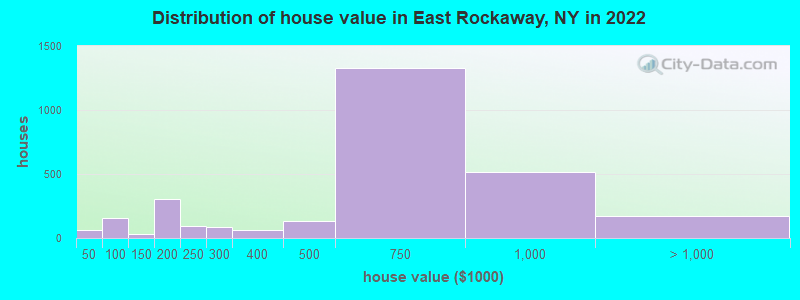
Estimated median house or condo value in 2022: $616,282 (it was $249,600 in 2000 )
East Rockaway:
$616,282New York:
$400,400
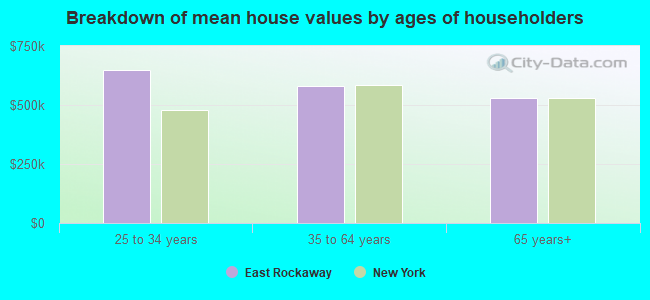
Lower value quartile - upper value quartile: $374,935 - $760,285Mean price in 2022: Detached houses: $689,432 Here:
$689,432State:
$476,719
Townhouses or other attached units: $547,734 Here:
$547,734State:
$699,270
In 2-unit structures: $530,824 Here:
$530,824State:
$713,077
In 5-or-more-unit structures: $218,560 Here:
$218,560State:
$912,009
Total population: 9,896 (All urban)
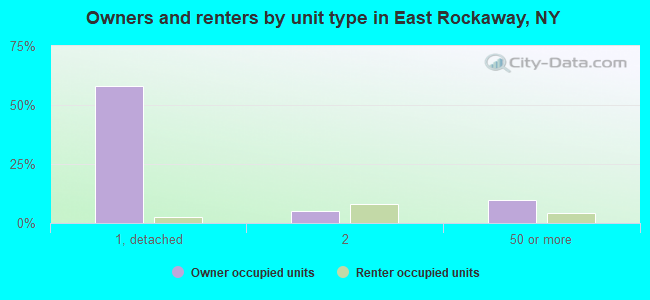
Houses: 4,160 (3,840 occupied: 2,833 owner occupied, 1,000 renter occupied )
% of renters here:
26%State:
46%
Housing density: 4,070 houses/condos per square mile
Median price asked for vacant for-sale houses and condos in 2022: $675,183.
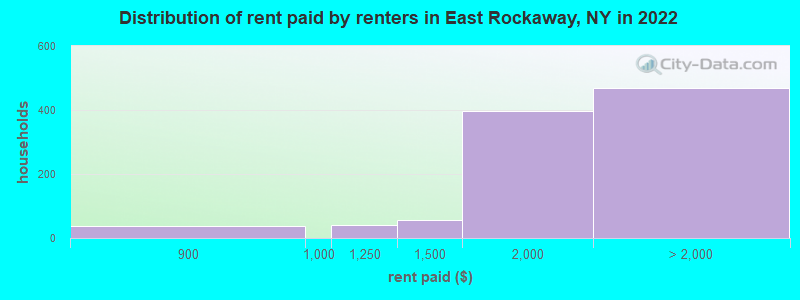
Median contract rent in 2022: $1,925 (lower quartile is $1,560, upper quartile is over $2,000)
Median rent asked for vacant for-rent units in 2022: $5,051
Median gross rent in East Rockaway, NY in 2022: over $2,000
Housing units in East Rockaway with a mortgage: 1,849 (245 second mortgage, 0 home equity loan, 250 both second mortgage and home equity loan )Houses without a mortgage: 140
Median household income for houses/condos with a mortgage: $148,928
Median household income for apartments without a mortgage: $91,737
Median monthly housing costs: $2,223
Data:
Median house or condo value ($)
Median house or condo value ($ change since 2000)
Median house or condo value ($) - White
Median house or condo value ($) - Black or African American
Median house or condo value ($) - Asian
Median house or condo value ($) - Hispanic or Latino
Median house or condo value ($) - American Indian and Alaska Native
Median house or condo value ($) - Multirace
Median house or condo value ($) - Other Race
Median price asked for mobile homes ($)
Household density (households per square mile)
Mean house or condo value by units in structure - 1, detached ($)
Mean house or condo value by units in structure - 1, attached ($)
Mean house or condo value by units in structure - 2 ($)
Mean house or condo value by units in structure by units in structure - 3 or 4 ($)
Mean house or condo value by units in structure - 5 or more ($)
Mean house or condo value by units in structure - Boat, RV, van, etc. ($)
Mean house or condo value by units in structure - Mobile home ($)
Median contract rent ($)
Median contract rent - Lower quartile ($)
Median contract rent - Upper quartile ($)
Median gross rent ($)
Urban houses (%)
Rural houses (%)
Houses occupied (%)
Houses occupied (% change since 2000)
Houses owner occupied (%)
Houses owner occupied (% change since 2000)
Houses renter occupied (%)
Houses renter occupied (% change since 2000)
Vacant housing units - For rent (%)
Vacant housing units - For rent (% change since 2000)
Vacant housing units - For sale only (%)
Vacant housing units - For sale only (% change since 2000)
Vacant housing units - Rented or sold, not occupied (%)
Vacant housing units - Rented or sold, not occupied (% change since 2000)
Vacant housing units - For seasonal, recreational, or occasional use (%)
Vacant housing units - For seasonal, recreational, or occasional use (% change since 2000)
Vacant housing units - For migrant workers (%)
Vacant housing units - For migrant workers (% change since 2000)
Vacant housing units - Other vacant (%)
Vacant housing units - Other vacant (% change since 2000)
Median monthly housing costs ($)
Median household income for houses/condos with a mortgage ($)
Median household income for houses/condos without a mortgage ($)
Median household income ($)
Median household income ($) - White
Median household income ($) - Black or African American
Median household income ($) - Asian
Median household income ($) - Hispanic or Latino
Median household income ($) - American Indian and Alaska Native
Median household income ($) - Multirace
Median household income ($) - Other Race
Mortgage status - with mortgage (%)
Mortgage status - with second mortgage (%)
Mortgage status - with home equity loan (%)
Mortgage status - with both second mortgage and home equity loan (%)
Mortgage status - without a mortgage (%)
Median year house/condo built
Median year apartment built
Household type by relationship - Male householder living alone (%)
Household type by relationship - Male householder not living alone (%)
Household type by relationship - Female householder living alone (%)
Household type by relationship - Female householder not living alone (%)
Household type by relationship - Opposite-Sex spouse (%)
Household type by relationship - Same-Sex spouse (%)
Household type by relationship - Opposite-Sex unmarried partner (%)
Household type by relationship - Same-Sex unmarried partner (%)
Household type by relationship - In group quarters (%)
Size of family households - 2-person household (%)
Size of family households - 3-person household (%)
Size of family households - 4-person household (%)
Size of family households - 5-person household (%)
Size of family households - 6-person household (%)
Size of family households - 7-or-more-person household (%)
Size of nonfamily households - 1-person household (%)
Size of nonfamily households - 2-person household (%)
Size of nonfamily households - 3-person household (%)
Size of nonfamily households - 4-person household (%)
Size of nonfamily households - 5-person household (%)
Size of nonfamily households - 6-person household (%)
Size of nonfamily households - 7-or-moreperson household (%)
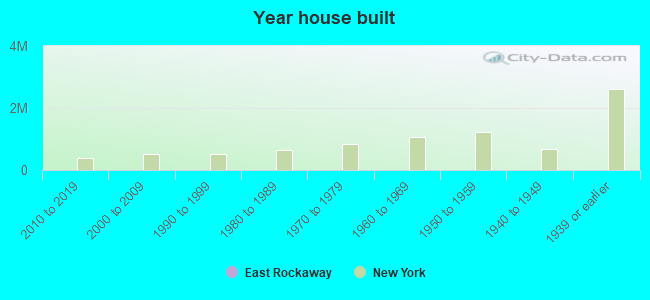
Year house built - Built 2010 or later (%)
Year house built - Built 2000 to 2009 (%)
Year house built - Built 1990 to 1999 (%)
Year house built - Built 1980 to 1989 (%)
Year house built - Built 1970 to 1979 (%)
Year house built - Built 1960 to 1969 (%)
Year house built - Built 1950 to 1959 (%)
Year house built - Built 1940 to 1949 (%)
Year house built - Built 1939 or earlier (%)
Median number of rooms in houses and condos
Median number of rooms in apartments
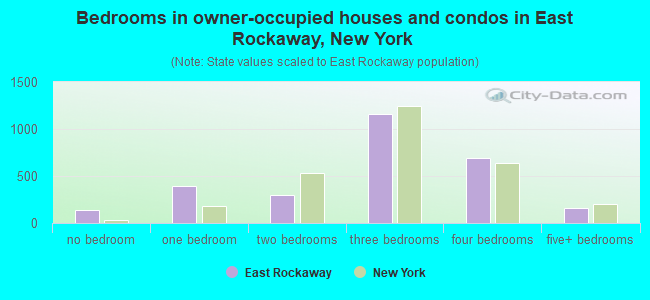
Median number of bedrooms in owner occupied houses
Mean number of bedrooms in owner occupied houses
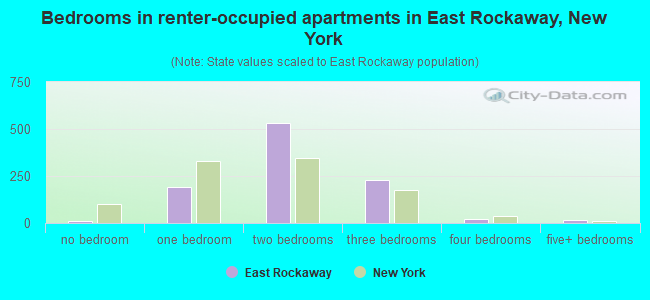
Median number of bedrooms in renter occupied houses
Mean number of bedrooms in renter occupied houses
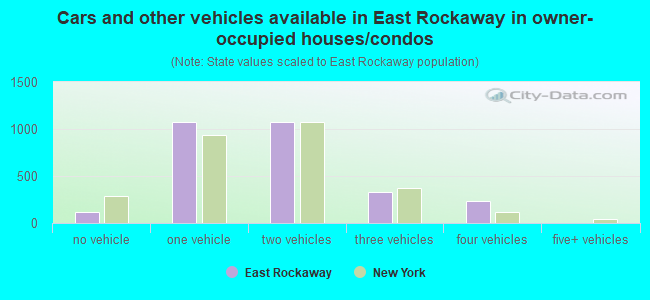
Median number of vehichles in owner occupied houses
Mean number of vehichles in owner occupied houses
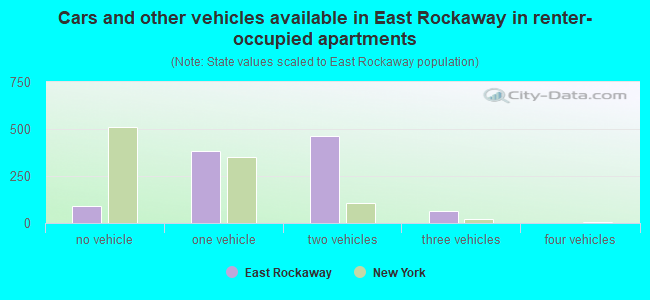
Median number of vehichles in renter occupied houses
Mean number of vehichles in renter occupied houses
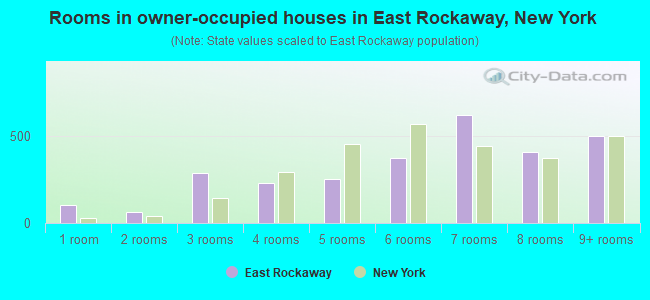
Rooms in owner-occupied houses - 1 room (%)
Rooms in owner-occupied houses - 2 rooms (%)
Rooms in owner-occupied houses - 3 rooms (%)
Rooms in owner-occupied houses - 4 rooms (%)
Rooms in owner-occupied houses - 5 rooms (%)
Rooms in owner-occupied houses - 6 rooms (%)
Rooms in owner-occupied houses - 7 rooms (%)
Rooms in owner-occupied houses - 8 rooms (%)
Rooms in owner-occupied houses - 9+ rooms (%)
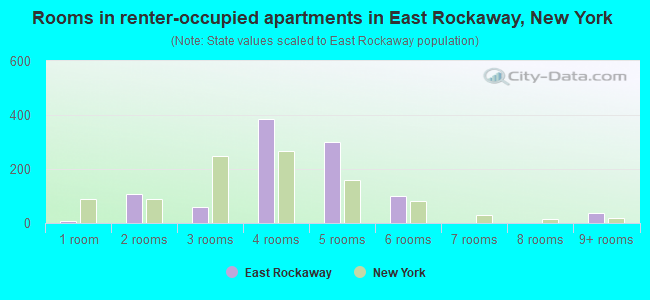
Rooms in renter-occupied houses - 1 room (%)
Rooms in renter-occupied houses - 2 rooms (%)
Rooms in renter-occupied houses - 3 rooms (%)
Rooms in renter-occupied houses - 4 rooms (%)
Rooms in renter-occupied houses - 5 rooms (%)
Rooms in renter-occupied houses - 6 rooms (%)
Rooms in renter-occupied houses - 7 rooms (%)
Rooms in renter-occupied houses - 8 rooms (%)
Rooms in renter-occupied houses - 9+ rooms (%)
Bedrooms in owner-occupied houses - no bedrooms (%)
Bedrooms in owner-occupied houses - 1 bedroom (%)
Bedrooms in owner-occupied houses - 2 bedrooms (%)
Bedrooms in owner-occupied houses - 3 bedrooms (%)
Bedrooms in owner-occupied houses - 4 bedrooms (%)
Bedrooms in owner-occupied houses - 5+ bedrooms (%)
Bedrooms in renter-occupied houses - no bedrooms (%)
Bedrooms in renter-occupied houses - 1 bedroom (%)
Bedrooms in renter-occupied houses - 2 bedrooms (%)
Bedrooms in renter-occupied houses - 3 bedrooms (%)
Bedrooms in renter-occupied houses - 4 bedrooms (%)
Bedrooms in renter-occupied houses - 5+ bedrooms (%)
Vehicles available in owner-occupied houses - no vehicle available (%)
Vehicles available in owner-occupied houses - 1 vehicle available(%)
Vehicles available in owner-occupied houses - 2 Vehicles available (%)
Vehicles available in owner-occupied houses - 3 Vehicles available (%)
Vehicles available in owner-occupied houses - 4 Vehicles available (%)
Vehicles available in owner-occupied houses - 5+ Vehicles available (%)
Vehicles available in renter-occupied houses - no vehicle available (%)
Vehicles available in renter-occupied houses - 1 vehicle available (%)
Vehicles available in renter-occupied houses - 2 Vehicles available (%)
Vehicles available in renter-occupied houses - 3 Vehicles available (%)
Vehicles available in renter-occupied houses - 4 Vehicles available (%)
Vehicles available in renter-occupied houses - 5+ Vehicles available (%)
Housing units in structures - 1, detached (%)
Housing units in structures - 1, attached (%)
Housing units in structures - 2 (%)
Housing units in structures - 3 or 4 (%)
Housing units in structures - 5 to 9 (%)
Housing units in structures - 10 to 19 (%)
Housing units in structures - 20 to 49 (%)
Housing units in structures - 50 or more (%)
Housing units in structures - Mobile home (%)
Housing units in structures - Boat, RV, van, etc. (%)
Housing units in structures - Owners - 1, detached (%)
Housing units in structures - Owners - 1, attached (%)
Housing units in structures - Owners - 2 (%)
Housing units in structures - Owners - 3 or 4 (%)
Housing units in structures - Owners - 5 to 9 (%)
Housing units in structures - Owners - 10 to 19 (%)
Housing units in structures - Owners - 20 to 49 (%)
Housing units in structures - Owners - 50 or more (%)
Housing units in structures - Owners - Mobile home (%)
Housing units in structures - Owners - Boat, RV, van, etc. (%)
Housing units in structures - Renters - 1, detached (%)
Housing units in structures - Renters - 1, attached (%)
Housing units in structures - Renters - 2 (%)
Housing units in structures - Renters - 3 or 4 (%)
Housing units in structures - Renters - 5 to 9 (%)
Housing units in structures - Renters - 10 to 19 (%)
Housing units in structures - Renters - 20 to 49 (%)
Housing units in structures - Renters - 50 or more (%)
Housing units in structures - Renters - Mobile home (%)
Housing units in structures - Renters - Boat, RV, van, etc. (%)
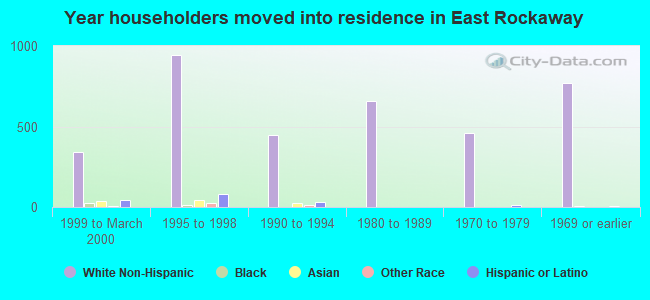
House/condo owner moved in on average (years ago)
Renter moved in on average (years ago)
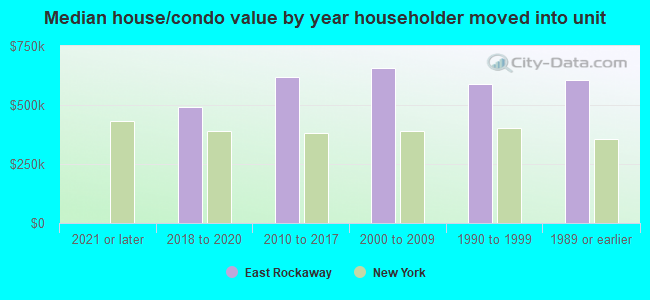
Year householder moved into unit - Moved in 1999 to March 2000 (%)
Year householder moved into unit - Moved in 1999 to March 2000 (%) - White
Year householder moved into unit - Moved in 1999 to March 2000 (%) - Black or African American
Year householder moved into unit - Moved in 1999 to March 2000 (%) - Asian
Year householder moved into unit - Moved in 1999 to March 2000 (%) - Hispanic or Latino
Year householder moved into unit - Moved in 1999 to March 2000 (%) - American Indian and Alaska Native
Year householder moved into unit - Moved in 1999 to March 2000 (%) - Multirace
Year householder moved into unit - Moved in 1999 to March 2000 (%) - Other Race
Year householder moved into unit - Moved in 1995 to 1998 (%)
Year householder moved into unit - Moved in 1995 to 1998 (%) - White
Year householder moved into unit - Moved in 1995 to 1998 (%) - Black or African American
Year householder moved into unit - Moved in 1995 to 1998 (%) - Asian
Year householder moved into unit - Moved in 1995 to 1998 (%) - Hispanic or Latino
Year householder moved into unit - Moved in 1995 to 1998 (%) - American Indian and Alaska Native
Year householder moved into unit - Moved in 1995 to 1998 (%) - Multirace
Year householder moved into unit - Moved in 1995 to 1998 (%) - Other Race
Year householder moved into unit - Moved in 1990 to 1994 (%)
Year householder moved into unit - Moved in 1990 to 1994 (%) - White
Year householder moved into unit - Moved in 1990 to 1994 (%) - Black or African American
Year householder moved into unit - Moved in 1990 to 1994 (%) - Asian
Year householder moved into unit - Moved in 1990 to 1994 (%) - Hispanic or Latino
Year householder moved into unit - Moved in 1990 to 1994 (%) - American Indian and Alaska Native
Year householder moved into unit - Moved in 1990 to 1994 (%) - Multirace
Year householder moved into unit - Moved in 1990 to 1994 (%) - Other Race
Year householder moved into unit - Moved in 1980 to 1989 (%)
Year householder moved into unit - Moved in 1980 to 1989 (%) - White
Year householder moved into unit - Moved in 1980 to 1989 (%) - Black or African American
Year householder moved into unit - Moved in 1980 to 1989 (%) - Asian
Year householder moved into unit - Moved in 1980 to 1989 (%) - Hispanic or Latino
Year householder moved into unit - Moved in 1980 to 1989 (%) - American Indian and Alaska Native
Year householder moved into unit - Moved in 1980 to 1989 (%) - Multirace
Year householder moved into unit - Moved in 1980 to 1989 (%) - Other Race
Year householder moved into unit - Moved in 1970 to 1979 (%)
Year householder moved into unit - Moved in 1970 to 1979 (%) - White
Year householder moved into unit - Moved in 1970 to 1979 (%) - Black or African American
Year householder moved into unit - Moved in 1970 to 1979 (%) - Asian
Year householder moved into unit - Moved in 1970 to 1979 (%) - Hispanic or Latino
Year householder moved into unit - Moved in 1970 to 1979 (%) - American Indian and Alaska Native
Year householder moved into unit - Moved in 1970 to 1979 (%) - Multirace
Year householder moved into unit - Moved in 1970 to 1979 (%) - Other Race
Year householder moved into unit - Moved in 1969 or earlier (%)
Year householder moved into unit - Moved in 1969 or earlier (%) - White
Year householder moved into unit - Moved in 1969 or earlier (%) - Black or African American
Year householder moved into unit - Moved in 1969 or earlier (%) - Asian
Year householder moved into unit - Moved in 1969 or earlier (%) - Hispanic or Latino
Year householder moved into unit - Moved in 1969 or earlier (%) - American Indian and Alaska Native
Year householder moved into unit - Moved in 1969 or earlier (%) - Multirace
Year householder moved into unit - Moved in 1969 or earlier (%) - Other Race
Housing units lacking complete plumbing facilities (%)
Housing units lacking complete kitchen facilities (%)
House heating fuel used in houses and condos - Utility gas (%)
House heating fuel used in houses and condos - Bottled, tank, or LP gas (%)
House heating fuel used in houses and condos - Electricity (%)
House heating fuel used in houses and condos - Fuel oil, kerosene, etc. (%)
House heating fuel used in houses and condos - Coal or coke (%)
House heating fuel used in houses and condos - Wood (%)
House heating fuel used in houses and condos - Solar energy (%)
House heating fuel used in houses and condos - Other fuel (%)
House heating fuel used in houses and condos - No fuel used (%)
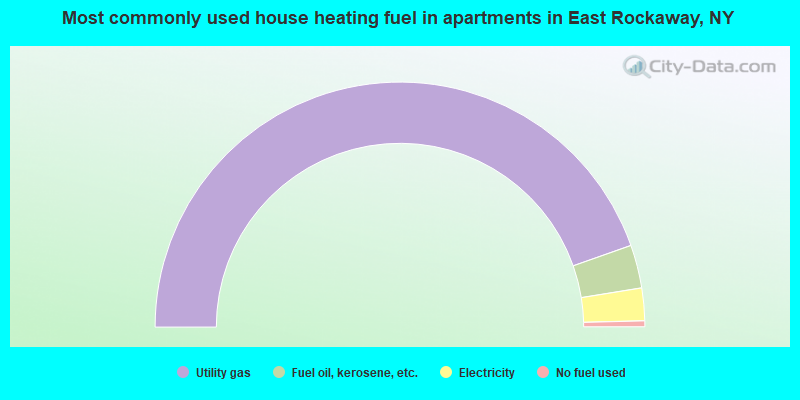
House heating fuel used in apartments - Utility gas (%)
House heating fuel used in apartments - Bottled, tank, or LP gas (%)
House heating fuel used in apartments - Electricity (%)
House heating fuel used in apartments - Fuel oil, kerosene, etc. (%)
House heating fuel used in apartments - Coal or coke (%)
House heating fuel used in apartments - Wood (%)
House heating fuel used in apartments - Solar energy (%)
House heating fuel used in apartments - Other fuel (%)
House heating fuel used in apartments - No fuel used (%)
Median year house/condo built: 1949Median year apartment built: 1957Household type by relationship:
Households: 10,030
Male householders: 1,790 (510 living alone ), Female householders: 2,016 (533 living alone )1,995 spouses (1,995 opposite-sex spouses ), 149 unmarried partners , (130 opposite-sex unmarried partners ), 3,309 children (3,157 natural , 0 adopted , 151 stepchildren ), 34 grandchildren , 21 brothers or sisters , 202 parents , 0 foster children , 35 other relatives , 309 non-relatives In group quarters: 165
Size of family households: 1,010 2-persons , 677 3-persons , 531 4-persons , 191 5-persons , 145 6-persons , 35 7-or-more-persons .
Size of nonfamily households: 1,089 1-person , 151 2-persons , 13 3-persons .
1,684 married couples with children. single-parent households (29 men , 289 women ).
84.1% of residents of East Rockaway speak English at home. of residents speak Spanish at home (61% speak English very well , 16% speak English well , 15% speak English not well , 8% don't speak English at all ).of residents speak other Indo-European language at home (78% speak English very well , 13% speak English well , 10% speak English not well ).of residents speak Asian or Pacific Island language at home (22% speak English very well , 29% speak English well , 25% speak English not well , 24% don't speak English at all ).of residents speak other language at home (100% speak English very well ).
Foreign born population: 1,213 (12.1%)of them are naturalized citizens )
Median number of rooms in houses and condos:
Median number of rooms in apartments
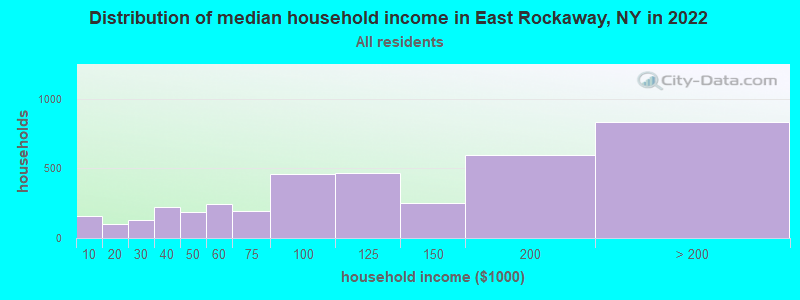
East Rockaway, NY household income distribution 159 Less than $10,00098 $10,000 to $19,999130 $20,000 to $29,999224 $30,000 to $39,999187 $40,000 to $49,999241 $50,000 to $59,999194 $60,000 to $74,999456 $75,000 to $99,999465 $100,000 to $124,999253 $125,000 to $149,999596 $150,000 to $199,999832 $200,000 or more
Home value of owner - occupied houses in 2022 in East Rockaway, NY 12 Less than $10,00048 $40,000 to $49,99919 $50,000 to $59,99927 $70,000 to $79,99947 $80,000 to $89,99912 $90,000 to $99,99920 $100,000 to $124,99912 $125,000 to $149,999206 $150,000 to $174,99994 $175,000 to $199,99994 $200,000 to $249,99988 $250,000 to $299,99962 $300,000 to $399,999133 $400,000 to $499,9991,331 $500,000 to $749,999512 $750,000 to $999,999151 $1,000,000 to $1,499,99923 $2,000,000 or moreRent paid by renters in 2022 in East Rockaway, NY 39 $800 to $89941 $1,000 to $1,24955 $1,250 to $1,499397 $1,500 to $1,999276 $2,000 to $2,499173 $2,500 to $2,99918 $3,500 or more
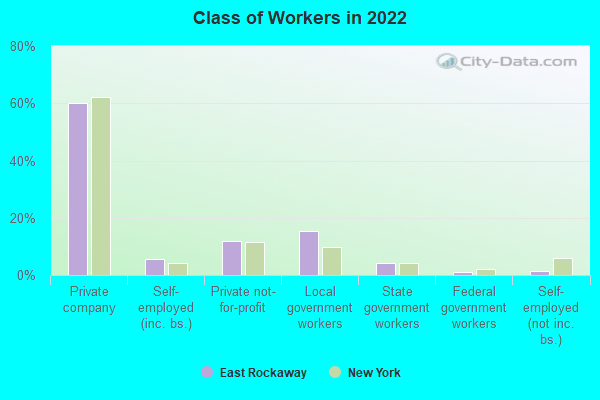
Percentage of workers working in this county: 69.5%Number of people working at home: 823 (16.0% of all workers )
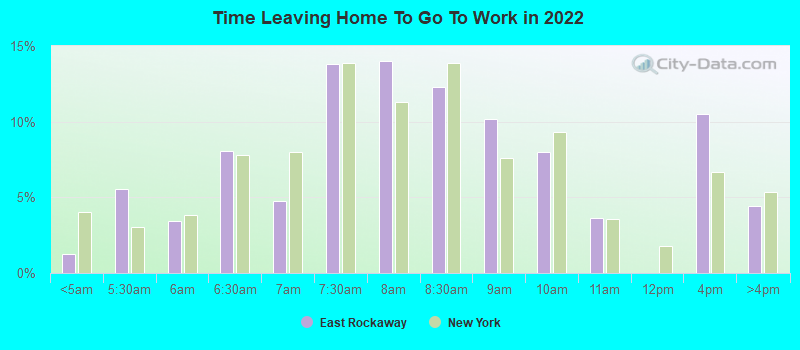
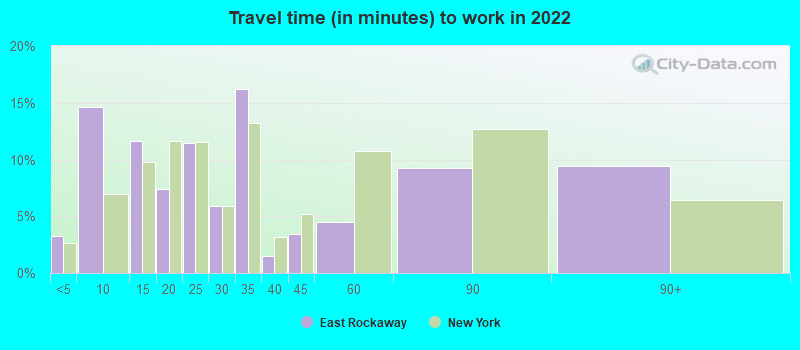
Travel time to work (commute)
Less than 5 minutes: 1745 to 9 minutes: 14010 to 14 minutes: 35915 to 19 minutes: 74820 to 24 minutes: 54025 to 29 minutes: 22030 to 34 minutes: 55935 to 39 minutes: 17240 to 44 minutes: 12445 to 59 minutes: 45860 to 89 minutes: 46390 or more minutes: 403
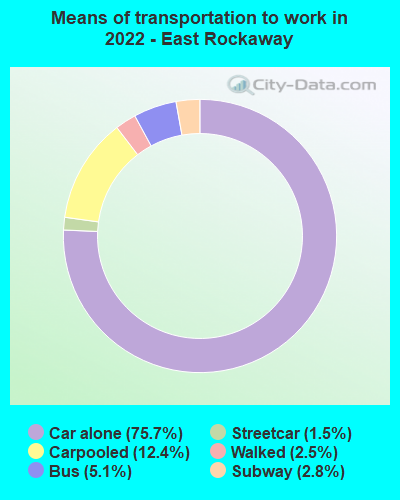
Means of transportation to work:
Drove a car alone: 932 (47.3%)Carpooled: 147 (7.5%)Bus : 60 (3.0%)Subway or elevated rail : 16 (0.8%)Long-distance train or commuter rail : 30 (1.5%)Walked: 33 (1.7%)Worked at home: 823 (41.8%)
Unemployment by race in 2022
Unemployment rate for White non-Hispanic residents 4.1% Males3.6% FemalesUnemployment rate for Black residents 49.4% MalesUnemployment rate for other race residents 19.8% FemalesUnemployment rate for Hispanic or Latino residents 3.5% Females
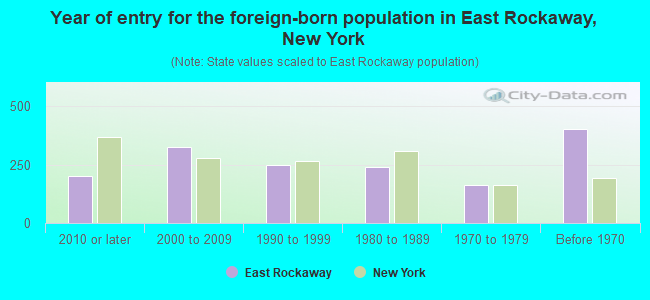
Year of entry for the foreign-born population in East Rockaway, New York
203 2010 or later 325 2000 to 2009 246 1990 to 1999 239 1980 to 1989 161 1970 to 1979 402 Before 1970
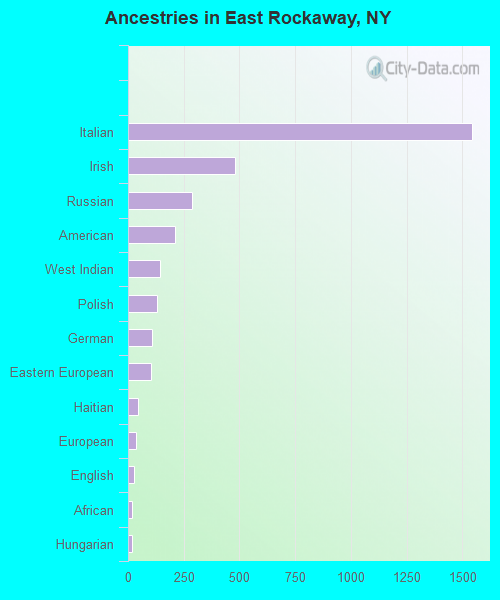
First ancestries reported:
Italian: 1,542 (33.6%)
Irish: 478 (10.4%)
Russian: 285 (6.2%)
American: 211 (4.6%)
West Indian: 143 (3.1%)
Polish: 128 (2.8%)
German: 107 (2.3%)
Eastern European: 104 (2.3%)
Haitian: 47 (1.0%)
European: 38 (0.8%)
English: 25 (0.5%)
African: 19 (0.4%)
Hungarian: 18 (0.4%)
Welsh: 11 (0.2%)
Scottish: 9 (0.2%)
Slovak: 9 (0.2%)
Canadian: 8 (0.2%)
Greek: 2 (0.04%) Most common places of birth for foreign-born residents (%): Haiti East Rockaway:
12.9% (151)New York:
2.8% (126,936)
China, excluding Hong Kong and Taiwan East Rockaway:
12.7% (149)New York:
9.1% (410,910)
Dominican Republic East Rockaway:
11.8% (138)New York:
11.1% (501,040)
Italy East Rockaway:
7.9% (93)New York:
1.8% (81,374)
Peru East Rockaway:
6.7% (79)New York:
1.2% (54,759)
Colombia East Rockaway:
6.4% (75)New York:
2.5% (111,920)
Trinidad and Tobago East Rockaway:
5.7% (67)New York:
2.0% (91,428)
Russia East Rockaway:
4.5% (53)New York:
1.7% (75,802)
Turkey East Rockaway:
3.8% (45)New York:
0.5% (21,009)
India East Rockaway:
3.7% (43)New York:
3.5% (158,432)
Philippines East Rockaway:
3.6% (42)New York:
2.0% (91,070)
Chile East Rockaway:
3.0% (35)New York:
0.3% (11,831)
Israel East Rockaway:
2.9% (34)New York:
0.7% (29,743)
El Salvador East Rockaway:
2.8% (33)New York:
2.4% (108,067)
Ireland East Rockaway:
2.6% (30)New York:
0.6% (26,772)
Ecuador East Rockaway:
1.5% (18)New York:
3.9% (177,448)
Place of birth for U.S.-born residents:
This state: 8,050Other state: 493Northeast: 147Midwest: 3South: 265West: 71 92.7% of East Rockaway residents lived in the same house 1 years ago.
Out of people who lived in different houses, 37.9% lived in this county.
Out of people who lived in different counties, 100.0% lived in New York.
East Rockaway:
92.7%State average:
89.6%
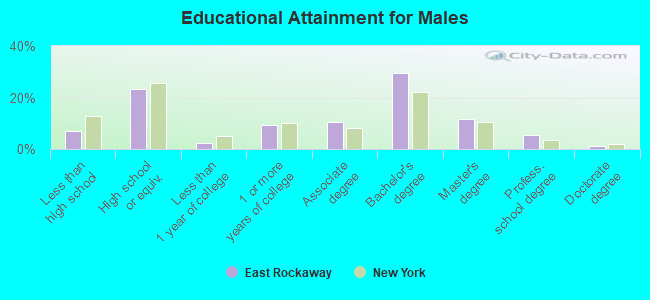
Education attainment for males 25 years and older:
No schooling: 38Nursery to 4th grade: 275th and 6th grade: 647th and 8th grade: 299th grade: 4010th grade: 011th grade: 512th grade, no diploma: 33High school graduate (or equivalency): 759Less than 1 year of college: 81Some college more than 1 year, no degree: 301Associate degree: 345Bachelor's degree: 968Master's degree: 379Professional school degree: 176Doctorate degree: 40
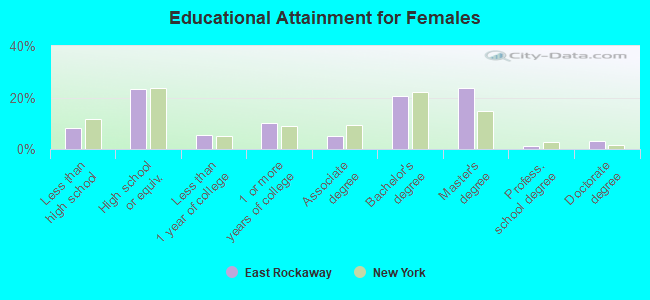
Education attainment for females 25 years and older:
No schooling: 30Nursery to 4th grade: 125th and 6th grade: 167th and 8th grade: 1459th grade: 010th grade: 011th grade: 4112th grade, no diploma: 65High school graduate (or equivalency): 894Less than 1 year of college: 205Some college more than 1 year, no degree: 386Associate degree: 194Bachelor's degree: 791Master's degree: 910Professional school degree: 52Doctorate degree: 127
Housing units in structures:
One, detached: 2,420One, attached: 105Two: 7853 or 4: 1545 to 9: 5510 to 19: 7220 to 49: 3450 or more: 532Housing units lacking complete plumbing facilities in 2022: 0.2%Housing units lacking complete kitchen facilities in 2022: 0.2%House/condo owner moved in on average 15 years ago
Renter moved in on average 3 years ago
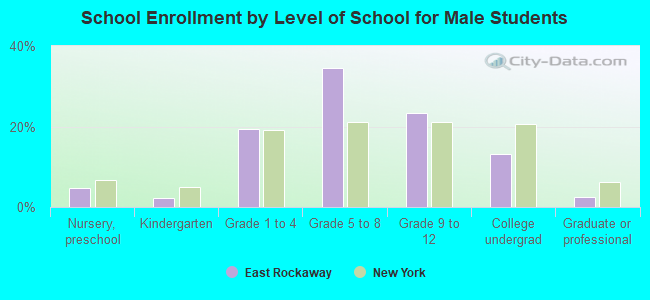
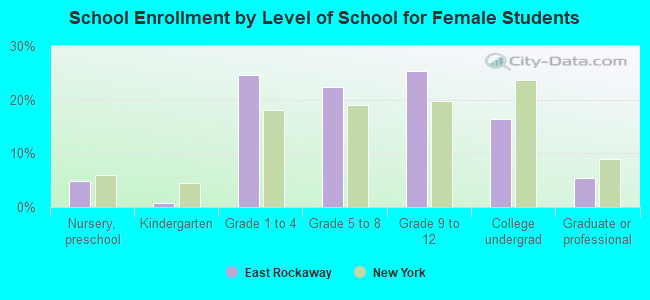
Private vs. public school enrollment:
Students in private schools in grades 1 to 8 (elementary and middle school): 35 Students in private schools in grades 9 to 12 (high school): 52 Students in private undergraduate colleges: 72