East Pasadena, CA (California) Houses and Residents
| East Pasadena: | $1,058,987 |
| California: | $715,900 |
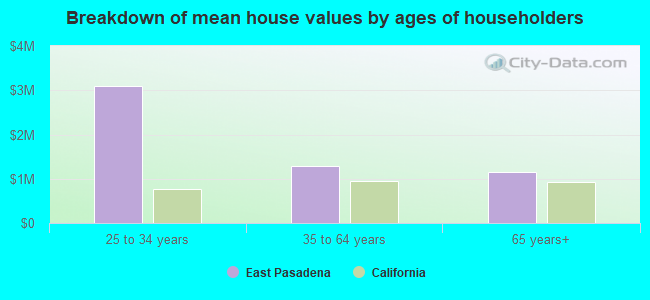
Mean price in 2022:
Detached houses: $1,654,298
Here: $1,654,298 State: $988,808 Townhouses or other attached units: $868,273
Here: $868,273 State: $838,546 In 5-or-more-unit structures: $1,886,874
Here: $1,886,874 State: $730,996
Total population: 6,144 (Urban population: 6,036, Rural population: 0)
Houses: 2,308 (1,964 occupied: 1,397 owner occupied, 574 renter occupied)
| % of renters here: | 29% |
| State: | 44% |
Housing density: 1,751 houses/condos per square mile
Median price asked for vacant for-sale houses and condos in 2022: $1,628,094.
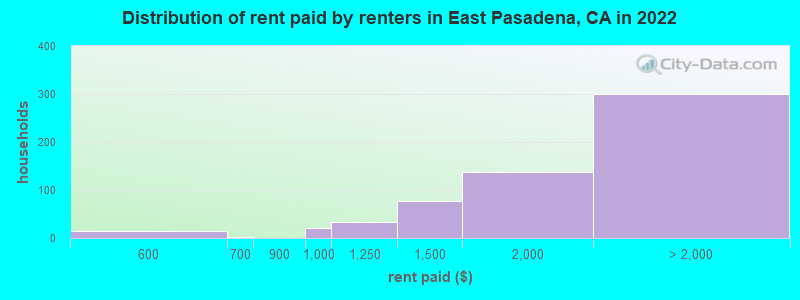
Median contract rent in 2022: $1,901 (lower quartile is $1,414, upper quartile is over $2,000)
Median rent asked for vacant for-rent units in 2022: $2,983
Median gross rent in East Pasadena, CA in 2022: over $2,000
Housing units in East Pasadena with a mortgage: 967 (74 second mortgage, 0 home equity loan, 64 both second mortgage and home equity loan)
Houses without a mortgage: 31
Median household income for houses/condos with a mortgage: $123,147
Median household income for apartments without a mortgage: $77,021
Median monthly housing costs: $2,192
Compare current foreclosures near East Pasadena, CA:
| Photo | Address | Area | Beds / Baths | Price | Details |
|---|---|---|---|---|---|

|
#1
E Newby Ave # 1
San Gabriel, CA 91776
|
2,689 sq. feet
|
2 baths 3 beds |
$880,000
|
show details |

|
#2
Hawkstone Ave
Whittier, CA 90605
|
1,444 sq. feet
|
2 baths 4 beds |
$649,900
|
show details |

|
#3
E Norma Ave
West Covina, CA 91791
|
1,134 sq. feet
|
2 baths 3 beds |
$599,000
|
show details |

|
#4
Millbury Ave
Baldwin Park, CA 91706
|
1,632 sq. feet
|
2 baths 4 beds |
$869,000
|
show details |

|
#5
E Holton St
West Covina, CA 91791
|
- sq. feet
|
2 baths 3 beds |
$450,000
|
show details |

|
#6
Dunrobin Ave
Downey, CA 90242
|
3,000 sq. feet
|
4 baths 8 beds |
show details | |

|
#7
Bohlig Rd Apt 45
Los Angeles, CA 90032
|
813 sq. feet
|
2 baths 2 beds |
show details | |

|
#8
N Commonwealth Ave
Los Angeles, CA 90004
|
3,937 sq. feet
|
6 baths 6 beds |
show details | |

|
#9
E 60th St
Los Angeles, CA 90001
|
1,883 sq. feet
|
3 baths 5 beds |
show details | |

|
#10
And 6111 Northside Drive
Los Angeles, CA 90022
|
1,329 sq. feet
|
4 baths 3 beds |
show details |
| Photo | Address | Area | Beds / Baths | Price | Details |
|---|---|---|---|---|---|

|
#11
Elburg St Unit A
Paramount, CA 90723
|
1,131 sq. feet
|
2 baths 3 beds |
show details | |

|
#12
N Beachwood Dr
Los Angeles, CA 90068
|
1,848 sq. feet
|
2 baths 2 beds |
show details | |

|
#13
Tacoma Ave
Los Angeles, CA 90065
|
2,047 sq. feet
|
2 baths 3 beds |
show details | |

|
#14
Dinwiddie St
Downey, CA 90241
|
1,640 sq. feet
|
1 baths 3 beds |
show details | |

|
#15
S Bender Ave
Glendora, CA 91740
|
1,410 sq. feet
|
2 baths 3 beds |
show details | |

|
#16
Maie Ave
Los Angeles, CA 90001
|
860 sq. feet
|
1 baths 2 beds |
show details | |

|
#17
Lavell Dr
Los Angeles, CA 90065
|
- sq. feet
|
4 baths 4 beds |
show details | |

|
#18
Via Saldivar St
Glendale, CA 91208
|
1,771 sq. feet
|
2 baths 2 beds |
show details | |

|
#19
May Ct
South Gate, CA 90280
|
943 sq. feet
|
1 baths 3 beds |
show details | |

|
#20
Edmore Pl
Sun Valley, CA 91352
|
2,012 sq. feet
|
2 baths 4 beds |
show details |
| Photo | Address | Area | Beds / Baths | Price | Details |
|---|---|---|---|---|---|

|
#21
Walnut Dr
Los Angeles, CA 90001
|
944 sq. feet
|
1 baths 3 beds |
show details | |

|
#22
Spry St
Norwalk, CA 90650
|
1,142 sq. feet
|
1 baths 3 beds |
show details | |

|
#23
S Westboro Ave
Alhambra, CA 91803
|
2,136 sq. feet
|
2 baths 4 beds |
show details | |

|
#24
Lavell Dr
Los Angeles, CA 90065
|
2,076 sq. feet
|
4 baths 4 beds |
show details | |

|
#25
S New England St
Los Angeles, CA 90006
|
1,509 sq. feet
|
4 baths 5 beds |
show details | |

|
#26
Gettysburg Dr
Norwalk, CA 90650
|
1,136 sq. feet
|
1 baths 3 beds |
show details | |

|
#27
N Vista Bonita Ave
Glendora, CA 91741
|
3,934 sq. feet
|
3 baths 4 beds |
show details | |

|
#28
S Lake St
Los Angeles, CA 90057
|
- sq. feet
|
4 baths 9 beds |
show details | |

|
#29
S Dancove Dr
West Covina, CA 91791
|
1,956 sq. feet
|
3 baths 3 beds |
show details | |

|
#30
Highland Oaks Dr
Arcadia, CA 91006
|
2,212 sq. feet
|
3 baths 3 beds |
show details |
| Photo | Address | Area | Beds / Baths | Price | Details |
|---|---|---|---|---|---|

|
#31
Meadow Grove St
La Canada Flintridge, CA 91011
|
8,618 sq. feet
|
8 baths 7 beds |
show details | |

|
#32
W Monterey Ave
Burbank, CA 91506
|
2,349 sq. feet
|
3 baths 4 beds |
show details | |

|
#33
S Gramercy Pl
Los Angeles, CA 90062
|
- sq. feet
|
2 baths 4 beds |
show details | |

|
#34
Topaz Ave
La Habra, CA 90631
|
2,481 sq. feet
|
3 baths 5 beds |
show details | |

|
#35
N Traymore Ave
Covina, CA 91722
|
1,755 sq. feet
|
2 baths 4 beds |
show details | |

|
#36
4th Ave
Los Angeles, CA 90008
|
1,392 sq. feet
|
2 baths 2 beds |
show details | |

|
#37
Calle Ciervos
San Dimas, CA 91773
|
1,825 sq. feet
|
2 baths 3 beds |
show details | |

|
#38
N Mott St
Los Angeles, CA 90033
|
784 sq. feet
|
1 baths 3 beds |
show details | |

|
#39
Redmont Ave
Tujunga, CA 91042
|
936 sq. feet
|
1 baths 2 beds |
show details | |

|
#40
S Norton Ave
Los Angeles, CA 90018
|
1,082 sq. feet
|
1 baths 2 beds |
show details |
| Photo | Address | Area | Beds / Baths | Price | Details |
|---|---|---|---|---|---|

|
#41
Ocana Ave
Bellflower, CA 90706
|
1,218 sq. feet
|
2 baths 3 beds |
show details | |

|
#42
West 41st Drive
Los Angeles, CA 90037
|
3,662 sq. feet
|
4 baths 6 beds |
show details | |

|
#43
Margaret Ave
Los Angeles, CA 90022
|
1,192 sq. feet
|
1 baths 3 beds |
show details | |

|
#44
Las Palmas Ave
Glendale, CA 91208
|
1,265 sq. feet
|
1 baths 2 beds |
show details | |

|
#45
N Jackson St Apt 210
Glendale, CA 91206
|
- sq. feet
|
1 baths 1 beds |
show details | |

|
#46
12th Ave
Los Angeles, CA 90018
|
1,044 sq. feet
|
1 baths 2 beds |
show details | |

|
#47
E Edna Pl
Covina, CA 91722
|
1,440 sq. feet
|
2 baths 4 beds |
show details | |

|
#48
E Benbow St
Covina, CA 91722
|
1,514 sq. feet
|
2 baths 4 beds |
show details | |

|
#49
San Nicholas Dr
Walnut, CA 91789
|
2,408 sq. feet
|
2 baths 3 beds |
show details | |

|
Check over 1 million property listings on Foreclosure.com!
|
browse all offers | |||


Median year apartment built: 1951
Household type by relationship:
Households: 5,355- Male householders: 821 (271 living alone), Female householders: 1,078 (221 living alone)
1,002 spouses (998 opposite-sex spouses), 39 unmarried partners, (32 opposite-sex unmarried partners), 1,568 children (1,477 natural, 43 adopted, 47 stepchildren), 70 grandchildren, 214 brothers or sisters, 203 parents, 11 foster children, 148 other relatives, 166 non-relatives
- In group quarters: 30
Size of family households: 431 2-persons, 494 3-persons, 200 4-persons, 124 5-persons, 30 6-persons, 48 7-or-more-persons.
Size of nonfamily households: 528 1-person, 103 2-persons, 11 3-persons.
654 married couples with children.
165 single-parent households (10 men, 155 women).
40.4% of residents of East Pasadena speak English at home.
32.3% of residents speak Spanish at home (64% speak English very well, 12% speak English well, 18% speak English not well, 6% don't speak English at all).
5.3% of residents speak other Indo-European language at home (62% speak English very well, 7% speak English well, 31% speak English not well).
21.3% of residents speak Asian or Pacific Island language at home (67% speak English very well, 24% speak English well, 6% speak English not well, 3% don't speak English at all).
1.2% of residents speak other language at home (78% speak English very well, 22% speak English well).
Foreign born population: 1,939 (36.2%)
(70.9% of them are naturalized citizens)
| Here: | 5.9 |
| State: | 6.0 |
| Here: | 4.4 |
| State: | 3.9 |
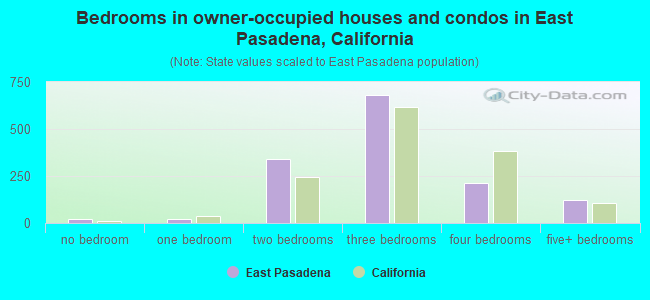
- Bedrooms in owner-occupied houses and condos in East Pasadena, California
- 20no bedroom
- 201 bedroom
- 3432 bedrooms
- 6803 bedrooms
- 2114 bedrooms
- 1225+ bedrooms
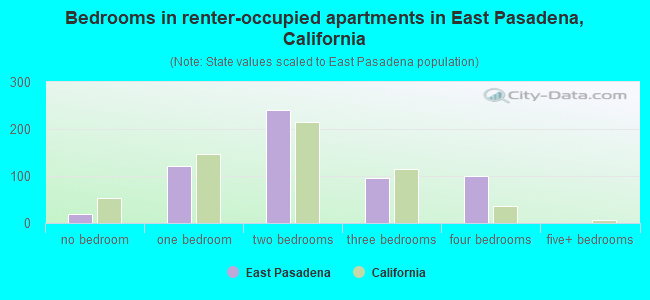
- Bedrooms in renter-occupied apartments in East Pasadena, California
- 19no bedroom
- 1211 bedroom
- 2402 bedrooms
- 963 bedrooms
- 994 bedrooms
- 05+ bedrooms
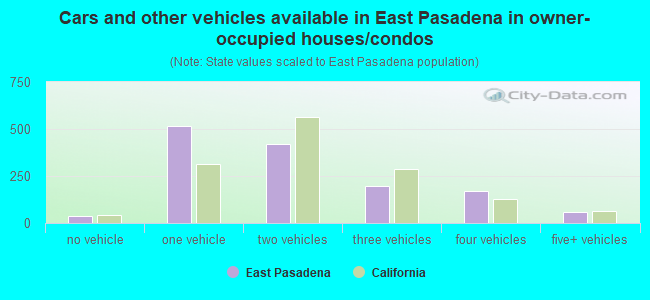
- Cars and other vehicles available in East Pasadena in owner-occupied houses/condos
- 35no vehicle
- 5141 vehicle
- 4212 vehicles
- 1993 vehicles
- 1714 vehicles
- 585+ vehicles
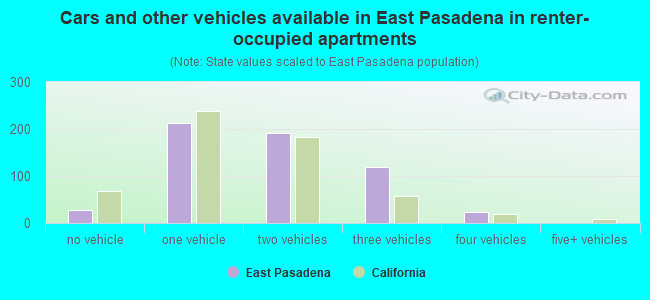
- Cars and other vehicles available in East Pasadena in renter-occupied apartments
- 27no vehicle
- 2131 vehicle
- 1922 vehicles
- 1193 vehicles
- 234 vehicles
- 05+ vehicles
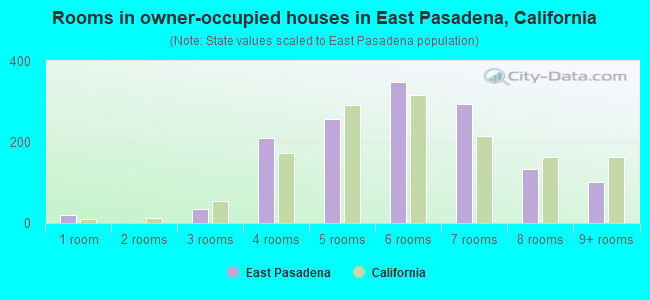
- Rooms in owner-occupied houses in East Pasadena, California
- 201 room
- 02 rooms
- 343 rooms
- 2104 rooms
- 2565 rooms
- 3496 rooms
- 2937 rooms
- 1348 rooms
- 1029+ rooms
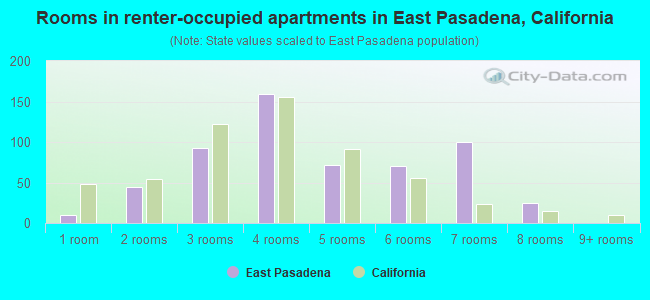
- Rooms in renter-occupied apartments in East Pasadena, California
- 101 room
- 452 rooms
- 933 rooms
- 1594 rooms
- 725 rooms
- 706 rooms
- 1007 rooms
- 258 rooms
- 09+ rooms
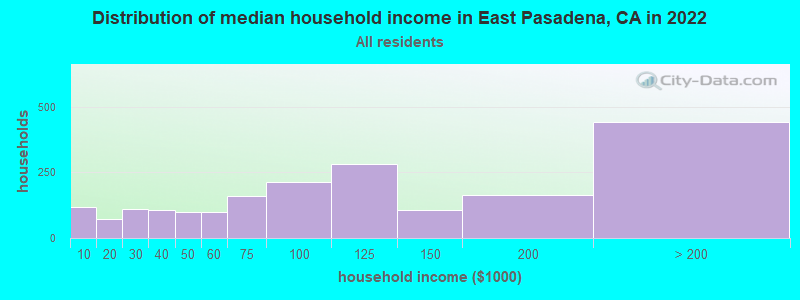
East Pasadena, CA household income distribution

- 119Less than $10,000
- 72$10,000 to $19,999
- 109$20,000 to $29,999
- 108$30,000 to $39,999
- 98$40,000 to $49,999
- 100$50,000 to $59,999
- 159$60,000 to $74,999
- 213$75,000 to $99,999
- 281$100,000 to $124,999
- 107$125,000 to $149,999
- 162$150,000 to $199,999
- 442$200,000 or more
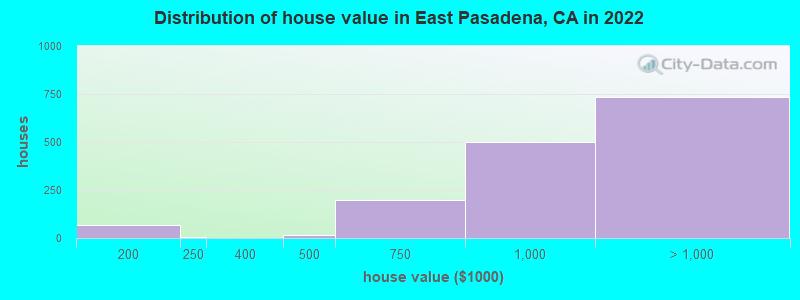
Home value of owner - occupied houses in 2022 in East Pasadena, CA
-
- 5$10,000 to $14,999
- 67$150,000 to $174,999
- 2$200,000 to $249,999
- 17$400,000 to $499,999
- 200$500,000 to $749,999
- 499$750,000 to $999,999
- 347$1,000,000 to $1,499,999
- 186$1,500,000 to $1,999,999
- 202$2,000,000 or more
Rent paid by renters in 2022 in East Pasadena, CA
-
- 15$500 to $549
- 3$650 to $699
- 20$900 to $999
- 33$1,000 to $1,249
- 77$1,250 to $1,499
- 137$1,500 to $1,999
- 93$2,000 to $2,499
- 19$2,500 to $2,999
- 9$3,000 to $3,499
- 108$3,500 or more
- 66No cash rent
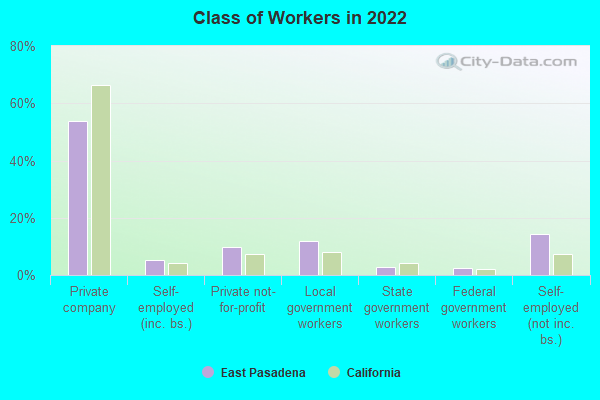
Percentage of workers working in this county: 98.1%
Number of people working at home: 405 (15.4% of all workers)
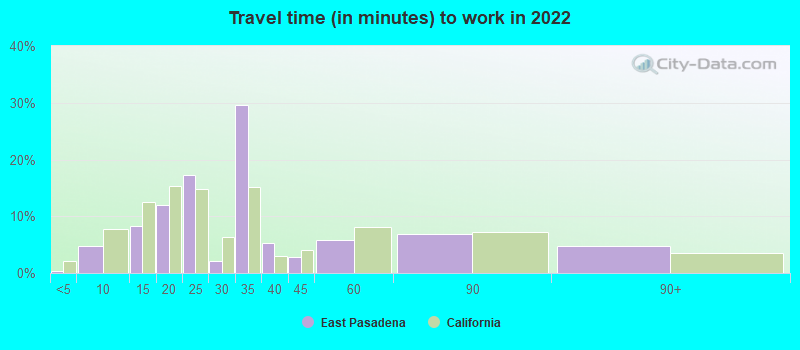
Travel time to work (commute)
- Less than 5 minutes: 6
- 5 to 9 minutes: 255
- 10 to 14 minutes: 161
- 15 to 19 minutes: 276
- 20 to 24 minutes: 444
- 25 to 29 minutes: 80
- 30 to 34 minutes: 335
- 35 to 39 minutes: 163
- 40 to 44 minutes: 177
- 45 to 59 minutes: 172
- 60 to 89 minutes: 126
- 90 or more minutes: 38
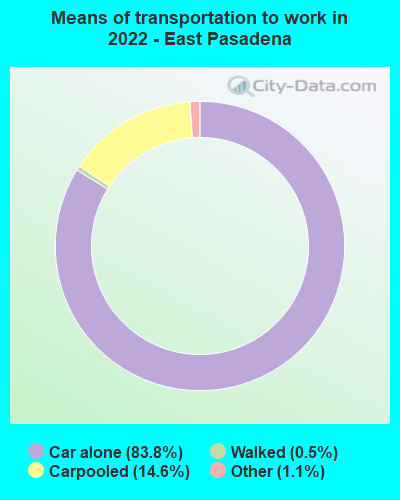
Means of transportation to work:
- Drove a car alone: 1,535 (68.4%)
- Carpooled: 295 (13.1%)
- Taxi: 22 (1.0%)
- Walked: 9 (0.4%)
- Worked at home: 405 (18.0%)
- Unemployment by race in 2022
- Unemployment rate for White non-Hispanic residents
- 2.1%Males
- Unemployment rate for Black residents
- 23.8%Males
- Unemployment rate for Asian residents
- 1.3%Females
- Unemployment rate for other race residents
- 1.7%Females
- Unemployment rate for two or more race residents
- 7.6%Males
- 29.5%Females
- Unemployment rate for Hispanic or Latino residents
- 1.2%Males
- 0.9%Females
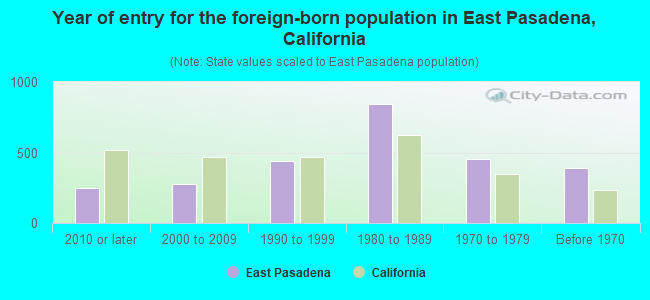
- Year of entry for the foreign-born population in East Pasadena, California
- 2462010 or later
- 2792000 to 2009
- 4401990 to 1999
- 8411980 to 1989
- 4561970 to 1979
- 389Before 1970
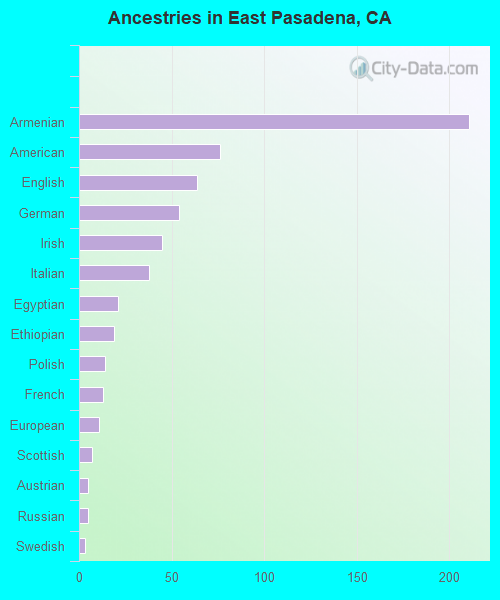
First ancestries reported:
- Armenian: 211 (6.2%)
- American: 76 (2.2%)
- English: 64 (1.9%)
- German: 54 (1.6%)
- Irish: 45 (1.3%)
- Italian: 38 (1.1%)
- Egyptian: 21 (0.6%)
- Ethiopian: 19 (0.6%)
- Polish: 14 (0.4%)
- French: 13 (0.4%)
- European: 11 (0.3%)
- Scottish: 7 (0.2%)
- Austrian: 5 (0.1%)
- Russian: 5 (0.1%)
- Swedish: 3 (0.09%)
- Yugoslavian: 1 (0.03%)
Most common places of birth for foreign-born residents (%):
| East Pasadena: | 26.4% (512) |
| California: | 37.2% (3,881,193) |
| East Pasadena: | 13.8% (268) |
| California: | 6.6% (684,672) |
| East Pasadena: | 12.0% (232) |
| California: | 1.7% (176,274) |
| East Pasadena: | 9.8% (190) |
| California: | 7.8% (818,297) |
| East Pasadena: | 7.4% (143) |
| California: | 0.8% (78,847) |
| East Pasadena: | 4.0% (77) |
| California: | 0.6% (66,590) |
| East Pasadena: | 3.7% (72) |
| California: | 1.0% (105,215) |
| East Pasadena: | 2.9% (56) |
| California: | 4.2% (440,287) |
| East Pasadena: | 2.8% (54) |
| California: | 0.4% (39,097) |
| East Pasadena: | 2.1% (40) |
| California: | 4.9% (512,335) |
| East Pasadena: | 1.8% (34) |
| California: | 3.0% (315,248) |
Place of birth for U.S.-born residents:
- This state: 2,462
- Other state: 800
- Northeast: 274
- Midwest: 255
- South: 165
- West: 104
91.5% of East Pasadena residents lived in the same house 1 years ago.
Out of people who lived in different houses, 44.8% lived in this county.
Out of people who lived in different counties, 43.7% lived in California.
| East Pasadena: | 91.5% |
| State average: | 88.9% |
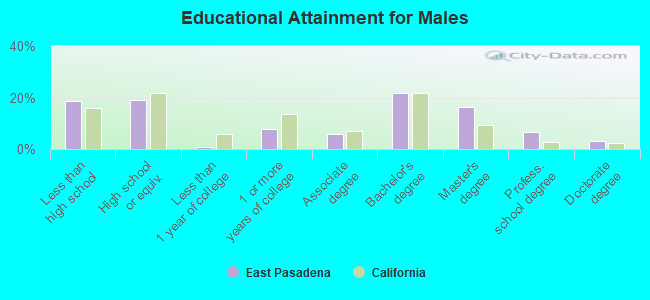
Education attainment for males 25 years and older:
- No schooling: 42
- Nursery to 4th grade: 8
- 5th and 6th grade: 97
- 7th and 8th grade: 62
- 9th grade: 6
- 10th grade: 4
- 11th grade: 113
- 12th grade, no diploma: 45
- High school graduate (or equivalency): 378
- Less than 1 year of college: 19
- Some college more than 1 year, no degree: 158
- Associate degree: 118
- Bachelor's degree: 432
- Master's degree: 323
- Professional school degree: 135
- Doctorate degree: 63
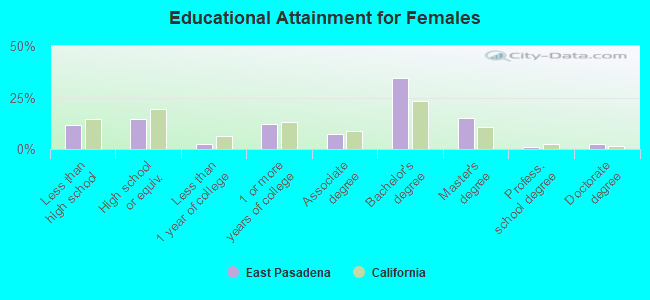
Education attainment for females 25 years and older:
- No schooling: 21
- Nursery to 4th grade: 6
- 5th and 6th grade: 85
- 7th and 8th grade: 27
- 9th grade: 6
- 10th grade: 49
- 11th grade: 27
- 12th grade, no diploma: 9
- High school graduate (or equivalency): 288
- Less than 1 year of college: 44
- Some college more than 1 year, no degree: 239
- Associate degree: 148
- Bachelor's degree: 691
- Master's degree: 297
- Professional school degree: 23
- Doctorate degree: 44


Housing units in structures:
- One, detached: 1,997
- One, attached: 84
- Two: 47
- 3 or 4: 66
- 5 to 9: 5
- 10 to 19: 19
- 20 to 49: 79
- 50 or more: 4
- Mobile homes: 4
Housing units lacking complete kitchen facilities in 2022: 1.0%
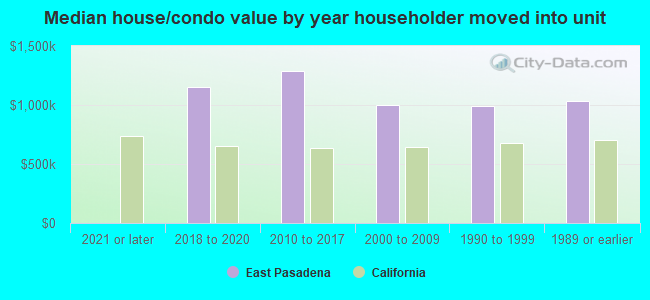
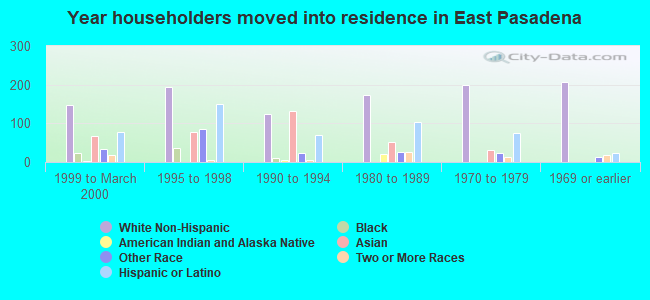
House/condo owner moved in on average 22 years ago
Renter moved in on average 2 years ago
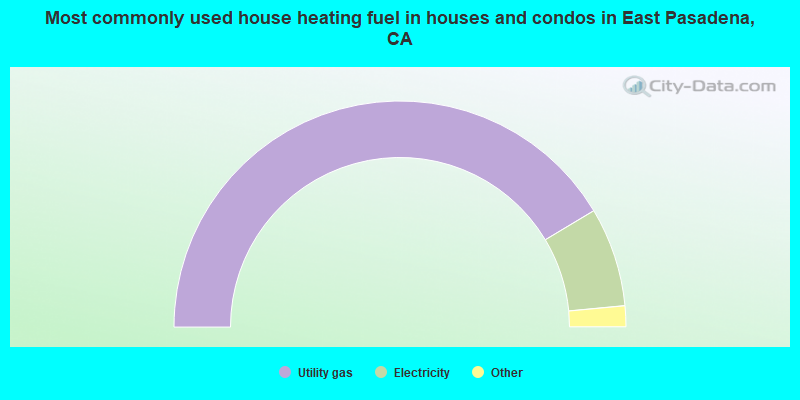
- 82.9%Utility gas
- 14.2%Electricity
- 2.0%Bottled, tank, or LP gas
- 0.5%Solar energy
- 0.4%No fuel used
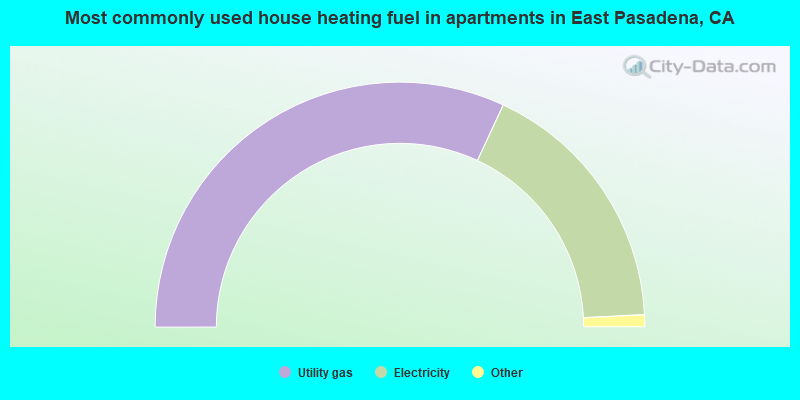
- 64.0%Utility gas
- 34.6%Electricity
- 0.7%Bottled, tank, or LP gas
- 0.7%No fuel used
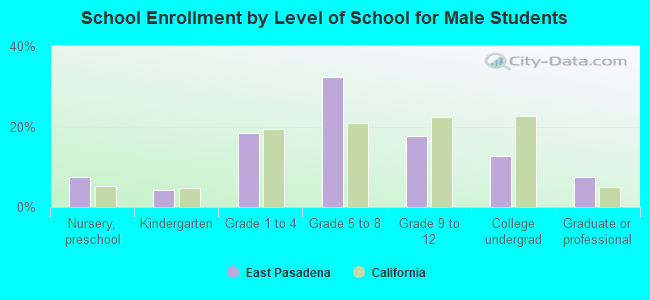
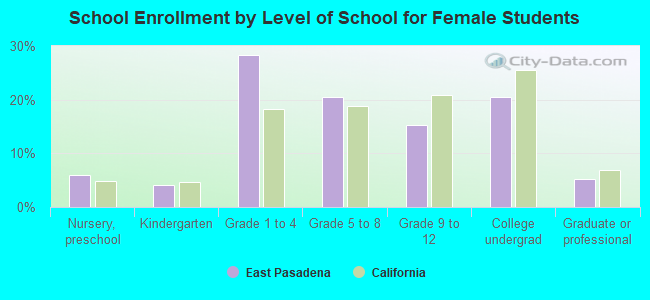
Private vs. public school enrollment:
| Here: | 23.0% |
| California: | 10.5% |
| Here: | 9.5% |
| California: | 8.5% |
| Here: | 9.8% |
| California: | 15.9% |