East Lyme, CT (Connecticut) Houses and Residents
| East Lyme: | $353,037 |
| Connecticut: | $347,200 |
Total population: 19,159 (Urban population: 16,260, Rural population: 1,858 (44 farm, 1,814 nonfarm))
Houses: 7,459 (6,308 occupied: 4,950 owner occupied, 1,358 renter occupied)
| % of renters here: | 22% |
| State: | 34% |
Housing density: 219 houses/condos per square mile
Median price asked for vacant for-sale houses and condos in 2022 in this county: $309,766.
Median contract rent in 2022: $1,242 (lower quartile is $963, upper quartile is $1,654)
Median rent asked for vacant for-rent units in 2022: $1,410
Median gross rent in East Lyme, CT in 2022: $1,441
Housing units in East Lyme with a mortgage: 3,156 (346 second mortgage, 431 home equity loan, 0 both second mortgage and home equity loan)
Houses without a mortgage: 1,311
Compare current foreclosures near East Lyme, CT:
| Photo | Address | Area | Beds / Baths | Price | Details |
|---|---|---|---|---|---|

|
#1
Latimer Dr
East Lyme, CT 06333
|
1,372 sq. feet
|
1 baths 3 beds |
show details | |

|
#2
Chesterfield Rd
East Lyme, CT 06333
|
1,548 sq. feet
|
2 baths 3 beds |
show details | |

|
#3
Lake Dr E
Oakdale, CT 06370
|
1,346 sq. feet
|
1 baths 3 beds |
$349,900
|
show details |

|
#4
Railroad Ave
Chester, CT 06412
|
2,092 sq. feet
|
2 baths 4 beds |
$484,900
|
show details |

|
#5
Rope Ferry Rd Unit N161
Waterford, CT 06385
|
576 sq. feet
|
1 baths 1 beds |
show details | |

|
#6
New London Rd
Colchester, CT 06415
|
1,938 sq. feet
|
3 baths 3 beds |
show details | |

|
#7
Vergennes Ct
Groton, CT 06340
|
- sq. feet
|
1 baths 4 beds |
show details | |

|
#8
Cow Hill Rd
Mystic, CT 06355
|
1,614 sq. feet
|
2 baths 3 beds |
show details | |

|
#9
Mount Parnassus Rd
East Haddam, CT 06423
|
2,328 sq. feet
|
3 baths 3 beds |
show details | |

|
#10
Hammond Ct
Colchester, CT 06415
|
1,152 sq. feet
|
1 baths 3 beds |
show details |
| Photo | Address | Area | Beds / Baths | Price | Details |
|---|---|---|---|---|---|

|
#11
Broad St
Norwich, CT 06360
|
1,703 sq. feet
|
1 baths 4 beds |
show details | |

|
#12
Candlewood Rd
Groton, CT 06340
|
2,064 sq. feet
|
1 baths 3 beds |
show details | |

|
#13
Boswell Ave
Norwich, CT 06360
|
2,244 sq. feet
|
4 baths 4 beds |
show details | |

|
#14
Vauxhall St
New London, CT 06320
|
930 sq. feet
|
1 baths 3 beds |
show details | |

|
#15
Kelsey Hill Rd
Deep River, CT 06417
|
2,848 sq. feet
|
3 baths 3 beds |
show details | |

|
#16
Laura Blvd # 294
Norwich, CT 06360
|
615 sq. feet
|
1 baths 2 beds |
show details | |

|
#17
Smith Ave
Norwich, CT 06360
|
780 sq. feet
|
2 baths 2 beds |
show details | |

|
#18
Cedar Meadow Rd
Moodus, CT 06469
|
2,030 sq. feet
|
2 baths 3 beds |
show details | |

|
#19
Haywardville Rd
East Haddam, CT 06423
|
1,132 sq. feet
|
1 baths 3 beds |
show details | |

|
#20
Great Hillwood Rd
Moodus, CT 06469
|
2,232 sq. feet
|
1 baths 4 beds |
show details |
| Photo | Address | Area | Beds / Baths | Price | Details |
|---|---|---|---|---|---|

|
#21
Prospect St # A
Deep River, CT 06417
|
1,486 sq. feet
|
2 baths 2 beds |
show details | |

|
#22
Breezy Knls
Mystic, CT 06355
|
1,376 sq. feet
|
1 baths 3 beds |
show details | |

|
#23
Prospect St
Norwich, CT 06360
|
1,572 sq. feet
|
1 baths 3 beds |
show details | |

|
#24
Shingle Point Rd
Preston, CT 06365
|
2,181 sq. feet
|
3 baths 4 beds |
show details | |

|
#25
Woodmont Cir
East Haddam, CT 06423
|
2,128 sq. feet
|
2 baths 3 beds |
show details | |

|
#26
Ventura Dr
Oakdale, CT 06370
|
1,080 sq. feet
|
1 baths 3 beds |
show details | |

|
#27
Main St
Deep River, CT 06417
|
1,248 sq. feet
|
2 baths 3 beds |
show details | |

|
#28
Kennedy Dr
Colchester, CT 06415
|
1,132 sq. feet
|
2 baths 3 beds |
show details | |

|
#29
Elijah St
Norwich, CT 06360
|
1,906 sq. feet
|
2 baths 5 beds |
show details | |

|
#30
Lake Dr E
Oakdale, CT 06370
|
1,371 sq. feet
|
2 baths 3 beds |
show details |
| Photo | Address | Area | Beds / Baths | Price | Details |
|---|---|---|---|---|---|

|
#31
Hemlock Rd
Groton, CT 06340
|
1,876 sq. feet
|
2 baths 3 beds |
show details | |

|
#32
W Thames St Unit 48
Norwich, CT 06360
|
1,080 sq. feet
|
2 baths 2 beds |
show details | |

|
#33
Sunset Ave
Norwich, CT 06360
|
1,152 sq. feet
|
1 baths 3 beds |
show details | |

|
#34
Kelseytown Rd
Killingworth, CT 06419
|
1,505 sq. feet
|
2 baths 4 beds |
show details | |

|
#35
Western Ave
Norwich, CT 06360
|
1,040 sq. feet
|
1 baths 3 beds |
show details | |

|
#36
Evergreen Dr
Clinton, CT 06413
|
1,344 sq. feet
|
1 baths 3 beds |
show details | |

|
#37
Parum Rd # 3-05
Colchester, CT 06415
|
1,503 sq. feet
|
1 baths 3 beds |
show details | |

|
#38
Mckinley Ave # 2
Norwich, CT 06360
|
2,482 sq. feet
|
2 baths 4 beds |
show details | |

|
#39
Ridge Rd
Chester, CT 06412
|
1,022 sq. feet
|
1 baths 2 beds |
show details | |

|
#40
Starr St
Norwich, CT 06360
|
2,207 sq. feet
|
2 baths 4 beds |
show details |
| Photo | Address | Area | Beds / Baths | Price | Details |
|---|---|---|---|---|---|

|
#41
Lumber Yard Rd
East Haddam, CT 06423
|
2,400 sq. feet
|
2 baths 6 beds |
show details | |

|
#42
Mathewson Mill Rd
Preston, CT 06365
|
3,240 sq. feet
|
2 baths 3 beds |
show details | |

|
#43
Route 2
Preston, CT 06365
|
936 sq. feet
|
1 baths 2 beds |
show details | |

|
#44
Sachem Ln
Ledyard, CT 06339
|
1,200 sq. feet
|
1 baths 3 beds |
show details | |

|
#45
Stevenstown Rd
Westbrook, CT 06498
|
1,092 sq. feet
|
1 baths 3 beds |
show details | |

|
#46
Sholes Ave
Norwich, CT 06360
|
1,362 sq. feet
|
1 baths 3 beds |
show details | |

|
#47
Westbrook Rd
Centerbrook, CT 06409
|
1,776 sq. feet
|
1 baths 2 beds |
show details | |

|
#48
Balawender Dr # 1
Norwich, CT 06360
|
2,052 sq. feet
|
2 baths 5 beds |
show details | |

|
#49
Blacksmith Dr
Ledyard, CT 06339
|
1,196 sq. feet
|
2 baths 4 beds |
show details | |

|
Check over 1 million property listings on Foreclosure.com!
|
browse all offers | |||

Household type by relationship:
Households: 261,273- In family households: 214,652 (47,484 male householders, 22,378 female householders)
52,173 spouses, 73,395 children (67,999 natural, 1,935 adopted, 3,461 stepchildren), 4,214 grandchildren, 2,063 brothers or sisters, 2,316 parents, foster children, 2,625 other relatives, 6,387 non-relatives
- In nonfamily households: 46,621 (18,056 male householders (13,616 living alone)), 19,139 female householders (15,978 living alone)), 9,426 nonrelatives
- In group quarters: 12,782 (5,482 institutionalized population)
43,726 married couples with children.
14,569 single-parent households (3,084 men, 11,485 women).
89.1% of residents of East Lyme speak English at home.
4.1% of residents speak Spanish at home (70% speak English very well, 21% speak English well, 9% speak English not well).
4.4% of residents speak other Indo-European language at home (69% speak English very well, 22% speak English well, 9% speak English not well).
2.0% of residents speak Asian or Pacific Island language at home (78% speak English very well, 12% speak English well, 10% speak English not well).
0.4% of residents speak other language at home (88% speak English very well, 12% speak English well).
Foreign born population: 1,480 (7.7%)
(58.4% of them are naturalized citizens)
| Here: | 6.5 |
| State: | 6.5 |
| Here: | 4.1 |
| State: | 4.0 |

- Bedrooms in owner-occupied houses and condos in East Lyme, Connecticut
- 0no bedroom
- 571 bedroom
- 1,0762 bedrooms
- 2,3503 bedrooms
- 1,2914 bedrooms
- 1765+ bedrooms

- Bedrooms in renter-occupied apartments in East Lyme, Connecticut
- 19no bedroom
- 3581 bedroom
- 6312 bedrooms
- 2903 bedrooms
- 604 bedrooms
- 05+ bedrooms

- Cars and other vehicles available in East Lyme in owner-occupied houses/condos
- 110no vehicle
- 1,1501 vehicle
- 2,5092 vehicles
- 9423 vehicles
- 1814 vehicles
- 585+ vehicles

- Cars and other vehicles available in East Lyme in renter-occupied apartments
- 116no vehicle
- 6561 vehicle
- 4922 vehicles
- 843 vehicles
- 04 vehicles
- 105+ vehicles

- Rooms in owner-occupied houses in East Lyme, Connecticut
- 01 room
- 52 rooms
- 403 rooms
- 4524 rooms
- 8225 rooms
- 9966 rooms
- 1,1567 rooms
- 7678 rooms
- 7129+ rooms

- Rooms in renter-occupied apartments in East Lyme, Connecticut
- 191 room
- 1112 rooms
- 3073 rooms
- 3634 rooms
- 3015 rooms
- 1376 rooms
- 927 rooms
- 148 rooms
- 149+ rooms


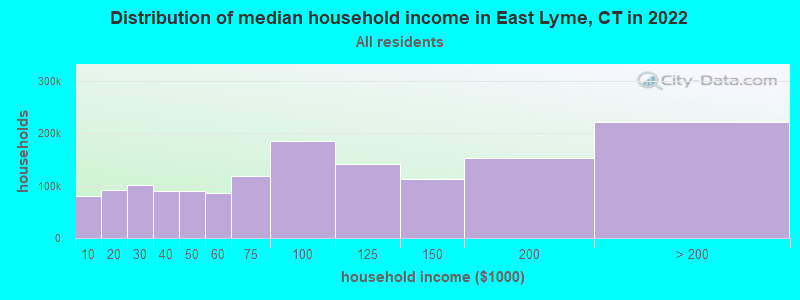
East Lyme, CT household income distribution

- 78,928Less than $10,000
- 90,291$10,000 to $19,999
- 100,772$20,000 to $29,999
- 88,407$30,000 to $39,999
- 89,067$40,000 to $49,999
- 86,088$50,000 to $59,999
- 117,124$60,000 to $74,999
- 184,404$75,000 to $99,999
- 140,350$100,000 to $124,999
- 111,952$125,000 to $149,999
- 152,134$150,000 to $199,999
- 220,293$200,000 or more
Percentage of workers working in this county: 78.7%
Number of people working at home: 1,430 (15.7% of all workers)
Travel time to work (commute)
- Less than 5 minutes: 242
- 5 to 9 minutes: 816
- 10 to 14 minutes: 966
- 15 to 19 minutes: 1,662
- 20 to 24 minutes: 1,749
- 25 to 29 minutes: 618
- 30 to 34 minutes: 640
- 35 to 39 minutes: 84
- 40 to 44 minutes: 144
- 45 to 59 minutes: 368
- 60 to 89 minutes: 377
- 90 or more minutes: 268
Means of transportation to work:
- Drove a car alone: 7,177 (87.8%)
- Carpooled: 632 (7.7%)
- Bus or trolley bus: 23 (0.3%)
- Ferryboat: 20 (0.2%)
- Walked: 56 (0.7%)
- Other means: 26 (0.3%)
- Worked at home: 241 (2.9%)


- Year of entry for the foreign-born population in East Lyme, Connecticut
- 1281995 to March 2000
- 2081990 to 1994
- 1851985 to 1989
- 1031980 to 1984
- 661975 to 1979
- 391970 to 1974
- 311965 to 1969
- 200Before 1965

First ancestries reported:
- Irish: 3,757 (16.7%)
- English: 2,983 (13.2%)
- Italian: 2,922 (13.0%)
- Other: 2,846 (12.6%)
- German: 2,334 (10.4%)
- Polish: 1,343 (6.0%)
- French: 990 (4.4%)
- French Canadian: 684 (3.0%)
- United States: 558 (2.5%)
- Swedish: 552 (2.5%)
- Scottish: 514 (2.3%)
- Scotch-Irish: 395 (1.8%)
- Russian: 379 (1.7%)
- Portuguese: 281 (1.2%)
- Dutch: 262 (1.2%)
- Ukrainian: 261 (1.2%)
- Norwegian: 257 (1.1%)
- Greek: 209 (0.9%)
- Lithuanian: 168 (0.7%)
- Subsaharan African: 167 (0.7%)
- Welsh: 151 (0.7%)
- Czech: 143 (0.6%)
- Hungarian: 115 (0.5%)
- Danish: 105 (0.5%)
- Swiss: 72 (0.3%)
- West Indian: 59 (0.3%)
- Arab: 20 (0.09%)
Most common places of birth for foreign-born residents (%):
| East Lyme: | 12.1% (116) |
| Connecticut: | 4.1% (15,108) |
| East Lyme: | 10.8% (104) |
| Connecticut: | 4.4% (16,395) |
| East Lyme: | 7.0% (67) |
| Connecticut: | 5.2% (19,083) |
| East Lyme: | 6.7% (64) |
| Connecticut: | 2.5% (9,358) |
| East Lyme: | 6.2% (60) |
| Connecticut: | 7.0% (26,023) |
| East Lyme: | 5.4% (52) |
| Connecticut: | 0.4% (1,503) |
| East Lyme: | 4.0% (38) |
| Connecticut: | 1.2% (4,344) |
| East Lyme: | 4.0% (38) |
| Connecticut: | 3.1% (11,432) |
| East Lyme: | 2.9% (28) |
| Connecticut: | 3.2% (12,009) |
| East Lyme: | 2.8% (27) |
| Connecticut: | 2.1% (7,596) |
| East Lyme: | 2.7% (26) |
| Connecticut: | 0.2% (654) |
| East Lyme: | 2.2% (21) |
| Connecticut: | 0.5% (1,723) |
| East Lyme: | 2.1% (20) |
| Connecticut: | 0.4% (1,483) |
| East Lyme: | 2.0% (19) |
| Connecticut: | 0.3% (1,180) |
| East Lyme: | 1.6% (15) |
| Connecticut: | 0.6% (2,106) |
| East Lyme: | 1.6% (15) |
| Connecticut: | 1.5% (5,508) |
| East Lyme: | 1.6% (15) |
| Connecticut: | 0.1% (545) |
| East Lyme: | 1.6% (15) |
| Connecticut: | 0.1% (299) |
Place of birth for U.S.-born residents:
- This state: 9,833
- Other state: 6,942
- Northeast: 4,484
- Midwest: 712
- South: 1,257
- West: 489
56% of East Lyme residents lived in the same house 5 years ago.
Out of people who lived in different houses, 47% lived in this county.
Out of people who lived in different counties, 55% lived in Connecticut.
Education attainment for males 25 years and older:
- No schooling: 17
- Nursery to 4th grade: 10
- 5th and 6th grade: 24
- 7th and 8th grade: 141
- 9th grade: 103
- 10th grade: 130
- 11th grade: 75
- 12th grade, no diploma: 162
- High school graduate (or equivalency): 1,618
- Less than 1 year of college: 487
- Some college more than 1 year, no degree: 754
- Associate degree: 366
- Bachelor's degree: 1,075
- Master's degree: 699
- Professional school degree: 196
- Doctorate degree: 235

Education attainment for females 25 years and older:
- No schooling: 29
- Nursery to 4th grade: 15
- 5th and 6th grade: 23
- 7th and 8th grade: 117
- 9th grade: 85
- 10th grade: 180
- 11th grade: 83
- 12th grade, no diploma: 166
- High school graduate (or equivalency): 1,805
- Less than 1 year of college: 556
- Some college more than 1 year, no degree: 917
- Associate degree: 523
- Bachelor's degree: 1,436
- Master's degree: 738
- Professional school degree: 142
- Doctorate degree: 84


Housing units in structures:
- One, detached: 6,119
- One, attached: 273
- Two: 286
- 3 or 4: 169
- 5 to 9: 262
- 10 to 19: 144
- 20 to 49: 97
- 50 or more: 101
- Mobile homes: 8
Median worth of mobile homes: $350,295
Housing units lacking complete kitchen facilities: 0.3%

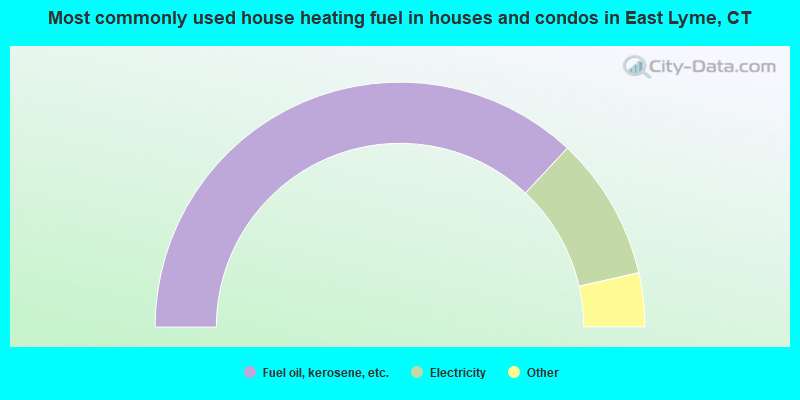
- 73.9%Fuel oil, kerosene, etc.
- 18.9%Electricity
- 3.7%Bottled, tank, or LP gas
- 2.0%Wood
- 0.5%Coal or coke
- 0.4%Utility gas
- 0.2%Other fuel
- 0.1%Solar energy
- 0.1%No fuel used
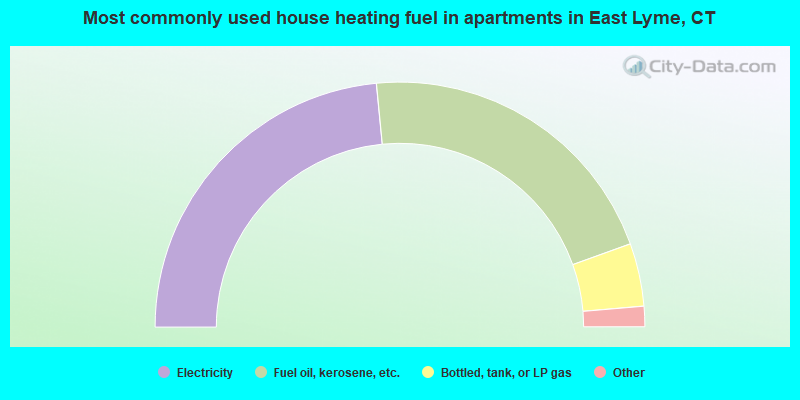
- 46.9%Electricity
- 42.0%Fuel oil, kerosene, etc.
- 8.3%Bottled, tank, or LP gas
- 1.2%Wood
- 0.8%Utility gas
- 0.7%Other fuel
Private vs. public school enrollment:
| Here: | 5.0% |
| Connecticut: | 9.9% |
| Here: | 6.2% |
| Connecticut: | 11.0% |
| Here: | 17.0% |
| Connecticut: | 33.4% |


