East Highland Park, VA (Virginia) Houses and Residents
Estimated median house or condo value in 2022: $214,304 (it was $76,600 in 2000 )
East Highland Park:
$214,304Virginia:
$365,700
Lower value quartile - upper value quartile: $148,575 - $261,264Mean price in 2022: Detached houses: $235,460 Here:
$235,460State:
$472,865
Townhouses or other attached units: $211,626 Here:
$211,626State:
$457,437
In 5-or-more-unit structures: $221,970 Here:
$221,970State:
$382,551
Total population: 14,796 (Urban population: 12,488, Rural population: 0)
Houses: 7,009 (6,709 occupied: 4,600 owner occupied, 2,114 renter occupied )
% of renters here:
31%State:
33%
Housing density: 782 houses/condos per square mile
Median price asked for vacant for-sale houses and condos in 2022: $102,037.
Median contract rent in 2022: $1,040 (lower quartile is $854, upper quartile is $1,323)
Median rent asked for vacant for-rent units in 2022: $900
Median gross rent in East Highland Park, VA in 2022: $1,224
Housing units in East Highland Park with a mortgage: 3,654 (476 second mortgage, 17 home equity loan, 205 both second mortgage and home equity loan )Houses without a mortgage: 29
Median household income for houses/condos with a mortgage: $82,895
Median household income for apartments without a mortgage: $47,486
Median monthly housing costs: $1,201
Data:
Median house or condo value ($)
Median house or condo value ($ change since 2000)
Median house or condo value ($) - White
Median house or condo value ($) - Black or African American
Median house or condo value ($) - Asian
Median house or condo value ($) - Hispanic or Latino
Median house or condo value ($) - American Indian and Alaska Native
Median house or condo value ($) - Multirace
Median house or condo value ($) - Other Race
Median price asked for mobile homes ($)
Household density (households per square mile)
Mean house or condo value by units in structure - 1, detached ($)
Mean house or condo value by units in structure - 1, attached ($)
Mean house or condo value by units in structure - 2 ($)
Mean house or condo value by units in structure by units in structure - 3 or 4 ($)
Mean house or condo value by units in structure - 5 or more ($)
Mean house or condo value by units in structure - Boat, RV, van, etc. ($)
Mean house or condo value by units in structure - Mobile home ($)
Median contract rent ($)
Median contract rent - Lower quartile ($)
Median contract rent - Upper quartile ($)
Median gross rent ($)
Urban houses (%)
Rural houses (%)
Houses occupied (%)
Houses occupied (% change since 2000)
Houses owner occupied (%)
Houses owner occupied (% change since 2000)
Houses renter occupied (%)
Houses renter occupied (% change since 2000)
Vacant housing units - For rent (%)
Vacant housing units - For rent (% change since 2000)
Vacant housing units - For sale only (%)
Vacant housing units - For sale only (% change since 2000)
Vacant housing units - Rented or sold, not occupied (%)
Vacant housing units - Rented or sold, not occupied (% change since 2000)
Vacant housing units - For seasonal, recreational, or occasional use (%)
Vacant housing units - For seasonal, recreational, or occasional use (% change since 2000)
Vacant housing units - For migrant workers (%)
Vacant housing units - For migrant workers (% change since 2000)
Vacant housing units - Other vacant (%)
Vacant housing units - Other vacant (% change since 2000)
Median monthly housing costs ($)
Median household income for houses/condos with a mortgage ($)
Median household income for houses/condos without a mortgage ($)
Median household income ($)
Median household income ($) - White
Median household income ($) - Black or African American
Median household income ($) - Asian
Median household income ($) - Hispanic or Latino
Median household income ($) - American Indian and Alaska Native
Median household income ($) - Multirace
Median household income ($) - Other Race
Mortgage status - with mortgage (%)
Mortgage status - with second mortgage (%)
Mortgage status - with home equity loan (%)
Mortgage status - with both second mortgage and home equity loan (%)
Mortgage status - without a mortgage (%)
Median year house/condo built
Median year apartment built
Household type by relationship - Male householder living alone (%)
Household type by relationship - Male householder not living alone (%)
Household type by relationship - Female householder living alone (%)
Household type by relationship - Female householder not living alone (%)
Household type by relationship - Opposite-Sex spouse (%)
Household type by relationship - Same-Sex spouse (%)
Household type by relationship - Opposite-Sex unmarried partner (%)
Household type by relationship - Same-Sex unmarried partner (%)
Household type by relationship - In group quarters (%)
Size of family households - 2-person household (%)
Size of family households - 3-person household (%)
Size of family households - 4-person household (%)
Size of family households - 5-person household (%)
Size of family households - 6-person household (%)
Size of family households - 7-or-more-person household (%)
Size of nonfamily households - 1-person household (%)
Size of nonfamily households - 2-person household (%)
Size of nonfamily households - 3-person household (%)
Size of nonfamily households - 4-person household (%)
Size of nonfamily households - 5-person household (%)
Size of nonfamily households - 6-person household (%)
Size of nonfamily households - 7-or-moreperson household (%)
Year house built - Built 2010 or later (%)
Year house built - Built 2000 to 2009 (%)
Year house built - Built 1990 to 1999 (%)
Year house built - Built 1980 to 1989 (%)
Year house built - Built 1970 to 1979 (%)
Year house built - Built 1960 to 1969 (%)
Year house built - Built 1950 to 1959 (%)
Year house built - Built 1940 to 1949 (%)
Year house built - Built 1939 or earlier (%)
Median number of rooms in houses and condos
Median number of rooms in apartments
Median number of bedrooms in owner occupied houses
Mean number of bedrooms in owner occupied houses
Median number of bedrooms in renter occupied houses
Mean number of bedrooms in renter occupied houses
Median number of vehichles in owner occupied houses
Mean number of vehichles in owner occupied houses
Median number of vehichles in renter occupied houses
Mean number of vehichles in renter occupied houses
Rooms in owner-occupied houses - 1 room (%)
Rooms in owner-occupied houses - 2 rooms (%)
Rooms in owner-occupied houses - 3 rooms (%)
Rooms in owner-occupied houses - 4 rooms (%)
Rooms in owner-occupied houses - 5 rooms (%)
Rooms in owner-occupied houses - 6 rooms (%)
Rooms in owner-occupied houses - 7 rooms (%)
Rooms in owner-occupied houses - 8 rooms (%)
Rooms in owner-occupied houses - 9+ rooms (%)
Rooms in renter-occupied houses - 1 room (%)
Rooms in renter-occupied houses - 2 rooms (%)
Rooms in renter-occupied houses - 3 rooms (%)
Rooms in renter-occupied houses - 4 rooms (%)
Rooms in renter-occupied houses - 5 rooms (%)
Rooms in renter-occupied houses - 6 rooms (%)
Rooms in renter-occupied houses - 7 rooms (%)
Rooms in renter-occupied houses - 8 rooms (%)
Rooms in renter-occupied houses - 9+ rooms (%)
Bedrooms in owner-occupied houses - no bedrooms (%)
Bedrooms in owner-occupied houses - 1 bedroom (%)
Bedrooms in owner-occupied houses - 2 bedrooms (%)
Bedrooms in owner-occupied houses - 3 bedrooms (%)
Bedrooms in owner-occupied houses - 4 bedrooms (%)
Bedrooms in owner-occupied houses - 5+ bedrooms (%)
Bedrooms in renter-occupied houses - no bedrooms (%)
Bedrooms in renter-occupied houses - 1 bedroom (%)
Bedrooms in renter-occupied houses - 2 bedrooms (%)
Bedrooms in renter-occupied houses - 3 bedrooms (%)
Bedrooms in renter-occupied houses - 4 bedrooms (%)
Bedrooms in renter-occupied houses - 5+ bedrooms (%)
Vehicles available in owner-occupied houses - no vehicle available (%)
Vehicles available in owner-occupied houses - 1 vehicle available(%)
Vehicles available in owner-occupied houses - 2 Vehicles available (%)
Vehicles available in owner-occupied houses - 3 Vehicles available (%)
Vehicles available in owner-occupied houses - 4 Vehicles available (%)
Vehicles available in owner-occupied houses - 5+ Vehicles available (%)
Vehicles available in renter-occupied houses - no vehicle available (%)
Vehicles available in renter-occupied houses - 1 vehicle available (%)
Vehicles available in renter-occupied houses - 2 Vehicles available (%)
Vehicles available in renter-occupied houses - 3 Vehicles available (%)
Vehicles available in renter-occupied houses - 4 Vehicles available (%)
Vehicles available in renter-occupied houses - 5+ Vehicles available (%)
Housing units in structures - 1, detached (%)
Housing units in structures - 1, attached (%)
Housing units in structures - 2 (%)
Housing units in structures - 3 or 4 (%)
Housing units in structures - 5 to 9 (%)
Housing units in structures - 10 to 19 (%)
Housing units in structures - 20 to 49 (%)
Housing units in structures - 50 or more (%)
Housing units in structures - Mobile home (%)
Housing units in structures - Boat, RV, van, etc. (%)
Housing units in structures - Owners - 1, detached (%)
Housing units in structures - Owners - 1, attached (%)
Housing units in structures - Owners - 2 (%)
Housing units in structures - Owners - 3 or 4 (%)
Housing units in structures - Owners - 5 to 9 (%)
Housing units in structures - Owners - 10 to 19 (%)
Housing units in structures - Owners - 20 to 49 (%)
Housing units in structures - Owners - 50 or more (%)
Housing units in structures - Owners - Mobile home (%)
Housing units in structures - Owners - Boat, RV, van, etc. (%)
Housing units in structures - Renters - 1, detached (%)
Housing units in structures - Renters - 1, attached (%)
Housing units in structures - Renters - 2 (%)
Housing units in structures - Renters - 3 or 4 (%)
Housing units in structures - Renters - 5 to 9 (%)
Housing units in structures - Renters - 10 to 19 (%)
Housing units in structures - Renters - 20 to 49 (%)
Housing units in structures - Renters - 50 or more (%)
Housing units in structures - Renters - Mobile home (%)
Housing units in structures - Renters - Boat, RV, van, etc. (%)
House/condo owner moved in on average (years ago)
Renter moved in on average (years ago)
Year householder moved into unit - Moved in 1999 to March 2000 (%)
Year householder moved into unit - Moved in 1999 to March 2000 (%) - White
Year householder moved into unit - Moved in 1999 to March 2000 (%) - Black or African American
Year householder moved into unit - Moved in 1999 to March 2000 (%) - Asian
Year householder moved into unit - Moved in 1999 to March 2000 (%) - Hispanic or Latino
Year householder moved into unit - Moved in 1999 to March 2000 (%) - American Indian and Alaska Native
Year householder moved into unit - Moved in 1999 to March 2000 (%) - Multirace
Year householder moved into unit - Moved in 1999 to March 2000 (%) - Other Race
Year householder moved into unit - Moved in 1995 to 1998 (%)
Year householder moved into unit - Moved in 1995 to 1998 (%) - White
Year householder moved into unit - Moved in 1995 to 1998 (%) - Black or African American
Year householder moved into unit - Moved in 1995 to 1998 (%) - Asian
Year householder moved into unit - Moved in 1995 to 1998 (%) - Hispanic or Latino
Year householder moved into unit - Moved in 1995 to 1998 (%) - American Indian and Alaska Native
Year householder moved into unit - Moved in 1995 to 1998 (%) - Multirace
Year householder moved into unit - Moved in 1995 to 1998 (%) - Other Race
Year householder moved into unit - Moved in 1990 to 1994 (%)
Year householder moved into unit - Moved in 1990 to 1994 (%) - White
Year householder moved into unit - Moved in 1990 to 1994 (%) - Black or African American
Year householder moved into unit - Moved in 1990 to 1994 (%) - Asian
Year householder moved into unit - Moved in 1990 to 1994 (%) - Hispanic or Latino
Year householder moved into unit - Moved in 1990 to 1994 (%) - American Indian and Alaska Native
Year householder moved into unit - Moved in 1990 to 1994 (%) - Multirace
Year householder moved into unit - Moved in 1990 to 1994 (%) - Other Race
Year householder moved into unit - Moved in 1980 to 1989 (%)
Year householder moved into unit - Moved in 1980 to 1989 (%) - White
Year householder moved into unit - Moved in 1980 to 1989 (%) - Black or African American
Year householder moved into unit - Moved in 1980 to 1989 (%) - Asian
Year householder moved into unit - Moved in 1980 to 1989 (%) - Hispanic or Latino
Year householder moved into unit - Moved in 1980 to 1989 (%) - American Indian and Alaska Native
Year householder moved into unit - Moved in 1980 to 1989 (%) - Multirace
Year householder moved into unit - Moved in 1980 to 1989 (%) - Other Race
Year householder moved into unit - Moved in 1970 to 1979 (%)
Year householder moved into unit - Moved in 1970 to 1979 (%) - White
Year householder moved into unit - Moved in 1970 to 1979 (%) - Black or African American
Year householder moved into unit - Moved in 1970 to 1979 (%) - Asian
Year householder moved into unit - Moved in 1970 to 1979 (%) - Hispanic or Latino
Year householder moved into unit - Moved in 1970 to 1979 (%) - American Indian and Alaska Native
Year householder moved into unit - Moved in 1970 to 1979 (%) - Multirace
Year householder moved into unit - Moved in 1970 to 1979 (%) - Other Race
Year householder moved into unit - Moved in 1969 or earlier (%)
Year householder moved into unit - Moved in 1969 or earlier (%) - White
Year householder moved into unit - Moved in 1969 or earlier (%) - Black or African American
Year householder moved into unit - Moved in 1969 or earlier (%) - Asian
Year householder moved into unit - Moved in 1969 or earlier (%) - Hispanic or Latino
Year householder moved into unit - Moved in 1969 or earlier (%) - American Indian and Alaska Native
Year householder moved into unit - Moved in 1969 or earlier (%) - Multirace
Year householder moved into unit - Moved in 1969 or earlier (%) - Other Race
Housing units lacking complete plumbing facilities (%)
Housing units lacking complete kitchen facilities (%)
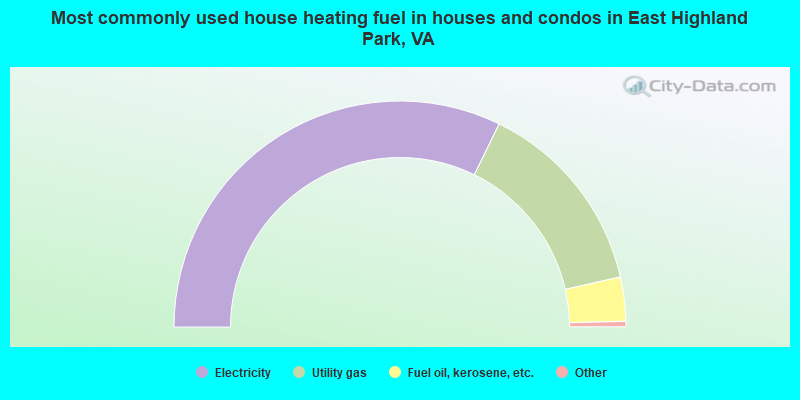
House heating fuel used in houses and condos - Utility gas (%)
House heating fuel used in houses and condos - Bottled, tank, or LP gas (%)
House heating fuel used in houses and condos - Electricity (%)
House heating fuel used in houses and condos - Fuel oil, kerosene, etc. (%)
House heating fuel used in houses and condos - Coal or coke (%)
House heating fuel used in houses and condos - Wood (%)
House heating fuel used in houses and condos - Solar energy (%)
House heating fuel used in houses and condos - Other fuel (%)
House heating fuel used in houses and condos - No fuel used (%)
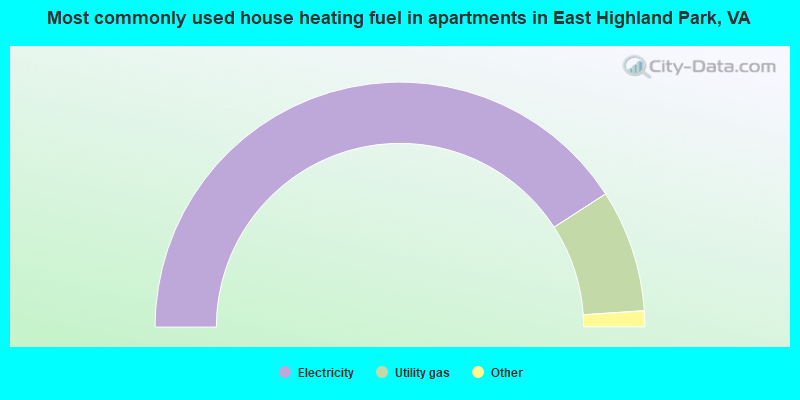
House heating fuel used in apartments - Utility gas (%)
House heating fuel used in apartments - Bottled, tank, or LP gas (%)
House heating fuel used in apartments - Electricity (%)
House heating fuel used in apartments - Fuel oil, kerosene, etc. (%)
House heating fuel used in apartments - Coal or coke (%)
House heating fuel used in apartments - Wood (%)
House heating fuel used in apartments - Solar energy (%)
House heating fuel used in apartments - Other fuel (%)
House heating fuel used in apartments - No fuel used (%)
Median year house/condo built: 1980Median year apartment built: 1970Household type by relationship:
Households: 16,540
Male householders: 2,231 (738 living alone ), Female householders: 4,339 (1,232 living alone )2,309 spouses (2,309 opposite-sex spouses ), 537 unmarried partners , (520 opposite-sex unmarried partners ), 4,922 children (4,255 natural , 311 adopted , 354 stepchildren ), 536 grandchildren , 295 brothers or sisters , 264 parents , 0 foster children , 440 other relatives , 625 non-relatives In group quarters: 37
Size of family households: 1,830 2-persons , 1,226 3-persons , 668 4-persons , 323 5-persons , 179 6-persons , 24 7-or-more-persons .
Size of nonfamily households: 2,033 1-person , 386 2-persons , 48 3-persons .
1,448 married couples with children. single-parent households (363 men , 905 women ).
95.7% of residents of East Highland Park speak English at home. of residents speak Spanish at home (80% speak English very well , 20% speak English not well ).of residents speak other Indo-European language at home (48% speak English very well , 11% speak English well , 42% speak English not well ).of residents speak other language at home (85% speak English very well , 15% speak English well ).
Foreign born population: 370 (2.2%)of them are naturalized citizens )
Median number of rooms in houses and condos:
Median number of rooms in apartments
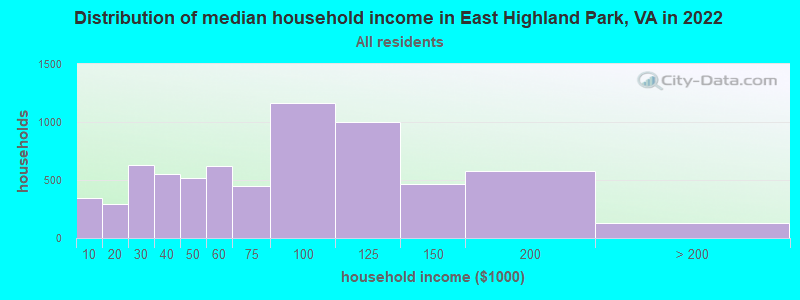
East Highland Park, VA household income distribution 346 Less than $10,000292 $10,000 to $19,999633 $20,000 to $29,999548 $30,000 to $39,999517 $40,000 to $49,999624 $50,000 to $59,999445 $60,000 to $74,9991,166 $75,000 to $99,999999 $100,000 to $124,999465 $125,000 to $149,999575 $150,000 to $199,999126 $200,000 or more
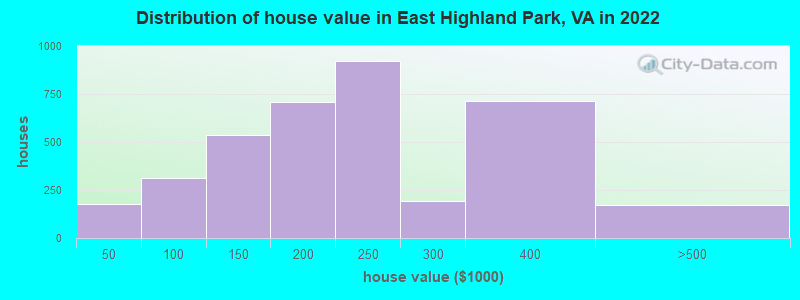
Home value of owner - occupied houses in 2022 in East Highland Park, VA 17 $10,000 to $14,99964 $15,000 to $19,99965 $30,000 to $34,99931 $40,000 to $49,99979 $50,000 to $59,99976 $60,000 to $69,99934 $70,000 to $79,99924 $80,000 to $89,99970 $90,000 to $99,999262 $100,000 to $124,999274 $125,000 to $149,999383 $150,000 to $174,999321 $175,000 to $199,999921 $200,000 to $249,999192 $250,000 to $299,999713 $300,000 to $399,999167 $400,000 to $499,9994 $500,000 to $749,999Rent paid by renters in 2022 in East Highland Park, VA 29 $400 to $4499 $450 to $4998 $500 to $54917 $600 to $64915 $650 to $699102 $700 to $749101 $750 to $799346 $800 to $899277 $900 to $999531 $1,000 to $1,249292 $1,250 to $1,49946 $1,500 to $1,99990 $2,000 to $2,49938 No cash rent
Percentage of workers working in this county: 54.9%Number of people working at home: 1,330 (14.3% of all workers )
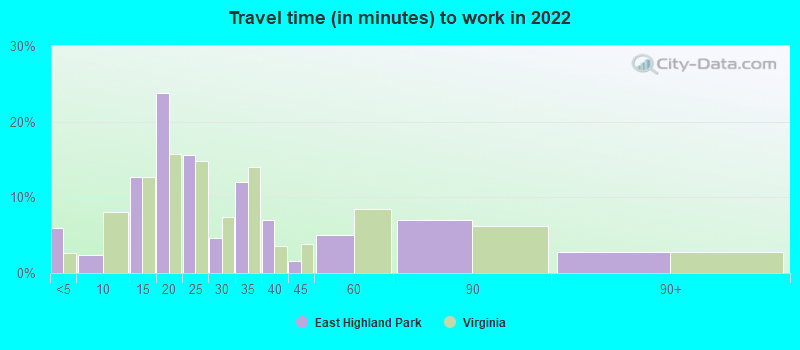
Travel time to work (commute)
Less than 5 minutes: 3535 to 9 minutes: 20210 to 14 minutes: 69215 to 19 minutes: 1,42820 to 24 minutes: 1,83425 to 29 minutes: 1,05330 to 34 minutes: 1,35535 to 39 minutes: 24240 to 44 minutes: 20845 to 59 minutes: 30060 to 89 minutes: 8290 or more minutes: 154
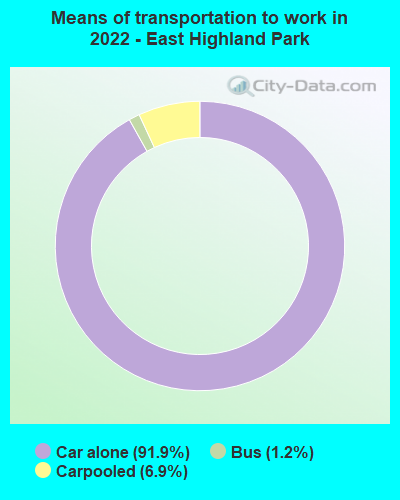
Means of transportation to work:
Drove a car alone: 1,726 (56.4%)Carpooled: 140 (4.6%)Bus : 13 (0.4%)Taxi: 1 (0.0%)Worked at home: 1,330 (43.5%)
Unemployment by race in 2022
Unemployment rate for White non-Hispanic residents 4.9% Males8.4% FemalesUnemployment rate for Black residents 8.2% Males0.8% FemalesUnemployment rate for two or more race residents 7.4% Males
Year of entry for the foreign-born population in East Highland Park, Virginia
140 2010 or later 111 2000 to 2009 19 1990 to 1999 45 1980 to 1989 40 1970 to 1979 35 Before 1970
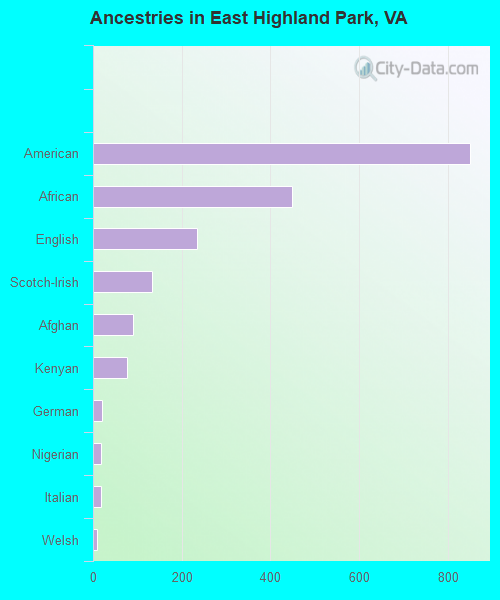
First ancestries reported:
American: 851 (7.6%)
African: 448 (4.0%)
English: 235 (2.1%)
Scotch-Irish: 133 (1.2%)
Afghan: 91 (0.8%)
Kenyan: 77 (0.7%)
German: 20 (0.2%)
Nigerian: 19 (0.2%)
Italian: 18 (0.2%)
Welsh: 8 (0.07%)
Irish: 6 (0.05%)
Polish: 5 (0.04%) Most common places of birth for foreign-born residents (%): South Africa East Highland Park:
35.6% (137)Virginia:
0.3% (2,829)
Kenya East Highland Park:
29.6% (114)Virginia:
0.3% (3,799)
Afghanistan East Highland Park:
27.0% (104)Virginia:
1.8% (19,426)
Africa, n.e.c. East Highland Park:
14.0% (54)Virginia:
0.3% (3,275)
Mexico East Highland Park:
7.3% (28)Virginia:
5.3% (57,498)
United Kingdom, excluding England and Scotland East Highland Park:
4.9% (19)Virginia:
0.8% (8,513)
India East Highland Park:
2.1% (8)Virginia:
9.0% (97,830)
Place of birth for U.S.-born residents:
This state: 12,438Other state: 3,592Northeast: 1,589Midwest: 88South: 1,730West: 181 92.8% of East Highland Park residents lived in the same house 1 years ago.
Out of people who lived in different houses, 38.9% lived in this county.
Out of people who lived in different counties, 75.1% lived in Virginia.
East Highland Park:
92.8%State average:
86.6%
Education attainment for males 25 years and older:
No schooling: 15Nursery to 4th grade: 05th and 6th grade: 97th and 8th grade: 559th grade: 9010th grade: 9111th grade: 18512th grade, no diploma: 190High school graduate (or equivalency): 2,096Less than 1 year of college: 462Some college more than 1 year, no degree: 894Associate degree: 305Bachelor's degree: 587Master's degree: 149Professional school degree: 0Doctorate degree: 144
Education attainment for females 25 years and older:
No schooling: 55Nursery to 4th grade: 115th and 6th grade: 07th and 8th grade: 349th grade: 710th grade: 14011th grade: 12012th grade, no diploma: 98High school graduate (or equivalency): 1,896Less than 1 year of college: 455Some college more than 1 year, no degree: 1,001Associate degree: 630Bachelor's degree: 1,065Master's degree: 694Professional school degree: 55Doctorate degree: 5
Housing units in structures:
One, detached: 5,683One, attached: 546Two: 1693 or 4: 675 to 9: 24410 to 19: 15620 to 49: 1550 or more: 109Mobile homes: 15Housing units lacking complete kitchen facilities in 2022: 0.5%House/condo owner moved in on average 16 years ago
Renter moved in on average 5 years ago
Private vs. public school enrollment:
Students in private schools in grades 1 to 8 (elementary and middle school): 333 Students in private schools in grades 9 to 12 (high school): 108 Students in private undergraduate colleges: 199