Housing density: 173 houses/condos per square mile
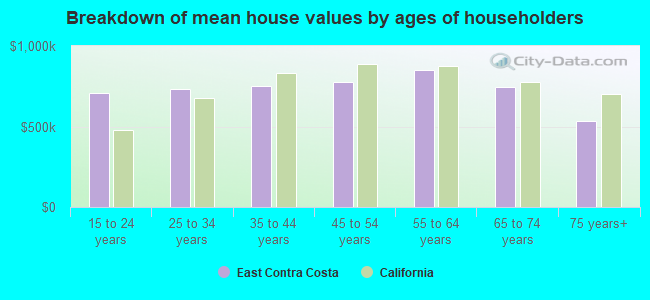
Median price asked for vacant for-sale houses and condos in 2022 in this county: $378,161.
Median contract rent in 2022: $1,870 (lower quartile is $1,278, upper quartile is over $2,000)
Median rent asked for vacant for-rent units in 2022: $1,966
Median gross rent in East Contra Costa, CA in 2022: over $2,000
Housing units in East Contra Costa with a mortgage: 15,742 (3,373 second mortgage, 1,225 home equity loan, 62 both second mortgage and home equity loan) Houses without a mortgage: 2,224
Compare current foreclosures near East Contra Costa, CA:
In family households: 895,275 (185,206 male householders, 80,074 female householders)
199,021 spouses, 320,947 children (302,778 natural, 6,543 adopted, 11,626 stepchildren), 20,722 grandchildren, 14,424 brothers or sisters, 13,961 parents, foster children, 21,146 other relatives, 29,185 non-relatives
In nonfamily households: 143,436 (48,395 male householders (34,478 living alone)), 61,689 female householders (50,577 living alone)), 33,352 nonrelatives
In group quarters: 10,314 (5,346 institutionalized population)
175,577 married couples with children.
49,858 single-parent households (12,019 men, 37,839 women).
80.8% of residents of East Contra Costa speak English at home.
14.4% of residents speak Spanish at home (51% speak English very well, 21% speak English well, 17% speak English not well, 12% don't speak English at all).
1.9% of residents speak other Indo-European language at home (69% speak English very well, 24% speak English well, 6% speak English not well).
2.7% of residents speak Asian or Pacific Island language at home (62% speak English very well, 24% speak English well, 13% speak English not well, 1% don't speak English at all).
0.2% of residents speak other language at home (96% speak English very well, 4% speak English not well).
Foreign born population: 14,901 (16.6%)
(52.5% of them are naturalized citizens)
Percentage of workers working in this county: 73.2% Number of people working at home: 8,472 (20.7% of all workers)
Travel time to work (commute)
Less than 5 minutes: 783
5 to 9 minutes: 2,510
10 to 14 minutes: 2,386
15 to 19 minutes: 2,730
20 to 24 minutes: 1,684
25 to 29 minutes: 595
30 to 34 minutes: 2,493
35 to 39 minutes: 888
40 to 44 minutes: 1,240
45 to 59 minutes: 4,630
60 to 89 minutes: 6,934
90 or more minutes: 4,266
Means of transportation to work:
Drove a car alone: 24,559 (75.5%)
Carpooled: 4,862 (15.0%)
Bus or trolley bus: 287 (0.9%)
Streetcar or trolley car: 9 (0.0%)
Subway or elevated: 411 (1.3%)
Railroad: 113 (0.3%)
Ferryboat: 3 (0.0%)
Taxi: 15 (0.0%)
Motorcycle: 20 (0.1%)
Bicycle: 39 (0.1%)
Walked: 570 (1.8%)
Other means: 251 (0.8%)
Worked at home: 1,379 (4.2%)
Year of entry for the foreign-born population in East Contra Costa, California
1,7721995 to March 2000
9991990 to 1994
1,4371985 to 1989
1,0761980 to 1984
1,0541975 to 1979
7721970 to 1974
4961965 to 1969
1,013Before 1965
Most common places of birth for foreign-born residents (%):
Mexico
East Contra Costa:
52.5% (4,529)
California:
44.3% (3,928,701)
Philippines
East Contra Costa:
11.9% (1,024)
California:
7.5% (664,935)
United Kingdom
East Contra Costa:
4.2% (364)
California:
1.5% (133,090)
Canada
East Contra Costa:
3.7% (321)
California:
1.6% (141,181)
Nicaragua
East Contra Costa:
3.1% (268)
California:
0.7% (64,411)
Portugal
East Contra Costa:
2.3% (198)
California:
0.4% (32,315)
China, excluding Hong Kong and Taiwan
East Contra Costa:
2.1% (180)
California:
3.7% (327,611)
El Salvador
East Contra Costa:
1.8% (155)
California:
4.1% (359,673)
Vietnam
East Contra Costa:
1.7% (145)
California:
4.7% (418,249)
Germany
East Contra Costa:
1.5% (133)
California:
1.1% (98,160)
Place of birth for U.S.-born residents:
This state: 48,309
Other state: 16,096
Northeast: 2,564
Midwest: 4,999
South: 4,268
West: 4,265
49% of East Contra Costa residents lived in the same house 5 years ago. Out of people who lived in different houses, 51% lived in this county. Out of people who lived in different counties, 84% lived in California.
Education attainment for males 25 years and older:
No schooling: 225
Nursery to 4th grade: 193
5th and 6th grade: 454
7th and 8th grade: 393
9th grade: 370
10th grade: 466
11th grade: 370
12th grade, no diploma: 968
High school graduate (or equivalency): 5,953
Less than 1 year of college: 2,014
Some college more than 1 year, no degree: 4,626
Associate degree: 1,928
Bachelor's degree: 3,370
Master's degree: 816
Professional school degree: 227
Doctorate degree: 105
Education attainment for females 25 years and older:
No schooling: 262
Nursery to 4th grade: 210
5th and 6th grade: 374
7th and 8th grade: 376
9th grade: 413
10th grade: 454
11th grade: 414
12th grade, no diploma: 822
High school graduate (or equivalency): 6,076
Less than 1 year of college: 2,807
Some college more than 1 year, no degree: 4,568
Associate degree: 1,927
Bachelor's degree: 3,254
Master's degree: 612
Professional school degree: 242
Doctorate degree: 49
Housing units in structures:
One, detached: 21,819
One, attached: 838
Two: 155
3 or 4: 257
5 to 9: 98
10 to 19: 140
20 to 49: 170
50 or more: 222
Mobile homes: 1,599
Boats, RVs, vans, etc.: 157
Median worth of mobile homes: $139,900
Housing units lacking complete plumbing facilities: 0.8%
Housing units lacking complete kitchen facilities: 0.7%