East Aurora, NY (New York) Houses and Residents
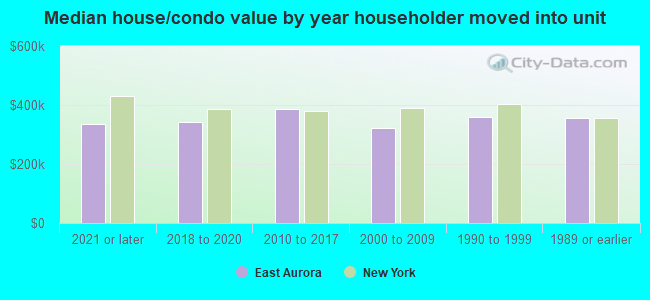
| East Aurora: | $361,029 |
| New York: | $400,400 |
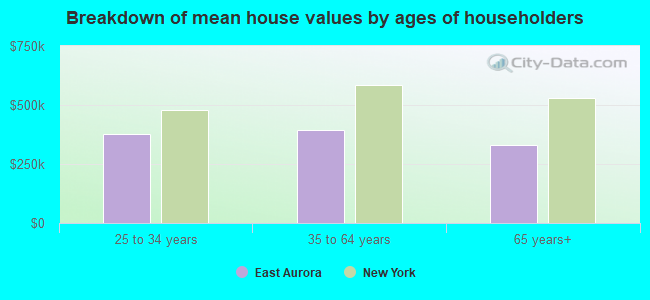
Mean price in 2022:
Detached houses: $353,755
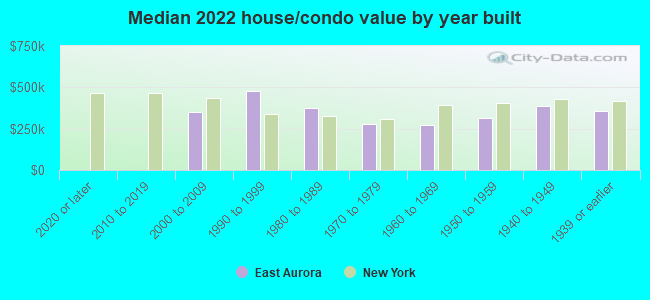
Here: $353,755 State: $476,719 Townhouses or other attached units: $215,938
Here: $215,938 State: $699,270 In 2-unit structures: $447,734
Here: $447,734 State: $713,077 In 3-to-4-unit structures: $219,924
Here: $219,924 State: $764,568 In 5-or-more-unit structures: $161,874
Here: $161,874 State: $912,009
Total population: 6,264 (All urban)
Houses: 2,626 (2,401 occupied: 1,698 owner occupied, 717 renter occupied)
| % of renters here: | 30% |
| State: | 46% |
Housing density: 1,044 houses/condos per square mile
Median price asked for vacant for-sale houses and condos in 2022: $308,386.
Median contract rent in 2022: $913 (lower quartile is $811, upper quartile is $1,318)
Median rent asked for vacant for-rent units in 2022: $2,179
Median gross rent in East Aurora, NY in 2022: $1,008
Housing units in East Aurora with a mortgage: 1,020 (253 second mortgage, 0 home equity loan, 247 both second mortgage and home equity loan)
Houses without a mortgage: 34
Median household income for houses/condos with a mortgage: $150,105
Median household income for apartments without a mortgage: $82,491
Median monthly housing costs: $1,261
Compare current foreclosures near East Aurora, NY:
| Photo | Address | Area | Beds / Baths | Price | Details |
|---|---|---|---|---|---|

|
#1
Meadow Dr
East Aurora, NY 14052
|
1,668 sq. feet
|
1 baths 3 beds |
show details | |

|
#2
South St
East Aurora, NY 14052
|
1,496 sq. feet
|
1 baths 2 beds |
show details | |

|
#3
Four Rod Rd
East Aurora, NY 14052
|
2,276 sq. feet
|
1 baths 4 beds |
show details | |

|
#4
Four Rod Rd
East Aurora, NY 14052
|
2,380 sq. feet
|
1 baths 2 beds |
show details | |

|
#5
Hilliker Ct
East Aurora, NY 14052
|
924 sq. feet
|
2 baths 4 beds |
show details | |

|
#6
Walnut St
East Aurora, NY 14052
|
2,244 sq. feet
|
2 baths 4 beds |
show details | |

|
#7
Girard Ave
East Aurora, NY 14052
|
1,748 sq. feet
|
1 baths 4 beds |
show details | |

|
#8
Dorchester Rd
East Aurora, NY 14052
|
3,191 sq. feet
|
4 baths 5 beds |
show details | |

|
#9
Warren Dr
East Aurora, NY 14052
|
1,428 sq. feet
|
1 baths 4 beds |
show details | |

|
#10
Sycamore St
East Aurora, NY 14052
|
964 sq. feet
|
1 baths 4 beds |
show details |
| Photo | Address | Area | Beds / Baths | Price | Details |
|---|---|---|---|---|---|

|
#11
Parkdale Ave
East Aurora, NY 14052
|
1,459 sq. feet
|
1 baths 3 beds |
show details | |

|
#12
Center St
East Aurora, NY 14052
|
1,678 sq. feet
|
2 baths 3 beds |
show details | |

|
#13
Woods Rd
East Aurora, NY 14052
|
1,645 sq. feet
|
1 baths 3 beds |
show details | |

|
#14
Warren Dr
East Aurora, NY 14052
|
3,485 sq. feet
|
2 baths 4 beds |
show details | |

|
#15
Creek Rd
East Aurora, NY 14052
|
1,356 sq. feet
|
1 baths 2 beds |
show details | |

|
#16
Main St Ste 203
East Aurora, NY 14052
|
- sq. feet
|
- baths - beds |
show details | |

|
#17
N Star Rd
East Aurora, NY 14052
|
- sq. feet
|
- baths - beds |
show details | |

|
#18
Lee St
Depew, NY 14043
|
1,040 sq. feet
|
1 baths 3 beds |
$169,900
|
show details |

|
#19
N Boston Rd
Eden, NY 14057
|
792 sq. feet
|
1 baths 3 beds |
$45,000
|
show details |

|
#20
Heussy Ave
Buffalo, NY 14220
|
1,455 sq. feet
|
2 baths 3 beds |
$259,900
|
show details |
| Photo | Address | Area | Beds / Baths | Price | Details |
|---|---|---|---|---|---|

|
#21
Maple Dr
Bowmansville, NY 14026
|
4,508 sq. feet
|
3 baths 3 beds |
show details | |

|
#22
Jamison Rd
Elma, NY 14059
|
2,457 sq. feet
|
2 baths 4 beds |
show details | |

|
#23
Eureka Pl
Buffalo, NY 14204
|
1,308 sq. feet
|
1 baths 3 beds |
show details | |

|
#24
Pinehurst Ave
Buffalo, NY 14225
|
1,050 sq. feet
|
1 baths 3 beds |
show details | |

|
#25
Alma Ave
Buffalo, NY 14215
|
2,366 sq. feet
|
2 baths 4 beds |
show details | |

|
#26
E Frontier Dr
Buffalo, NY 14219
|
1,136 sq. feet
|
1 baths 3 beds |
show details | |

|
#27
Bickford Ave
Buffalo, NY 14215
|
1,462 sq. feet
|
2 baths 3 beds |
show details | |

|
#28
Dempster St
Buffalo, NY 14206
|
1,070 sq. feet
|
1 baths 3 beds |
show details | |

|
#29
Sierk Rd
Attica, NY 14011
|
- sq. feet
|
- baths - beds |
$43,900
|
show details |

|
#30
Central Blvd
Buffalo, NY 14225
|
1,406 sq. feet
|
1 baths 3 beds |
show details |
| Photo | Address | Area | Beds / Baths | Price | Details |
|---|---|---|---|---|---|

|
#31
Northumberland Ave
Buffalo, NY 14215
|
1,080 sq. feet
|
1 baths 3 beds |
show details | |

|
#32
Shamokin Dr
Buffalo, NY 14218
|
1,420 sq. feet
|
1 baths 3 beds |
show details | |

|
#33
Aurora Ave
Buffalo, NY 14224
|
1,040 sq. feet
|
1 baths 2 beds |
show details | |

|
#34
Eastwood Ave
Hamburg, NY 14075
|
2,206 sq. feet
|
2 baths 3 beds |
show details | |

|
#35
Genesee St
Corfu, NY 14036
|
1,458 sq. feet
|
1 baths 3 beds |
show details | |

|
#36
George Dr
Buffalo, NY 14224
|
1,706 sq. feet
|
1 baths 3 beds |
show details | |

|
#37
Old Glenwood Rd
West Falls, NY 14170
|
2,096 sq. feet
|
1 baths 3 beds |
show details | |

|
#38
Abbott Rd
Orchard Park, NY 14127
|
1,232 sq. feet
|
1 baths 3 beds |
show details | |

|
#39
Newman St
Buffalo, NY 14218
|
1,344 sq. feet
|
1 baths 3 beds |
show details | |

|
#40
Miami Pkwy
Buffalo, NY 14225
|
1,530 sq. feet
|
1 baths 2 beds |
show details |
| Photo | Address | Area | Beds / Baths | Price | Details |
|---|---|---|---|---|---|

|
#41
Evergreen Pl
Buffalo, NY 14225
|
1,085 sq. feet
|
1 baths 4 beds |
show details | |

|
#42
Eckhardt Rd
Hamburg, NY 14075
|
1,600 sq. feet
|
1 baths 3 beds |
show details | |

|
#43
Cathedral Ln
Buffalo, NY 14225
|
1,323 sq. feet
|
1 baths 3 beds |
show details | |

|
#44
N Forest Rd
Buffalo, NY 14221
|
1,340 sq. feet
|
1 baths 3 beds |
show details | |

|
#45
Dewey Ave
Buffalo, NY 14214
|
1,304 sq. feet
|
1 baths 3 beds |
show details | |

|
#46
Poultney Ave
Buffalo, NY 14215
|
1,339 sq. feet
|
1 baths 3 beds |
show details | |

|
#47
Bailey Ave
Buffalo, NY 14226
|
2,673 sq. feet
|
2 baths 4 beds |
show details | |

|
#48
Wagner Ave
Buffalo, NY 14212
|
827 sq. feet
|
1 baths 2 beds |
show details | |

|
#49
Santin Dr
Buffalo, NY 14225
|
1,884 sq. feet
|
1 baths 3 beds |
show details | |

|
Check over 1 million property listings on Foreclosure.com!
|
browse all offers | |||


 | Upstate NY Housing Market Demand ranked by township (23 replies) |
| Buffalo-Boom/Bust II (612 replies) |
| What is Batavia like? (218 replies) |
| Buffalo and WNY Greatest Ambassador (101 replies) |
| Upstate NY job openings...... (1435 replies) |
| Conflicting priorities: Rustic + Wegmans (88 replies) |

Median year apartment built: 1945
Household type by relationship:
Households: 5,990- Male householders: 1,162 (300 living alone), Female householders: 1,221 (382 living alone)
1,392 spouses (1,392 opposite-sex spouses), 118 unmarried partners, (118 opposite-sex unmarried partners), 1,575 children (1,518 natural, 23 adopted, 32 stepchildren), 32 grandchildren, 0 brothers or sisters, 5 parents, 0 foster children, 11 other relatives, 9 non-relatives
- In group quarters: 457
Size of family households: 862 2-persons, 400 3-persons, 239 4-persons, 152 5-persons, 19 6-persons, 4 7-or-more-persons.
Size of nonfamily households: 683 1-person, 75 2-persons.
901 married couples with children.
262 single-parent households (97 men, 165 women).
98.2% of residents of East Aurora speak English at home.
0.2% of residents speak Spanish at home (100% speak English very well).
0.9% of residents speak other Indo-European language at home (85% speak English very well, 15% speak English not well).
0.4% of residents speak Asian or Pacific Island language at home (100% speak English very well).
0.9% of residents speak other language at home (100% speak English very well).
Foreign born population: 123 (2.1%)
(61.0% of them are naturalized citizens)
| Here: | 7.3 |
| State: | 6.3 |
| Here: | 4.4 |
| State: | 3.8 |
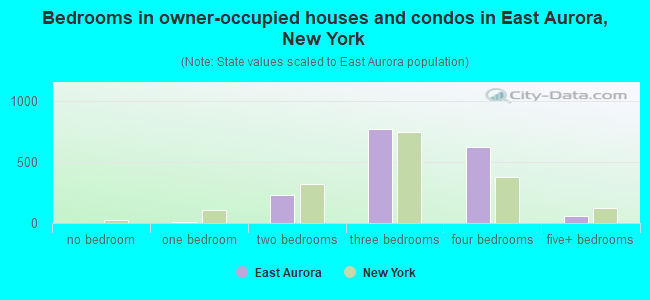
- Bedrooms in owner-occupied houses and condos in East Aurora, New York
- 0no bedroom
- 71 bedroom
- 2312 bedrooms
- 7733 bedrooms
- 6274 bedrooms
- 605+ bedrooms
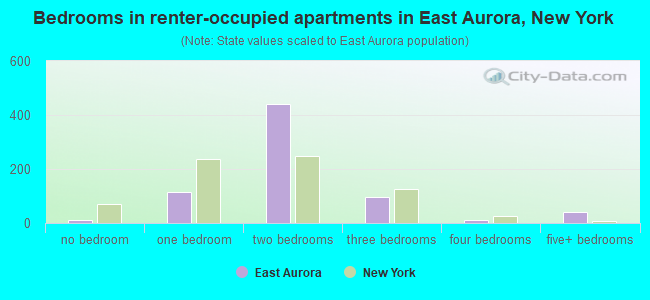
- Bedrooms in renter-occupied apartments in East Aurora, New York
- 10no bedroom
- 1161 bedroom
- 4402 bedrooms
- 983 bedrooms
- 114 bedrooms
- 415+ bedrooms
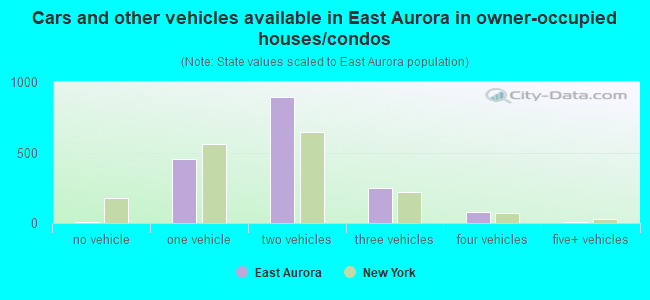
- Cars and other vehicles available in East Aurora in owner-occupied houses/condos
- 10no vehicle
- 4561 vehicle
- 8952 vehicles
- 2483 vehicles
- 804 vehicles
- 95+ vehicles
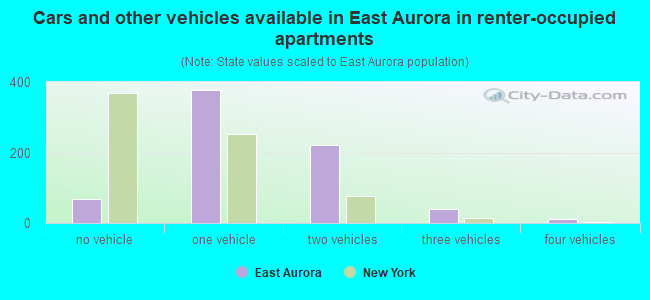
- Cars and other vehicles available in East Aurora in renter-occupied apartments
- 67no vehicle
- 3781 vehicle
- 2212 vehicles
- 403 vehicles
- 114 vehicles
- 05+ vehicles
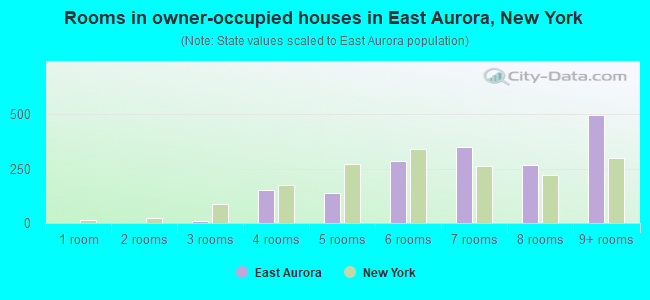
- Rooms in owner-occupied houses in East Aurora, New York
- 01 room
- 02 rooms
- 73 rooms
- 1514 rooms
- 1405 rooms
- 2856 rooms
- 3507 rooms
- 2678 rooms
- 4989+ rooms
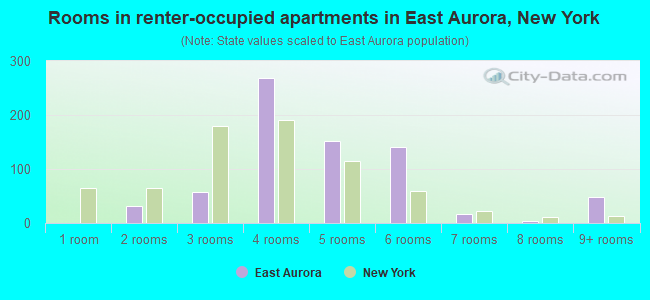
- Rooms in renter-occupied apartments in East Aurora, New York
- 01 room
- 312 rooms
- 583 rooms
- 2684 rooms
- 1515 rooms
- 1416 rooms
- 167 rooms
- 48 rooms
- 499+ rooms
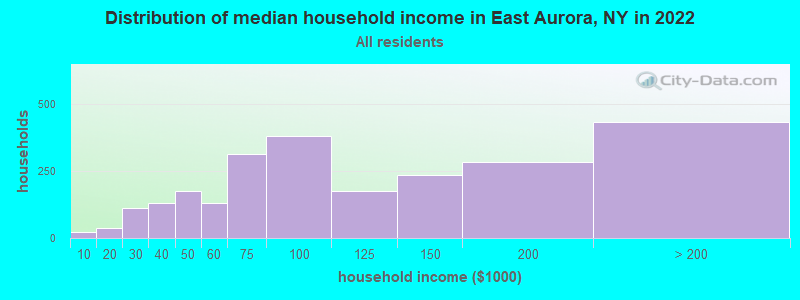
East Aurora, NY household income distribution

- 21Less than $10,000
- 37$10,000 to $19,999
- 113$20,000 to $29,999
- 129$30,000 to $39,999
- 177$40,000 to $49,999
- 132$50,000 to $59,999
- 315$60,000 to $74,999
- 379$75,000 to $99,999
- 176$100,000 to $124,999
- 237$125,000 to $149,999
- 282$150,000 to $199,999
- 433$200,000 or more
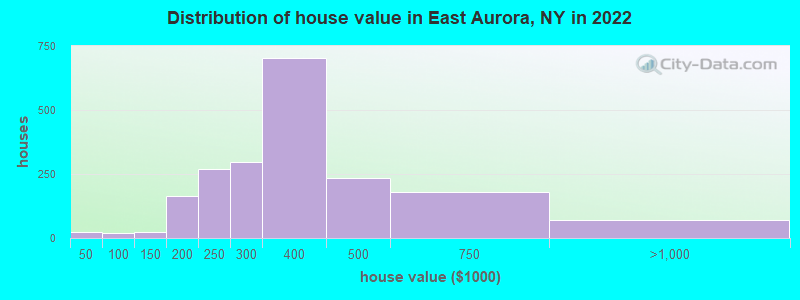
Home value of owner - occupied houses in 2022 in East Aurora, NY
-
- 6Less than $10,000
- 5$10,000 to $14,999
- 12$35,000 to $39,999
- 6$70,000 to $79,999
- 10$80,000 to $89,999
- 16$100,000 to $124,999
- 7$125,000 to $149,999
- 59$150,000 to $174,999
- 103$175,000 to $199,999
- 269$200,000 to $249,999
- 296$250,000 to $299,999
- 703$300,000 to $399,999
- 234$400,000 to $499,999
- 180$500,000 to $749,999
- 71$750,000 to $999,999
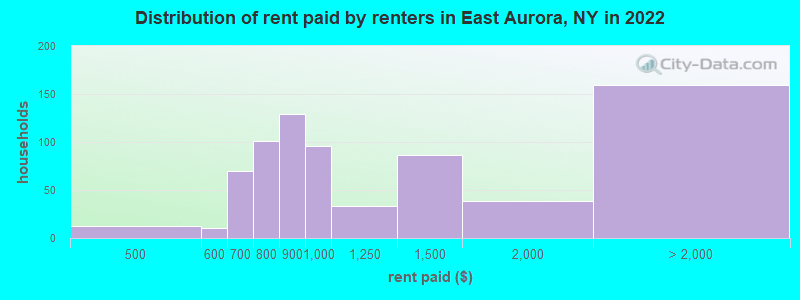
Rent paid by renters in 2022 in East Aurora, NY
-
- 12$450 to $499
- 9$550 to $599
- 57$600 to $649
- 12$650 to $699
- 20$700 to $749
- 80$750 to $799
- 128$800 to $899
- 95$900 to $999
- 32$1,000 to $1,249
- 85$1,250 to $1,499
- 38$1,500 to $1,999
- 86$2,000 to $2,499
- 71No cash rent
Percentage of workers working in this county: 94.9%
Number of people working at home: 717 (25.1% of all workers)
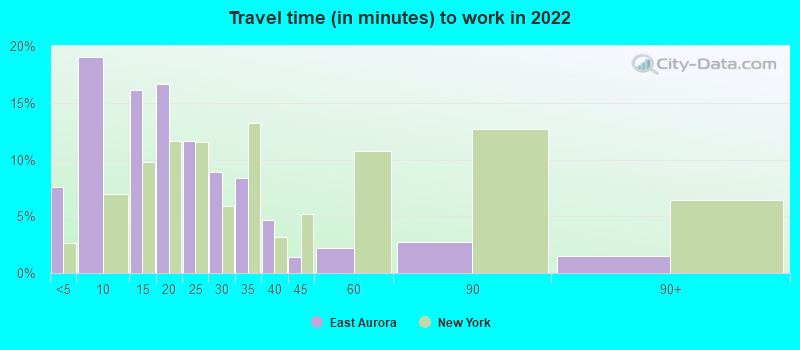
Travel time to work (commute)
- Less than 5 minutes: 194
- 5 to 9 minutes: 353
- 10 to 14 minutes: 278
- 15 to 19 minutes: 139
- 20 to 24 minutes: 209
- 25 to 29 minutes: 215
- 30 to 34 minutes: 472
- 35 to 39 minutes: 85
- 40 to 44 minutes: 46
- 45 to 59 minutes: 121
- 60 to 89 minutes: 76
- 90 or more minutes: 70
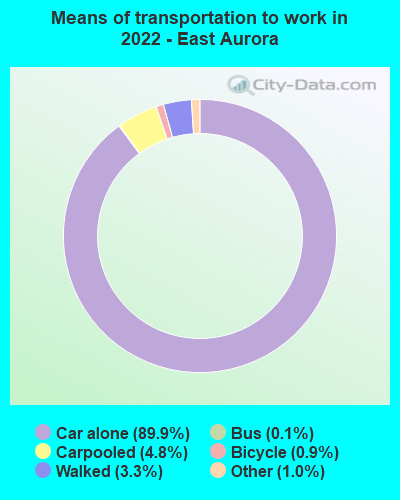
Means of transportation to work:
- Drove a car alone: 3,630 (75.3%)
- Carpooled: 231 (4.8%)
- Bus: 5 (0.1%)
- Taxi: 57 (1.2%)
- Bicycle: 25 (0.5%)
- Walked: 142 (2.9%)
- Worked at home: 717 (14.9%)
- Unemployment by race in 2022
- Unemployment rate for White non-Hispanic residents
- 2.3%Males
- 3.0%Females
- Unemployment rate for Asian residents
- 100.0%Females
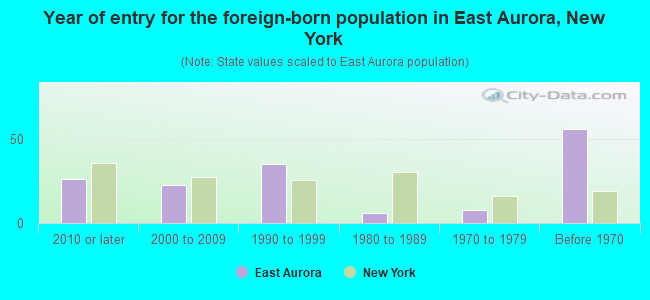
- Year of entry for the foreign-born population in East Aurora, New York
- 262010 or later
- 232000 to 2009
- 351990 to 1999
- 61980 to 1989
- 81970 to 1979
- 56Before 1970
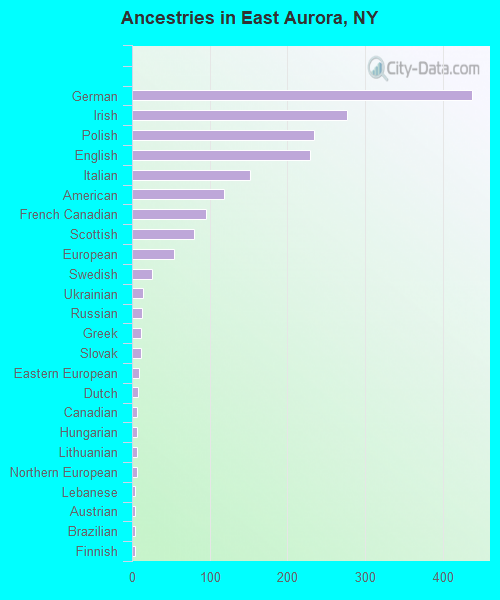
First ancestries reported:
- German: 438 (20.2%)
- Irish: 277 (12.8%)
- Polish: 235 (10.8%)
- English: 229 (10.5%)
- Italian: 152 (7.0%)
- American: 118 (5.4%)
- French Canadian: 95 (4.4%)
- Scottish: 80 (3.7%)
- European: 54 (2.5%)
- Swedish: 26 (1.2%)
- Ukrainian: 14 (0.6%)
- Russian: 13 (0.6%)
- Greek: 11 (0.5%)
- Slovak: 11 (0.5%)
- Eastern European: 9 (0.4%)
- Dutch: 8 (0.4%)
- Canadian: 7 (0.3%)
- Hungarian: 7 (0.3%)
- Lithuanian: 7 (0.3%)
- Northern European: 7 (0.3%)
- Lebanese: 4 (0.2%)
- Austrian: 4 (0.2%)
- Brazilian: 4 (0.2%)
- Finnish: 4 (0.2%)
Most common places of birth for foreign-born residents (%):
| East Aurora: | 14.2% (18) |
| New York: | 1.4% (61,245) |
| East Aurora: | 12.6% (16) |
| New York: | 9.1% (410,910) |
| East Aurora: | 11.8% (15) |
| New York: | 1.3% (59,107) |
| East Aurora: | 11.0% (14) |
| New York: | 1.7% (75,802) |
| East Aurora: | 10.2% (13) |
| New York: | 0.0% (2,170) |
| East Aurora: | 9.4% (12) |
| New York: | 0.0% (1,860) |
| East Aurora: | 7.1% (9) |
| New York: | 1.8% (82,786) |
| East Aurora: | 6.3% (8) |
| New York: | 0.5% (23,058) |
| East Aurora: | 5.5% (7) |
| New York: | 0.1% (3,808) |
| East Aurora: | 5.5% (7) |
| New York: | 0.2% (8,808) |
| East Aurora: | 4.7% (6) |
| New York: | 0.9% (38,713) |
| East Aurora: | 3.9% (5) |
| New York: | 0.8% (33,869) |
| East Aurora: | 2.4% (3) |
| New York: | 2.0% (91,070) |
Place of birth for U.S.-born residents:
- This state: 4,868
- Other state: 944
- Northeast: 322
- Midwest: 187
- South: 186
- West: 253
92.8% of East Aurora residents lived in the same house 1 years ago.
Out of people who lived in different houses, 42.2% lived in this county.
Out of people who lived in different counties, 20.3% lived in New York.
| East Aurora: | 92.8% |
| State average: | 89.6% |
Education attainment for males 25 years and older:
- No schooling: 7
- Nursery to 4th grade: 7
- 5th and 6th grade: 5
- 7th and 8th grade: 5
- 9th grade: 27
- 10th grade: 6
- 11th grade: 4
- 12th grade, no diploma: 9
- High school graduate (or equivalency): 563
- Less than 1 year of college: 55
- Some college more than 1 year, no degree: 139
- Associate degree: 208
- Bachelor's degree: 639
- Master's degree: 512
- Professional school degree: 63
- Doctorate degree: 63

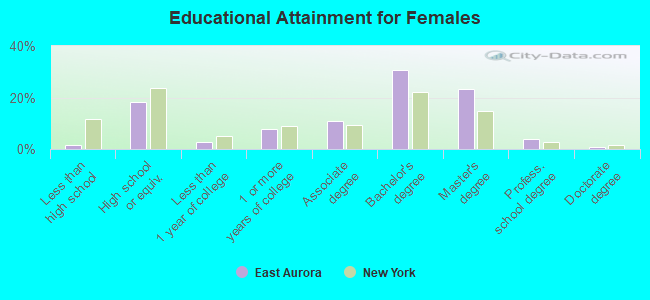
Education attainment for females 25 years and older:
- No schooling: 13
- Nursery to 4th grade: 0
- 5th and 6th grade: 4
- 7th and 8th grade: 0
- 9th grade: 7
- 10th grade: 3
- 11th grade: 4
- 12th grade, no diploma: 3
- High school graduate (or equivalency): 418
- Less than 1 year of college: 62
- Some college more than 1 year, no degree: 180
- Associate degree: 247
- Bachelor's degree: 693
- Master's degree: 530
- Professional school degree: 86
- Doctorate degree: 18


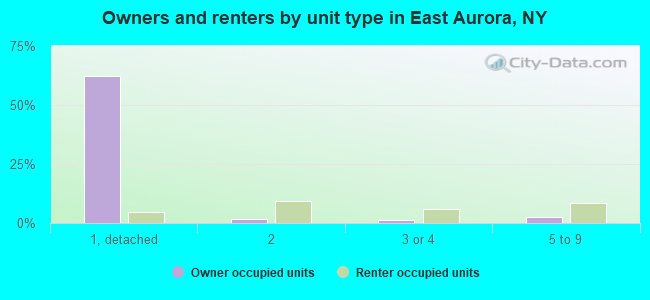
Housing units in structures:
- One, detached: 1,681
- One, attached: 72
- Two: 337
- 3 or 4: 206
- 5 to 9: 319
- 10 to 19: 10
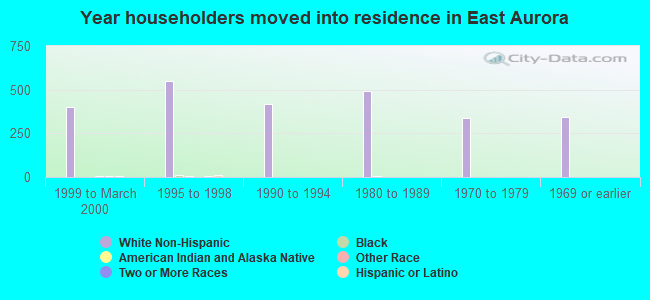
House/condo owner moved in on average 13 years ago
Renter moved in on average 6 years ago
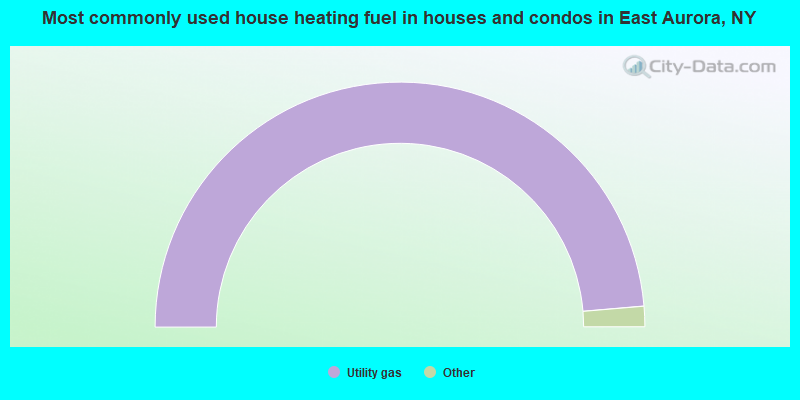
- 97.3%Utility gas
- 1.1%Electricity
- 0.7%Fuel oil, kerosene, etc.
- 0.3%Bottled, tank, or LP gas
- 0.3%Wood
- 0.2%Other fuel
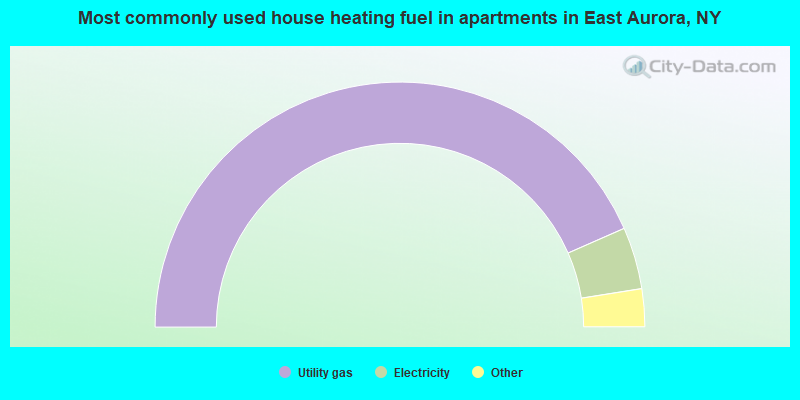
- 87.0%Utility gas
- 8.2%Electricity
- 3.4%No fuel used
- 1.4%Bottled, tank, or LP gas
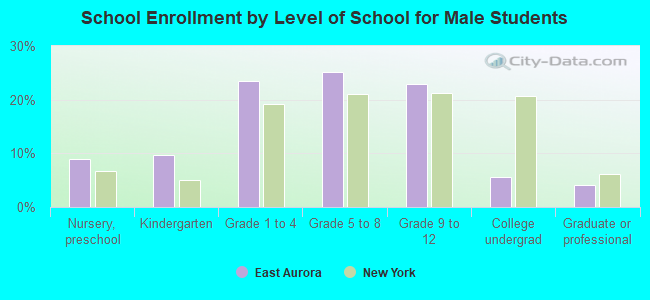
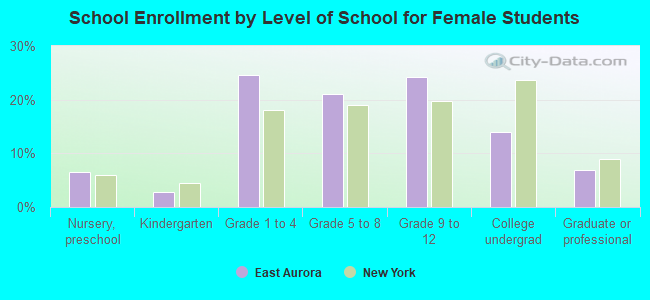
Private vs. public school enrollment:
| Here: | 10.3% |
| New York: | 15.6% |
| Here: | 7.8% |
| New York: | 15.0% |
| Here: | 41.6% |
| New York: | 39.2% |