Dunnville, KY (Kentucky) Houses and Residents
| Dunnville: | $104,817 |
| Kentucky: | $196,300 |
Total population: 2,626 (Urban population: 0, Rural population: 2,495 (570 farm, 1,925 nonfarm))
Houses: 1,105 (960 occupied: 779 owner occupied, 181 renter occupied)
| % of renters here: | 19% |
| State: | 31% |
Housing density: 14 houses/condos per square mile
Median price asked for vacant for-sale houses and condos in 2022 in this county: $142,134.
Median contract rent in 2022: $426 (lower quartile is $413, upper quartile is $474)
Median rent asked for vacant for-rent units in 2022: $343
Median gross rent in Dunnville, KY in 2022: $643
Housing units in Dunnville with a mortgage: 141 (6 second mortgage, 7 home equity loan, 0 both second mortgage and home equity loan)
Houses without a mortgage: 129


Household type by relationship:
Households: 15,475- In family households: 13,108 (3,078 male householders, 1,197 female householders)
3,232 spouses, 4,376 children (4,009 natural, 92 adopted, 275 stepchildren), 419 grandchildren, 97 brothers or sisters, 121 parents, foster children, 144 other relatives, 366 non-relatives
- In nonfamily households: 2,367 (1,003 male householders (848 living alone)), 1,073 female householders (990 living alone)), 291 nonrelatives
- In group quarters: 480 (440 institutionalized population)
2,688 married couples with children.
718 single-parent households (171 men, 547 women).
84.6% of residents of Dunnville speak English at home.
4.2% of residents speak Spanish at home (3% speak English very well, 36% speak English well, 20% speak English not well, 41% don't speak English at all).
11.2% of residents speak other Indo-European language at home (43% speak English very well, 44% speak English well, 13% speak English not well).
Foreign born population: 146 (5.6%)
(0.0% of them are naturalized citizens)
| Here: | 6.4 |
| State: | 6.4 |
| Here: | 6.2 |
| State: | 4.4 |

- Bedrooms in owner-occupied houses and condos in Dunnville, Kentucky
- 0no bedroom
- 501 bedroom
- 2852 bedrooms
- 3563 bedrooms
- 614 bedrooms
- 275+ bedrooms

- Bedrooms in renter-occupied apartments in Dunnville, Kentucky
- 0no bedroom
- 391 bedroom
- 392 bedrooms
- 743 bedrooms
- 174 bedrooms
- 125+ bedrooms

- Cars and other vehicles available in Dunnville in owner-occupied houses/condos
- 132no vehicle
- 1691 vehicle
- 3762 vehicles
- 773 vehicles
- 144 vehicles
- 115+ vehicles

- Cars and other vehicles available in Dunnville in renter-occupied apartments
- 22no vehicle
- 1071 vehicle
- 372 vehicles
- 113 vehicles
- 04 vehicles
- 45+ vehicles

- Rooms in owner-occupied houses in Dunnville, Kentucky
- 01 room
- 262 rooms
- 513 rooms
- 2004 rooms
- 1925 rooms
- 1376 rooms
- 1027 rooms
- 398 rooms
- 329+ rooms

- Rooms in renter-occupied apartments in Dunnville, Kentucky
- 01 room
- 72 rooms
- 163 rooms
- 304 rooms
- 685 rooms
- 366 rooms
- 177 rooms
- 78 rooms
- 09+ rooms


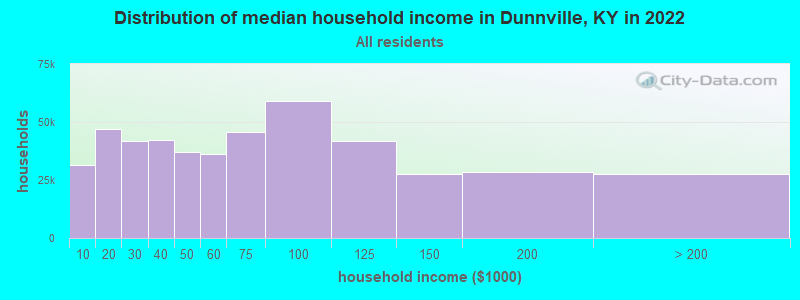
Dunnville, KY household income distribution

- 27,395Less than $10,000
- 44,446$10,000 to $19,999
- 37,452$20,000 to $29,999
- 39,680$30,000 to $39,999
- 30,322$40,000 to $49,999
- 33,313$50,000 to $59,999
- 38,217$60,000 to $74,999
- 52,965$75,000 to $99,999
- 37,849$100,000 to $124,999
- 23,223$125,000 to $149,999
- 23,017$150,000 to $199,999
- 19,786$200,000 or more
Percentage of workers working in this county: 50.3%
Number of people working at home: 77 (8.5% of all workers)
Travel time to work (commute)
- Less than 5 minutes: 47
- 5 to 9 minutes: 95
- 10 to 14 minutes: 71
- 15 to 19 minutes: 67
- 20 to 24 minutes: 110
- 25 to 29 minutes: 72
- 30 to 34 minutes: 128
- 35 to 39 minutes: 61
- 40 to 44 minutes: 18
- 45 to 59 minutes: 84
- 60 to 89 minutes: 12
- 90 or more minutes: 27
Means of transportation to work:
- Drove a car alone: 590 (67.9%)
- Carpooled: 145 (16.7%)
- Bicycle: 17 (2.0%)
- Walked: 23 (2.6%)
- Other means: 17 (2.0%)
- Worked at home: 77 (8.9%)


- Year of entry for the foreign-born population in Dunnville, Kentucky
- 831995 to March 2000
- 01990 to 1994
- 01985 to 1989
- 01980 to 1984
- 01975 to 1979
- 01970 to 1974
- 01965 to 1969
- 0Before 1965
Most common places of birth for foreign-born residents (%):
| Dunnville: | 100.0% (83) |
| Kentucky: | 19.3% (15,511) |
Place of birth for U.S.-born residents:
- This state: 1,932
- Other state: 469
- Northeast: 149
- Midwest: 236
- South: 77
- West: 7
65% of Dunnville residents lived in the same house 5 years ago.
Out of people who lived in different houses, 72% lived in this county.
Out of people who lived in different counties, 78% lived in Kentucky.
Education attainment for males 25 years and older:
- No schooling: 55
- Nursery to 4th grade: 15
- 5th and 6th grade: 40
- 7th and 8th grade: 179
- 9th grade: 58
- 10th grade: 69
- 11th grade: 27
- 12th grade, no diploma: 42
- High school graduate (or equivalency): 225
- Less than 1 year of college: 0
- Some college more than 1 year, no degree: 4
- Associate degree: 19
- Bachelor's degree: 30
- Master's degree: 6
- Professional school degree: 0
- Doctorate degree: 0

Education attainment for females 25 years and older:
- No schooling: 10
- Nursery to 4th grade: 18
- 5th and 6th grade: 40
- 7th and 8th grade: 171
- 9th grade: 57
- 10th grade: 34
- 11th grade: 60
- 12th grade, no diploma: 12
- High school graduate (or equivalency): 239
- Less than 1 year of college: 21
- Some college more than 1 year, no degree: 66
- Associate degree: 19
- Bachelor's degree: 43
- Master's degree: 42
- Professional school degree: 0
- Doctorate degree: 0


Housing units in structures:
- One, detached: 698
- One, attached: 25
- 20 to 49: 5
- Mobile homes: 374
- Boats, RVs, vans, etc.: 3
Median worth of mobile homes: $30,539
Housing units lacking complete kitchen facilities: 9.9%

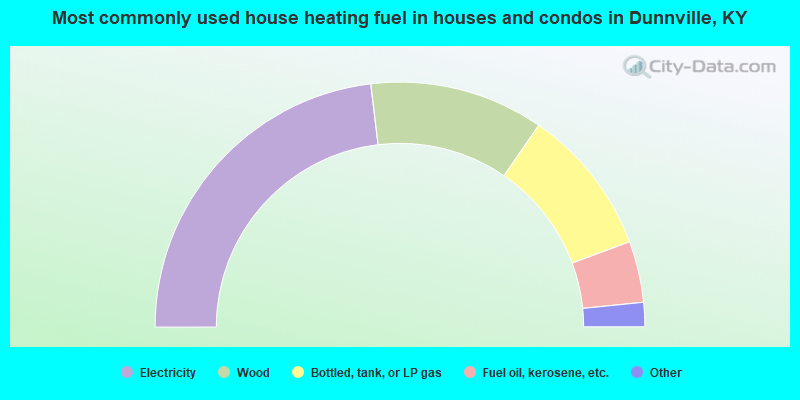
- 46.2%Electricity
- 23.0%Wood
- 19.5%Bottled, tank, or LP gas
- 8.1%Fuel oil, kerosene, etc.
- 1.9%No fuel used
- 1.3%Utility gas
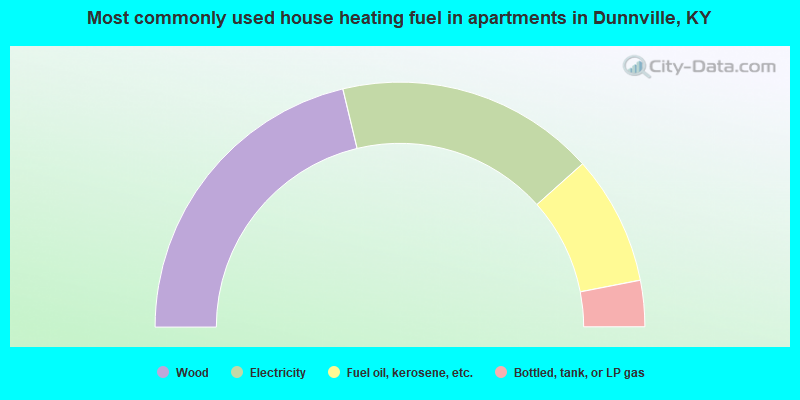
- 42.5%Wood
- 34.3%Electricity
- 17.1%Fuel oil, kerosene, etc.
- 6.1%Bottled, tank, or LP gas
Private vs. public school enrollment:
| Here: | 34.7% |
| Kentucky: | 11.9% |
| Here: | 19.4% |
| Kentucky: | 10.6% |
| Here: | 0.0% |
| Kentucky: | 18.1% |


