Dover, DE (Delaware) Houses and Residents
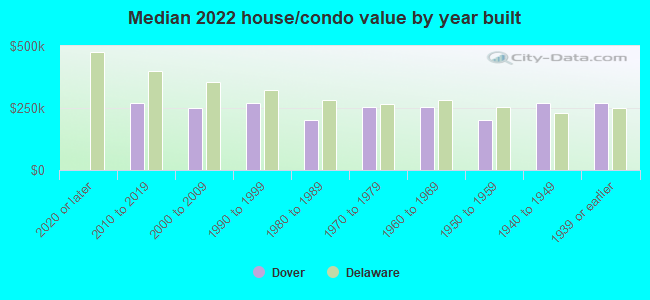
| Dover: | $252,092 |
| Delaware: | $337,200 |
Total population: 37,355 (Urban population: 31,935, Rural population: 535 (25 farm, 510 nonfarm))
Houses: 17,078 (15,790 occupied: 7,812 owner occupied, 8,355 renter occupied)
| % of renters here: | 52% |
| State: | 26% |
Housing density: 763 houses/condos per square mile
Median price asked for vacant for-sale houses and condos in 2022: $148,594.
Median contract rent in 2022: $1,046 (lower quartile is $664, upper quartile is $1,266)
Median rent asked for vacant for-rent units in 2022: $1,410
Median gross rent in Dover, DE in 2022: $1,143
Housing units in Dover with a mortgage: 5,392 (590 second mortgage, 0 home equity loan, 453 both second mortgage and home equity loan)
Houses without a mortgage: 83
Median household income for houses/condos with a mortgage: $93,880
Median household income for apartments without a mortgage: $72,106
Median monthly housing costs: $1,193
Compare current foreclosures in Dover, DE:
| Photo | Address | Area | Beds / Baths | Price | Details |
|---|---|---|---|---|---|

|
#1
Bluecoat St
Dover, DE 19901
|
1,932 sq. feet
|
2 baths 4 beds |
show details | |

|
#2
John Clark Rd
Dover, DE 19904
|
1,080 sq. feet
|
1 baths 3 beds |
show details | |

|
#3
Main St
Dover, DE 19901
|
- sq. feet
|
1 baths 2 beds |
show details | |

|
#4
Eisenhower Dr
Dover, DE 19901
|
1,370 sq. feet
|
1 baths 3 beds |
show details | |

|
#5
Carnoustie Rd
Dover, DE 19904
|
1,664 sq. feet
|
2 baths 4 beds |
show details | |

|
#6
Poplar Ln
Dover, DE 19901
|
1,508 sq. feet
|
2 baths 4 beds |
show details | |

|
#7
Carlisle Dr
Dover, DE 19904
|
1,852 sq. feet
|
2 baths 3 beds |
show details | |

|
#8
Bradley Rd
Dover, DE 19901
|
1,472 sq. feet
|
1 baths 4 beds |
show details | |

|
#9
Upland Ave
Dover, DE 19901
|
792 sq. feet
|
1 baths 3 beds |
show details | |

|
#10
Shadybrook Dr
Dover, DE 19901
|
1,587 sq. feet
|
2 baths 3 beds |
show details |
| Photo | Address | Area | Beds / Baths | Price | Details |
|---|---|---|---|---|---|

|
#11
Cannon Mill Dr
Dover, DE 19904
|
1,619 sq. feet
|
2 baths 4 beds |
show details | |

|
#12
Sheffield Dr
Dover, DE 19901
|
1,572 sq. feet
|
2 baths 3 beds |
show details | |

|
#13
Garfield Dr
Dover, DE 19901
|
1,810 sq. feet
|
1 baths 4 beds |
show details | |

|
#14
N West St
Dover, DE 19904
|
1,543 sq. feet
|
2 baths 2 beds |
show details | |

|
#15
Nimitz Rd
Dover, DE 19901
|
1,777 sq. feet
|
1 baths 4 beds |
show details | |

|
#16
Woodrow Ct
Dover, DE 19904
|
1,801 sq. feet
|
2 baths 3 beds |
show details | |

|
#17
Ann Ave
Dover, DE 19904
|
1,512 sq. feet
|
2 baths 3 beds |
show details | |

|
#18
Lamplighter Ln
Dover, DE 19904
|
1,188 sq. feet
|
1 baths 3 beds |
show details | |

|
#19
Greenwich Dr
Dover, DE 19901
|
1,578 sq. feet
|
2 baths 3 beds |
show details | |

|
#20
Stoney Dr
Dover, DE 19904
|
1,248 sq. feet
|
1 baths 3 beds |
show details |
| Photo | Address | Area | Beds / Baths | Price | Details |
|---|---|---|---|---|---|

|
#21
Mahogany Pl
Dover, DE 19901
|
1,587 sq. feet
|
2 baths 3 beds |
show details | |

|
#22
Alonzo Dr
Dover, DE 19904
|
1,548 sq. feet
|
1 baths 3 beds |
show details | |

|
#23
Kenton Rd
Dover, DE 19904
|
928 sq. feet
|
1 baths 2 beds |
show details | |

|
#24
Forrest Ave
Dover, DE 19904
|
1,176 sq. feet
|
1 baths 3 beds |
show details | |

|
#25
N West St
Dover, DE 19904
|
1,148 sq. feet
|
1 baths 3 beds |
show details | |

|
#26
Acorn Ln
Dover, DE 19901
|
1,170 sq. feet
|
2 baths 3 beds |
show details | |

|
#27
Midessa Ct
Dover, DE 19904
|
2,404 sq. feet
|
2 baths 3 beds |
show details | |

|
#28
Joshua Clayton Rd
Dover, DE 19904
|
1,232 sq. feet
|
1 baths 4 beds |
show details | |

|
#29
Kitts Hummock Rd
Dover, DE 19901
|
1,200 sq. feet
|
1 baths 2 beds |
show details | |

|
#30
Heritage Dr
Dover, DE 19904
|
1,980 sq. feet
|
2 baths 3 beds |
show details |
| Photo | Address | Area | Beds / Baths | Price | Details |
|---|---|---|---|---|---|

|
#31
Tucket Cir
Dover, DE 19904
|
2,100 sq. feet
|
2 baths 4 beds |
show details | |

|
#32
Cypress St
Dover, DE 19901
|
- sq. feet
|
- baths - beds |
show details | |

|
#33
The Grn # R
Dover, DE 19901
|
- sq. feet
|
- baths - beds |
show details | |

|
#34
Northdown Dr
Dover, DE 19904
|
- sq. feet
|
- baths - beds |
show details | |

|
#35
Weeping Willow Ct
Dover, DE 19901
|
- sq. feet
|
- baths - beds |
show details | |

|
#36
Forest Creek Dr
Dover, DE 19904
|
- sq. feet
|
- baths - beds |
show details | |

|
#37
N Wilson Ave
Dover, DE 19901
|
- sq. feet
|
- baths - beds |
show details | |

|
#38
Massachusetts Dr
Dover, DE 19901
|
- sq. feet
|
- baths - beds |
show details | |

|
#39
E Division St
Dover, DE 19901
|
- sq. feet
|
- baths - beds |
show details | |

|
#40
N Dupont Hwy
Dover, DE 19901
|
- sq. feet
|
- baths - beds |
show details |
| Photo | Address | Area | Beds / Baths | Price | Details |
|---|---|---|---|---|---|

|
#41
The Grn # 7771
Dover, DE 19901
|
- sq. feet
|
- baths - beds |
show details | |

|
#42
Boggs Run
Dover, DE 19904
|
- sq. feet
|
- baths - beds |
show details | |

|
#43
Old Flint Cir
Dover, DE 19904
|
- sq. feet
|
- baths - beds |
show details | |

|
#44
Rollin Ct
Dover, DE 19901
|
- sq. feet
|
- baths - beds |
show details | |

|
#45
Ediman Ct
Dover, DE 19901
|
- sq. feet
|
- baths - beds |
show details | |

|
#46
Coffee Cir
Dover, DE 19901
|
- sq. feet
|
- baths - beds |
show details | |

|
#47
Boggs Run
Dover, DE 19904
|
- sq. feet
|
- baths - beds |
show details | |

|
#48
Walker Rd Ste C
Dover, DE 19904
|
- sq. feet
|
- baths - beds |
show details | |

|
#49
Kimberton Ct Unit A2
Dover, DE 19901
|
- sq. feet
|
- baths - beds |
show details | |

|
Check over 1 million property listings on Foreclosure.com!
|
browse all offers | |||

Latest news about housing in Dover, DE collected exclusively by city-data.com from local newspapers, TV, and radio stations

 | If I work in Dover, where is the nicest newest apartments or townhome to live in? (2 replies) |
| Houses for rent in Dover? (3 replies) |
| Homes for sale in old dover? (6 replies) |
| Ashburn Homes Builder Experience (4 replies) |
| Apartment complex between Dover and Milton. (2 replies) |
| Nursing home in Dover (0 replies) |
Median year apartment built: 1993
Household type by relationship:
Households: 39,847- Male householders: 6,743 (2,551 living alone), Female householders: 8,746 (3,253 living alone)
5,095 spouses (4,946 opposite-sex spouses), 1,231 unmarried partners, (1,212 opposite-sex unmarried partners), 9,028 children (8,460 natural, 155 adopted, 412 stepchildren), 1,141 grandchildren, 443 brothers or sisters, 622 parents, 6 foster children, 672 other relatives, 2,079 non-relatives
- In group quarters: 4,035
Size of family households: 3,999 2-persons, 1,759 3-persons, 1,607 4-persons, 1,029 5-persons, 305 6-persons, 299 7-or-more-persons.
Size of nonfamily households: 6,039 1-person, 861 2-persons, 68 3-persons, 18 4-persons, 27 5-persons.
2,390 married couples with children.
4,121 single-parent households (693 men, 3,428 women).
88.5% of residents of Dover speak English at home.
5.2% of residents speak Spanish at home (63% speak English very well, 16% speak English well, 8% speak English not well, 13% don't speak English at all).
3.3% of residents speak other Indo-European language at home (61% speak English very well, 23% speak English well, 16% speak English not well).
2.0% of residents speak Asian or Pacific Island language at home (45% speak English very well, 25% speak English well, 7% speak English not well, 23% don't speak English at all).
1.2% of residents speak other language at home (82% speak English very well, 18% speak English well).
Foreign born population: 4,105 (10.3%)
(52.0% of them are naturalized citizens)
| Here: | 7.1 |
| State: | 6.9 |
| Here: | 4.4 |
| State: | 4.4 |
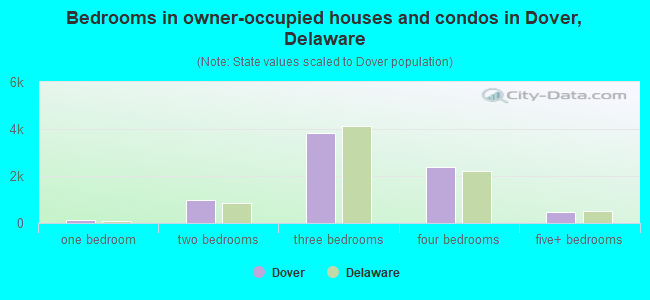
- Bedrooms in owner-occupied houses and condos in Dover, Delaware
- 0no bedroom
- 1241 bedroom
- 9922 bedrooms
- 3,8503 bedrooms
- 2,3644 bedrooms
- 4825+ bedrooms
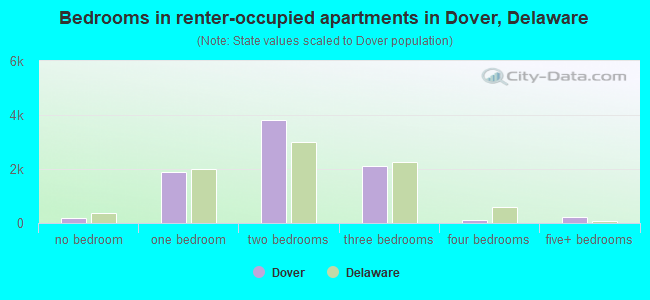
- Bedrooms in renter-occupied apartments in Dover, Delaware
- 175no bedroom
- 1,8821 bedroom
- 3,8312 bedrooms
- 2,1213 bedrooms
- 1144 bedrooms
- 2325+ bedrooms
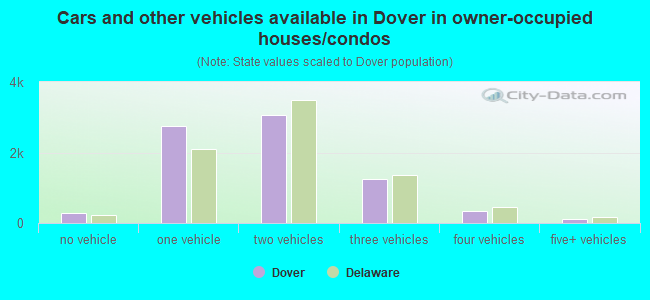
- Cars and other vehicles available in Dover in owner-occupied houses/condos
- 295no vehicle
- 2,7501 vehicle
- 3,0632 vehicles
- 1,2523 vehicles
- 3384 vehicles
- 1145+ vehicles
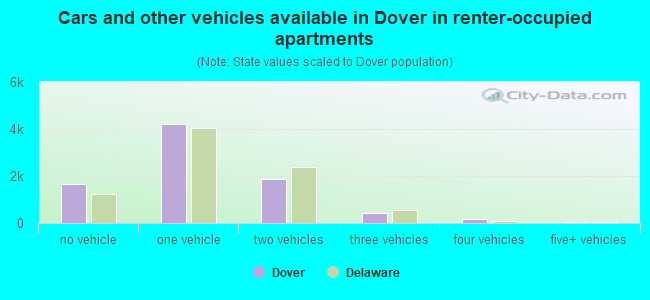
- Cars and other vehicles available in Dover in renter-occupied apartments
- 1,656no vehicle
- 4,2021 vehicle
- 1,8742 vehicles
- 4173 vehicles
- 1814 vehicles
- 265+ vehicles
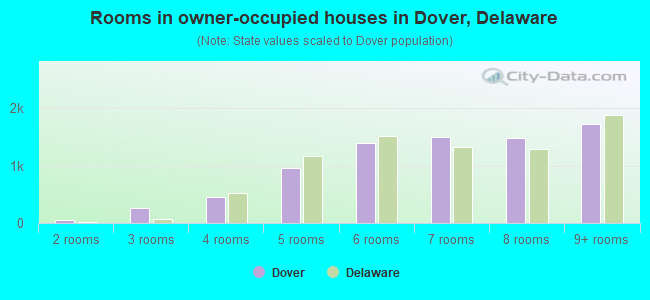
- Rooms in owner-occupied houses in Dover, Delaware
- 01 room
- 612 rooms
- 2613 rooms
- 4554 rooms
- 9535 rooms
- 1,3876 rooms
- 1,4927 rooms
- 1,4848 rooms
- 1,7199+ rooms
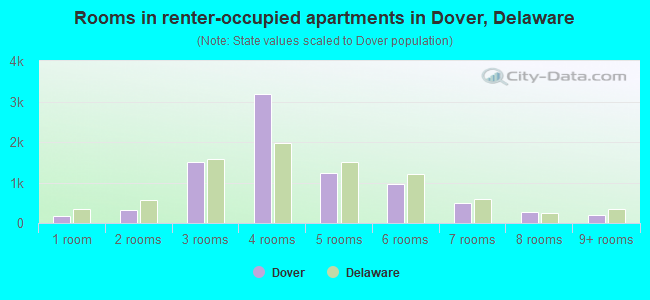
- Rooms in renter-occupied apartments in Dover, Delaware
- 1751 room
- 3192 rooms
- 1,5163 rooms
- 3,1884 rooms
- 1,2345 rooms
- 9526 rooms
- 4917 rooms
- 2728 rooms
- 2099+ rooms
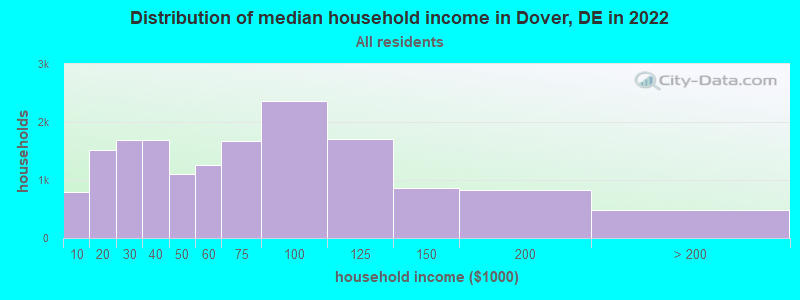
Dover, DE household income distribution

- 801Less than $10,000
- 1,521$10,000 to $19,999
- 1,696$20,000 to $29,999
- 1,686$30,000 to $39,999
- 1,111$40,000 to $49,999
- 1,259$50,000 to $59,999
- 1,670$60,000 to $74,999
- 2,365$75,000 to $99,999
- 1,702$100,000 to $124,999
- 869$125,000 to $149,999
- 827$150,000 to $199,999
- 482$200,000 or more
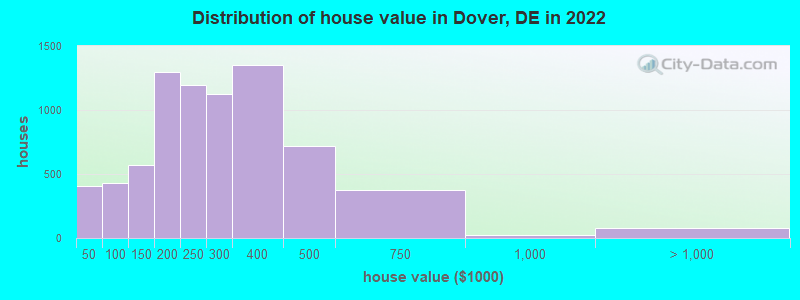
Home value of owner - occupied houses in 2022 in Dover, DE
-
- 260Less than $10,000
- 22$10,000 to $14,999
- 19$15,000 to $19,999
- 43$20,000 to $24,999
- 38$35,000 to $39,999
- 20$40,000 to $49,999
- 42$50,000 to $59,999
- 112$60,000 to $69,999
- 103$70,000 to $79,999
- 135$80,000 to $89,999
- 10$90,000 to $99,999
- 311$100,000 to $124,999
- 257$125,000 to $149,999
- 298$150,000 to $174,999
- 1,000$175,000 to $199,999
- 1,195$200,000 to $249,999
- 1,127$250,000 to $299,999
- 1,348$300,000 to $399,999
- 719$400,000 to $499,999
- 375$500,000 to $749,999
- 21$750,000 to $999,999
- 53$1,000,000 to $1,499,999
- 5$1,500,000 to $1,999,999
- 19$2,000,000 or more
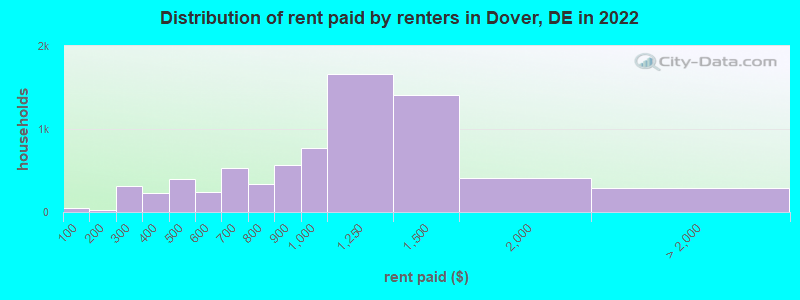
Rent paid by renters in 2022 in Dover, DE
-
- 53Less than $100
- 26$100 to $149
- 143$200 to $249
- 173$250 to $299
- 93$300 to $349
- 135$350 to $399
- 182$400 to $449
- 213$450 to $499
- 67$500 to $549
- 175$550 to $599
- 46$600 to $649
- 482$650 to $699
- 83$700 to $749
- 256$750 to $799
- 562$800 to $899
- 772$900 to $999
- 1,664$1,000 to $1,249
- 1,411$1,250 to $1,499
- 407$1,500 to $1,999
- 58$2,000 to $2,499
- 11$2,500 to $2,999
- 214No cash rent
Percentage of workers working in this county: 81.1%
Number of people working at home: 897 (4.9% of all workers)
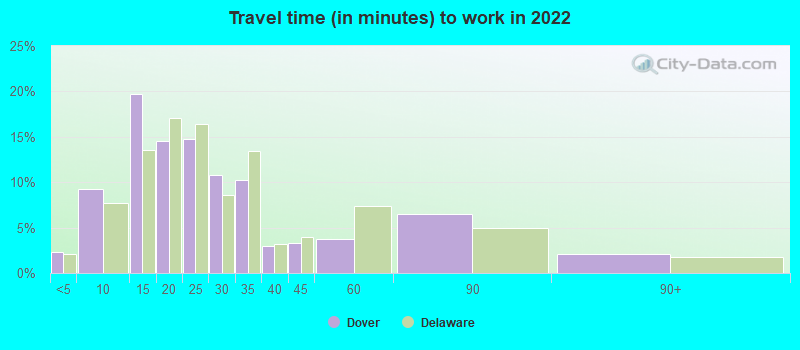
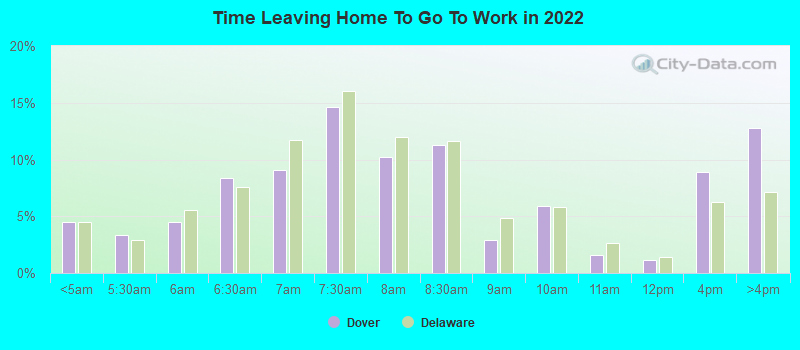
Travel time to work (commute)
- Less than 5 minutes: 569
- 5 to 9 minutes: 2,400
- 10 to 14 minutes: 4,124
- 15 to 19 minutes: 2,175
- 20 to 24 minutes: 1,816
- 25 to 29 minutes: 680
- 30 to 34 minutes: 1,626
- 35 to 39 minutes: 289
- 40 to 44 minutes: 355
- 45 to 59 minutes: 1,146
- 60 to 89 minutes: 1,351
- 90 or more minutes: 393
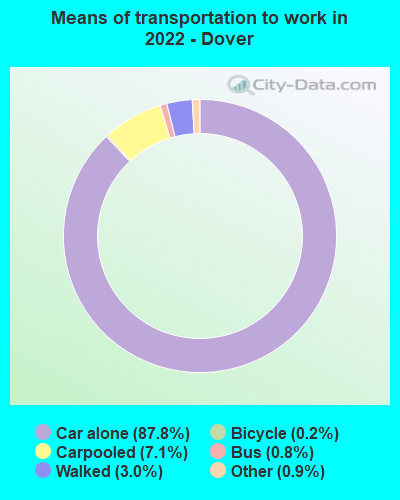
Means of transportation to work:
- Drove a car alone: 30,830 (84.4%)
- Carpooled: 2,659 (7.3%)
- Bus: 408 (1.1%)
- Subway or elevated rail: 1 (0.0%)
- Long-distance train or commuter rail: 6 (0.0%)
- Light rail, streetcar or trolley: 12 (0.0%)
- Taxi: 394 (1.1%)
- Bicycle: 90 (0.2%)
- Walked: 908 (2.5%)
- Worked at home: 897 (2.5%)
- Unemployment by race in 2022
- Unemployment rate for White non-Hispanic residents
- 9.0%Males
- 4.9%Females
- Unemployment rate for Black residents
- 12.7%Males
- 10.0%Females
- Unemployment rate for other race residents
- 11.0%Females
- Unemployment rate for two or more race residents
- 0.7%Females
- Unemployment rate for Hispanic or Latino residents
- 3.0%Males
- 7.4%Females
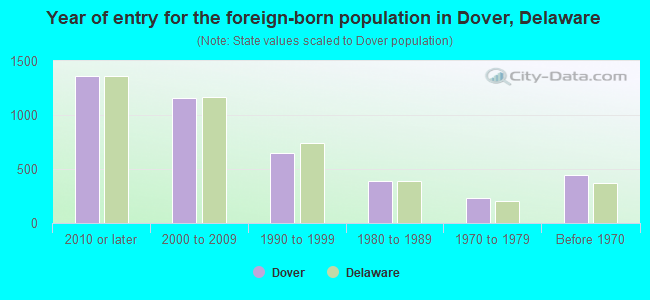
- Year of entry for the foreign-born population in Dover, Delaware
- 1,3632010 or later
- 1,1532000 to 2009
- 6461990 to 1999
- 3901980 to 1989
- 2361970 to 1979
- 447Before 1970
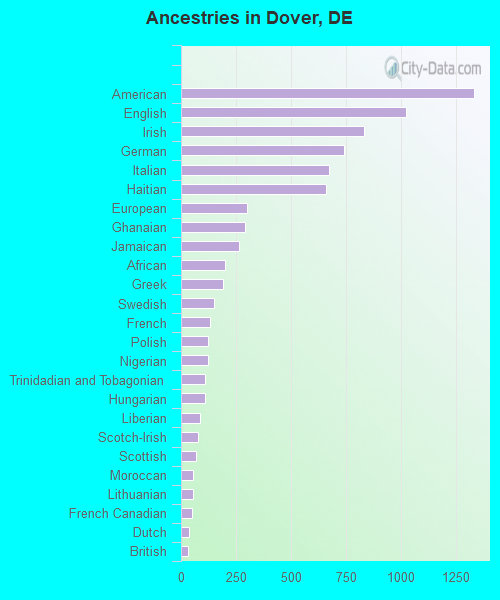
First ancestries reported:
- American: 1,334 (6.0%)
- English: 1,021 (4.6%)
- Irish: 830 (3.8%)
- German: 740 (3.4%)
- Italian: 674 (3.1%)
- Haitian: 661 (3.0%)
- European: 302 (1.4%)
- Ghanaian: 289 (1.3%)
- Jamaican: 264 (1.2%)
- African: 199 (0.9%)
- Greek: 193 (0.9%)
- Swedish: 150 (0.7%)
- French: 132 (0.6%)
- Polish: 125 (0.6%)
- Nigerian: 122 (0.6%)
- Trinidadian and Tobagonian: 110 (0.5%)
- Hungarian: 110 (0.5%)
- Liberian: 87 (0.4%)
- Scotch-Irish: 78 (0.4%)
- Scottish: 68 (0.3%)
- Moroccan: 56 (0.3%)
- Lithuanian: 56 (0.3%)
- French Canadian: 50 (0.2%)
- Dutch: 35 (0.2%)
- British: 33 (0.1%)
- Guyanese: 32 (0.1%)
- Yugoslavian: 29 (0.1%)
- Eastern European: 27 (0.1%)
- West Indian: 26 (0.1%)
- Canadian: 25 (0.1%)
- Austrian: 24 (0.1%)
- Czech: 23 (0.1%)
- Macedonian: 21 (0.10%)
- Norwegian: 19 (0.09%)
- Russian: 19 (0.09%)
- Barbadian: 18 (0.08%)
- Welsh: 17 (0.08%)
- Slovak: 15 (0.07%)
- Ukrainian: 14 (0.06%)
- Brazilian: 8 (0.04%)
- Northern European: 5 (0.02%)
- Israeli: 4 (0.02%)
Most common places of birth for foreign-born residents (%):
| Dover: | 15.3% (589) |
| Delaware: | 3.8% (3,686) |
| Dover: | 9.3% (356) |
| Delaware: | 3.2% (3,065) |
| Dover: | 8.9% (342) |
| Delaware: | 1.4% (1,373) |
| Dover: | 6.1% (236) |
| Delaware: | 1.6% (1,557) |
| Dover: | 5.3% (203) |
| Delaware: | 15.3% (14,887) |
| Dover: | 4.4% (167) |
| Delaware: | 0.5% (451) |
| Dover: | 4.3% (165) |
| Delaware: | 11.6% (11,288) |
| Dover: | 4.3% (164) |
| Delaware: | 1.7% (1,635) |
| Dover: | 3.9% (151) |
| Delaware: | 0.6% (577) |
| Dover: | 3.1% (119) |
| Delaware: | 1.1% (1,038) |
| Dover: | 2.8% (109) |
| Delaware: | 3.0% (2,919) |
| Dover: | 2.4% (94) |
| Delaware: | 0.6% (553) |
| Dover: | 2.4% (92) |
| Delaware: | 3.8% (3,727) |
| Dover: | 2.3% (90) |
| Delaware: | 1.3% (1,286) |
| Dover: | 2.3% (87) |
| Delaware: | 0.2% (227) |
| Dover: | 2.2% (83) |
| Delaware: | 1.4% (1,386) |
| Dover: | 1.7% (64) |
| Delaware: | 1.8% (1,717) |
| Dover: | 1.7% (64) |
| Delaware: | 0.7% (659) |
| Dover: | 1.6% (62) |
| Delaware: | 1.6% (1,552) |
Place of birth for U.S.-born residents:
- This state: 16,538
- Other state: 17,790
- Northeast: 9,721
- Midwest: 1,107
- South: 5,780
- West: 1,093
83.1% of Dover residents lived in the same house 1 years ago.
Out of people who lived in different houses, 31.6% lived in this county.
Out of people who lived in different counties, 13.3% lived in Delaware.
| Dover: | 83.1% |
| State average: | 89.2% |
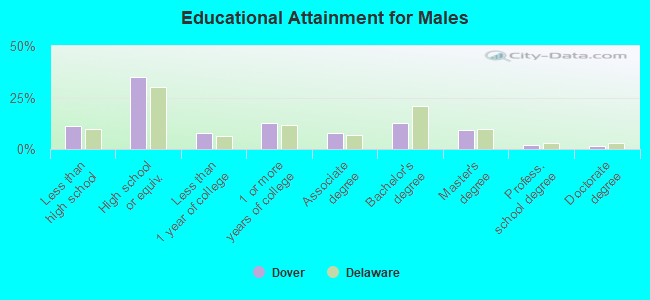
Education attainment for males 25 years and older:
- No schooling: 173
- Nursery to 4th grade: 0
- 5th and 6th grade: 1
- 7th and 8th grade: 42
- 9th grade: 100
- 10th grade: 366
- 11th grade: 262
- 12th grade, no diploma: 298
- High school graduate (or equivalency): 3,886
- Less than 1 year of college: 881
- Some college more than 1 year, no degree: 1,436
- Associate degree: 876
- Bachelor's degree: 1,432
- Master's degree: 1,050
- Professional school degree: 241
- Doctorate degree: 146
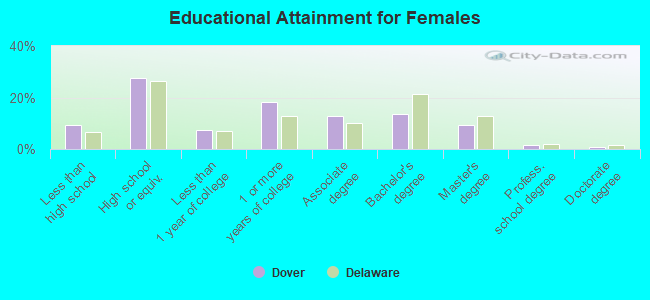
Education attainment for females 25 years and older:
- No schooling: 173
- Nursery to 4th grade: 37
- 5th and 6th grade: 16
- 7th and 8th grade: 85
- 9th grade: 52
- 10th grade: 263
- 11th grade: 193
- 12th grade, no diploma: 482
- High school graduate (or equivalency): 3,880
- Less than 1 year of college: 1,022
- Some college more than 1 year, no degree: 2,579
- Associate degree: 1,779
- Bachelor's degree: 1,897
- Master's degree: 1,301
- Professional school degree: 213
- Doctorate degree: 106
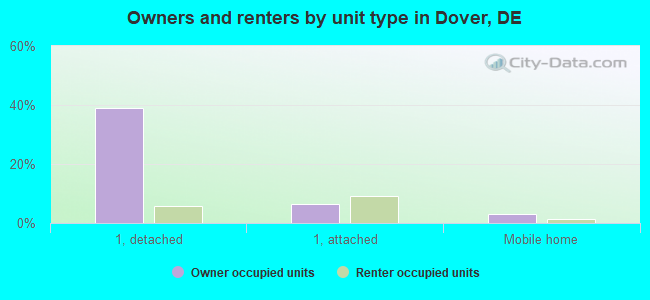
Housing units in structures:
- One, detached: 7,307
- One, attached: 2,297
- Two: 527
- 3 or 4: 734
- 5 to 9: 1,174
- 10 to 19: 2,234
- 20 to 49: 991
- 50 or more: 848
- Mobile homes: 910
- Boats, RVs, vans, etc.: 52
Housing units lacking complete kitchen facilities in 2022: 1.8%
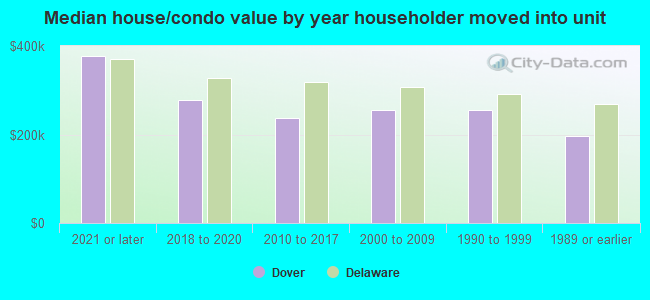
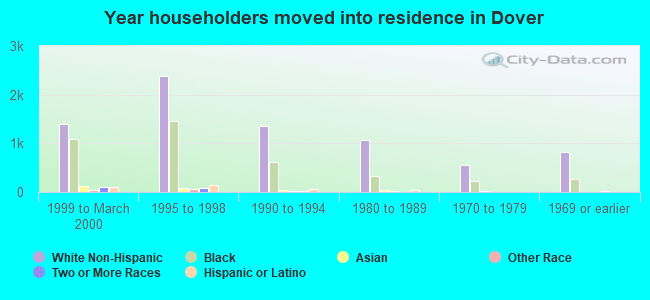
House/condo owner moved in on average 10 years ago
Renter moved in on average 2 years ago
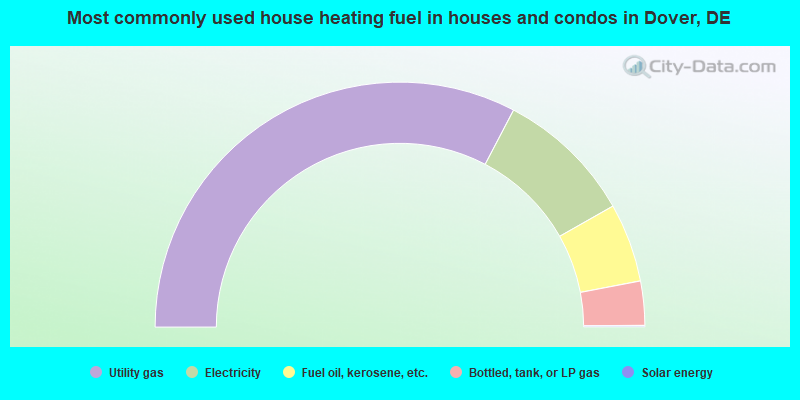
- 65.3%Utility gas
- 18.2%Electricity
- 10.4%Fuel oil, kerosene, etc.
- 5.8%Bottled, tank, or LP gas
- 0.2%Solar energy
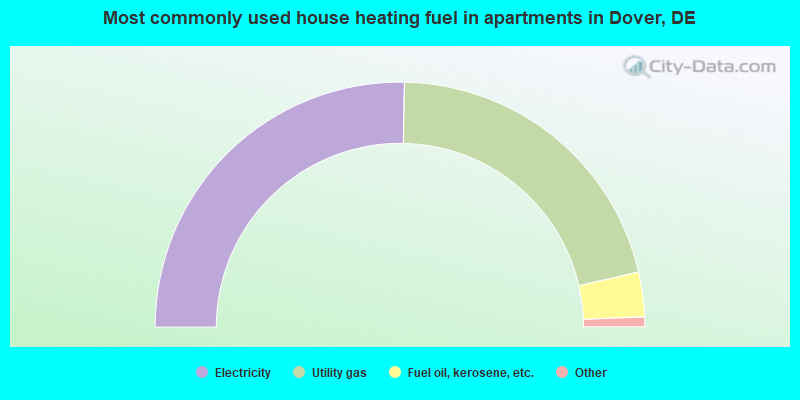
- 50.6%Electricity
- 42.2%Utility gas
- 5.9%Fuel oil, kerosene, etc.
- 0.8%Bottled, tank, or LP gas
- 0.4%No fuel used
- 0.2%Coal or coke
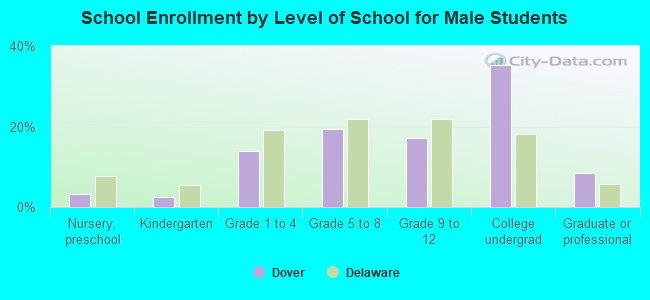
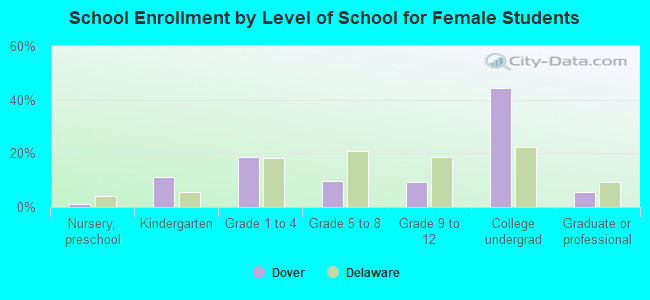
Private vs. public school enrollment:
| Here: | 4.9% |
| Delaware: | 11.5% |
| Here: | 9.1% |
| Delaware: | 12.1% |
| Here: | 15.2% |
| Delaware: | 19.2% |