Depew, NY (New York) Houses and Residents
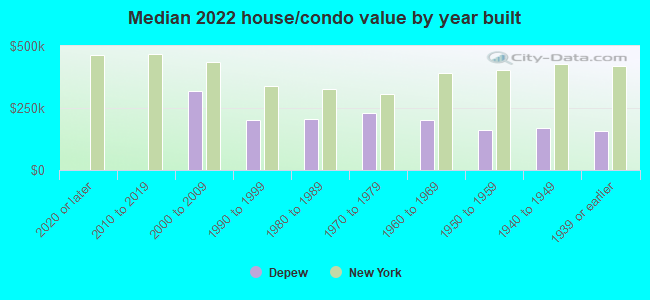
| Depew: | $182,514 |
| New York: | $400,400 |
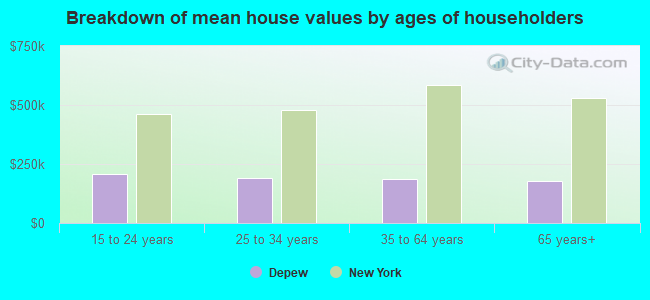
Mean price in 2022:
Detached houses: $168,286
Here: $168,286 State: $476,719 Townhouses or other attached units: $197,782
Here: $197,782 State: $699,270 In 2-unit structures: $194,203
Here: $194,203 State: $713,077 In 3-to-4-unit structures: $206,969
Here: $206,969 State: $764,568 Mobile homes: $36,778
Here: $36,778 State: $88,925
Total population: 15,205 (All urban)
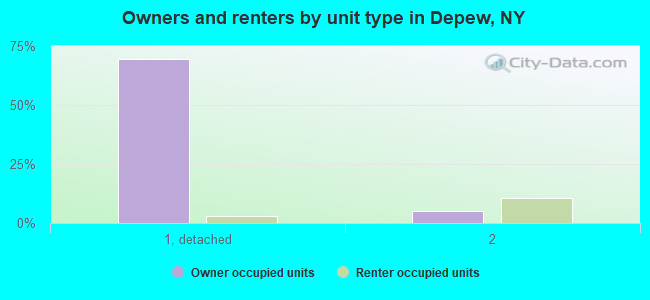
Houses: 7,030 (6,786 occupied: 5,224 owner occupied, 1,600 renter occupied)
| % of renters here: | 23% |
| State: | 46% |
Housing density: 1,387 houses/condos per square mile
Median price asked for vacant for-sale houses and condos in 2022: $194,190.
Median contract rent in 2022: $893 (lower quartile is $766, upper quartile is $1,193)
Median rent asked for vacant for-rent units in 2022: $934
Median gross rent in Depew, NY in 2022: $1,051
Housing units in Depew with a mortgage: 3,068 (311 second mortgage, 7 home equity loan, 298 both second mortgage and home equity loan)
Houses without a mortgage: 251
Median household income for houses/condos with a mortgage: $89,639
Median household income for apartments without a mortgage: $60,127
Median monthly housing costs: $1,048
Compare current foreclosures in Depew, NY:
| Photo | Address | Area | Beds / Baths | Price | Details |
|---|---|---|---|---|---|

|
#1
Lee St
Depew, NY 14043
|
1,040 sq. feet
|
1 baths 3 beds |
$169,900
|
show details |

|
#2
Mona Ct
Depew, NY 14043
|
1,648 sq. feet
|
2 baths 4 beds |
show details | |

|
#3
Arlington Pl
Depew, NY 14043
|
1,160 sq. feet
|
1 baths 4 beds |
show details | |

|
#4
Transit Rd
Depew, NY 14043
|
1,554 sq. feet
|
1 baths 4 beds |
show details | |

|
#5
Madeira Dr
Depew, NY 14043
|
1,120 sq. feet
|
1 baths 3 beds |
show details | |

|
#6
Helenbrook Ln
Depew, NY 14043
|
1,100 sq. feet
|
1 baths 3 beds |
show details | |

|
#7
Lackawanna Ave
Depew, NY 14043
|
1,749 sq. feet
|
1 baths 4 beds |
show details | |

|
#8
George Urban Blvd
Depew, NY 14043
|
1,308 sq. feet
|
1 baths 4 beds |
show details | |

|
#9
Olmstead Ave
Depew, NY 14043
|
1,842 sq. feet
|
1 baths 4 beds |
show details | |

|
#10
Penora St
Depew, NY 14043
|
1,453 sq. feet
|
1 baths 4 beds |
show details |
| Photo | Address | Area | Beds / Baths | Price | Details |
|---|---|---|---|---|---|

|
#11
Ledyard Ave
Depew, NY 14043
|
1,152 sq. feet
|
1 baths 3 beds |
show details | |

|
#12
S Ellington Ave # 2
Depew, NY 14043
|
2,487 sq. feet
|
4 baths 4 beds |
show details | |

|
#13
Hyland Ave
Depew, NY 14043
|
1,064 sq. feet
|
1 baths 3 beds |
show details | |

|
#14
Christophel Dr
Depew, NY 14043
|
1,034 sq. feet
|
1 baths 3 beds |
show details | |

|
#15
Irving Ter
Depew, NY 14043
|
1,152 sq. feet
|
1 baths 3 beds |
show details | |

|
#16
Como Park Blvd
Depew, NY 14043
|
1,562 sq. feet
|
1 baths 2 beds |
show details | |

|
#17
Cornell Dr
Depew, NY 14043
|
1,520 sq. feet
|
1 baths 3 beds |
show details | |

|
#18
Bryant St
Depew, NY 14043
|
1,814 sq. feet
|
1 baths 3 beds |
show details | |

|
#19
Wyndmoor Ct
Depew, NY 14043
|
1,118 sq. feet
|
1 baths 3 beds |
show details | |

|
#20
Ledyard Ave
Depew, NY 14043
|
1,152 sq. feet
|
1 baths 3 beds |
show details |
| Photo | Address | Area | Beds / Baths | Price | Details |
|---|---|---|---|---|---|

|
#21
Rowley Rd Apt 1
Depew, NY 14043
|
2,756 sq. feet
|
3 baths 4 beds |
show details | |

|
#22
French Rd
Depew, NY 14043
|
1,840 sq. feet
|
1 baths 4 beds |
show details | |

|
#23
Warner Rd
Depew, NY 14043
|
1,668 sq. feet
|
1 baths 3 beds |
show details | |

|
#24
Cheryl Ln
Depew, NY 14043
|
1,652 sq. feet
|
1 baths 3 beds |
show details | |

|
#25
Cardy Ln
Depew, NY 14043
|
1,237 sq. feet
|
1 baths 3 beds |
show details | |

|
#26
Alys Dr E
Depew, NY 14043
|
1,140 sq. feet
|
2 baths 3 beds |
show details | |

|
#27
Chateau Ct
Depew, NY 14043
|
1,840 sq. feet
|
1 baths 4 beds |
show details | |

|
#28
Enez Dr
Depew, NY 14043
|
1,118 sq. feet
|
1 baths 3 beds |
show details | |

|
#29
Dubonnet Dr
Depew, NY 14043
|
1,516 sq. feet
|
1 baths 3 beds |
show details | |

|
#30
Dick Rd Apt A1
Depew, NY 14043
|
- sq. feet
|
- baths - beds |
show details |
| Photo | Address | Area | Beds / Baths | Price | Details |
|---|---|---|---|---|---|

|
#31
William St Apt 221
Depew, NY 14043
|
- sq. feet
|
- baths - beds |
show details | |

|
#32
Transit Rd # 233
Depew, NY 14043
|
- sq. feet
|
- baths - beds |
show details | |

|
#33
Transit Rd # 231
Depew, NY 14043
|
- sq. feet
|
- baths - beds |
show details | |

|
#34
Transit Rd # R6
Depew, NY 14043
|
- sq. feet
|
- baths - beds |
show details | |

|
#35
Darwin Dr
Depew, NY 14043
|
- sq. feet
|
- baths - beds |
show details | |

|
#36
Lancer Ct Apt B
Depew, NY 14043
|
- sq. feet
|
- baths - beds |
show details | |

|
#37
Transit Rd Apt 3108
Depew, NY 14043
|
- sq. feet
|
- baths - beds |
show details | |

|
#38
Transit Rd
Depew, NY 14043
|
- sq. feet
|
- baths - beds |
show details | |

|
#39
Brewster St
Depew, NY 14043
|
- sq. feet
|
- baths - beds |
show details | |

|
#40
Laverack Ave
Depew, NY 14043
|
- sq. feet
|
- baths - beds |
show details |
| Photo | Address | Area | Beds / Baths | Price | Details |
|---|---|---|---|---|---|

|
Check over 1 million property listings on Foreclosure.com!
|
browse all offers | |||
| Photo | Address | Area | Beds / Baths | Price | Details |
|---|

Latest news about housing in Depew, NY collected exclusively by city-data.com from local newspapers, TV, and radio stations

 | Buffalo-Boom/Bust II (609 replies) |
| Crane watch map (347 replies) |
| New houses? (30 replies) |
| Buffalo--Boom or Bust (849 replies) |
| Rental Homes - A Resource Contact? (5 replies) |
| High end housing in WNY (12 replies) |

Median year apartment built: 1961
Household type by relationship:
Households: 15,126- Male householders: 2,832 (919 living alone), Female householders: 3,906 (1,345 living alone)
2,858 spouses (2,843 opposite-sex spouses), 481 unmarried partners, (471 opposite-sex unmarried partners), 3,986 children (3,718 natural, 74 adopted, 192 stepchildren), 295 grandchildren, 46 brothers or sisters, 148 parents, 0 foster children, 240 other relatives, 244 non-relatives
- In group quarters: 84
Size of family households: 1,972 2-persons, 1,058 3-persons, 721 4-persons, 270 5-persons, 131 6-persons, 11 7-or-more-persons.
Size of nonfamily households: 2,264 1-person, 366 2-persons, 19 3-persons, 6 4-persons, 5 5-persons.
1,621 married couples with children.
982 single-parent households (176 men, 806 women).
94.0% of residents of Depew speak English at home.
1.6% of residents speak Spanish at home (81% speak English very well, 18% speak English well).
3.0% of residents speak other Indo-European language at home (72% speak English very well, 15% speak English well, 12% speak English not well, 1% don't speak English at all).
0.4% of residents speak Asian or Pacific Island language at home (16% speak English very well, 23% speak English well, 41% speak English not well, 20% don't speak English at all).
1.0% of residents speak other language at home (100% speak English very well).
Foreign born population: 517 (3.4%)
(70.6% of them are naturalized citizens)
| Here: | 6.2 |
| State: | 6.3 |
| Here: | 4.8 |
| State: | 3.8 |
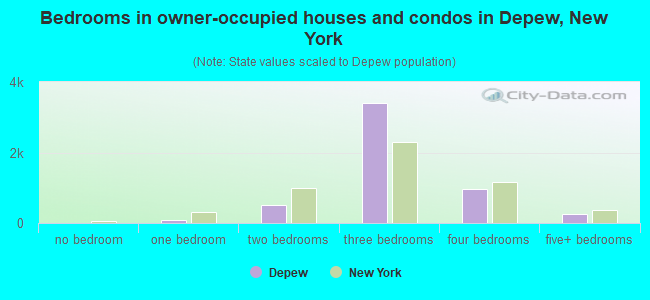
- Bedrooms in owner-occupied houses and condos in Depew, New York
- 0no bedroom
- 931 bedroom
- 5062 bedrooms
- 3,4023 bedrooms
- 9674 bedrooms
- 2565+ bedrooms
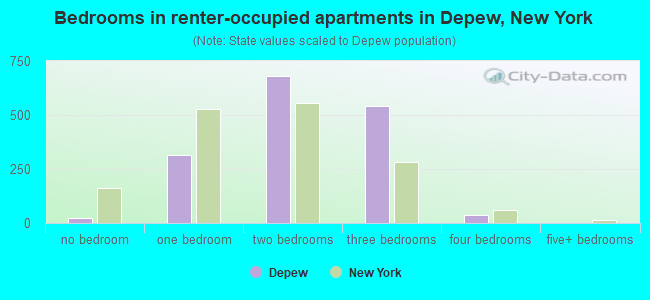
- Bedrooms in renter-occupied apartments in Depew, New York
- 25no bedroom
- 3141 bedroom
- 6822 bedrooms
- 5413 bedrooms
- 384 bedrooms
- 05+ bedrooms
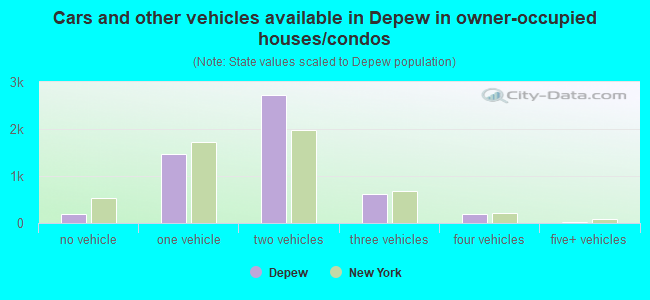
- Cars and other vehicles available in Depew in owner-occupied houses/condos
- 190no vehicle
- 1,4691 vehicle
- 2,7342 vehicles
- 6123 vehicles
- 1934 vehicles
- 255+ vehicles
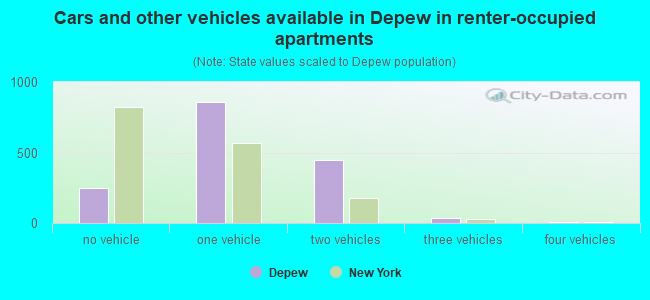
- Cars and other vehicles available in Depew in renter-occupied apartments
- 245no vehicle
- 8581 vehicle
- 4482 vehicles
- 353 vehicles
- 94 vehicles
- 55+ vehicles
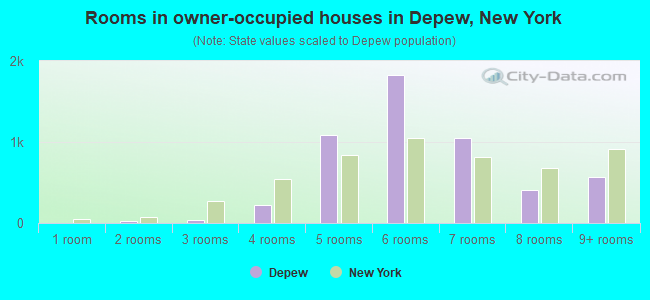
- Rooms in owner-occupied houses in Depew, New York
- 01 room
- 272 rooms
- 413 rooms
- 2224 rooms
- 1,0865 rooms
- 1,8306 rooms
- 1,0517 rooms
- 4038 rooms
- 5659+ rooms
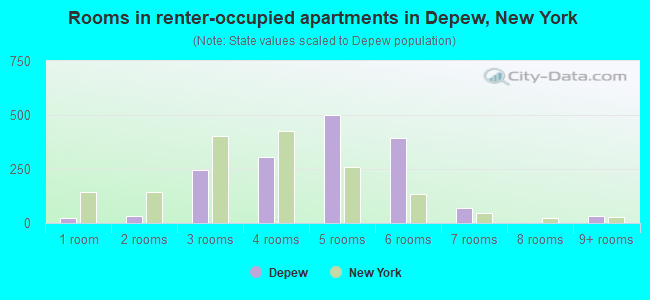
- Rooms in renter-occupied apartments in Depew, New York
- 251 room
- 322 rooms
- 2453 rooms
- 3074 rooms
- 4985 rooms
- 3926 rooms
- 697 rooms
- 08 rooms
- 339+ rooms
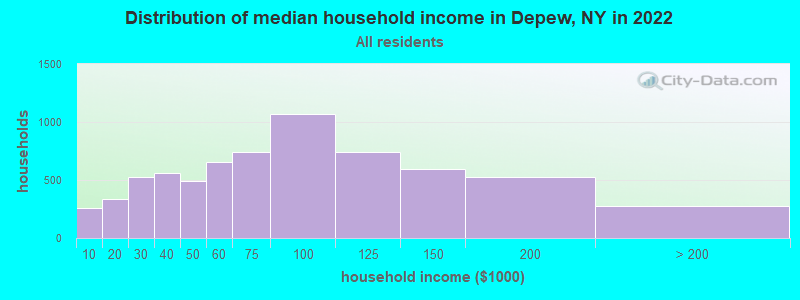
Depew, NY household income distribution

- 262Less than $10,000
- 334$10,000 to $19,999
- 527$20,000 to $29,999
- 558$30,000 to $39,999
- 495$40,000 to $49,999
- 658$50,000 to $59,999
- 743$60,000 to $74,999
- 1,065$75,000 to $99,999
- 742$100,000 to $124,999
- 595$125,000 to $149,999
- 522$150,000 to $199,999
- 279$200,000 or more
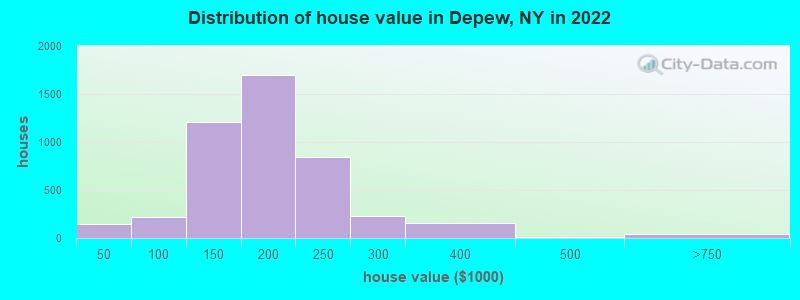
Home value of owner - occupied houses in 2022 in Depew, NY
-
- 40Less than $10,000
- 45$10,000 to $14,999
- 48$15,000 to $19,999
- 10$40,000 to $49,999
- 11$50,000 to $59,999
- 67$70,000 to $79,999
- 47$80,000 to $89,999
- 82$90,000 to $99,999
- 663$100,000 to $124,999
- 542$125,000 to $149,999
- 872$150,000 to $174,999
- 822$175,000 to $199,999
- 844$200,000 to $249,999
- 223$250,000 to $299,999
- 154$300,000 to $399,999
- 15$400,000 to $499,999
- 29$500,000 to $749,999
- 12$1,000,000 to $1,499,999
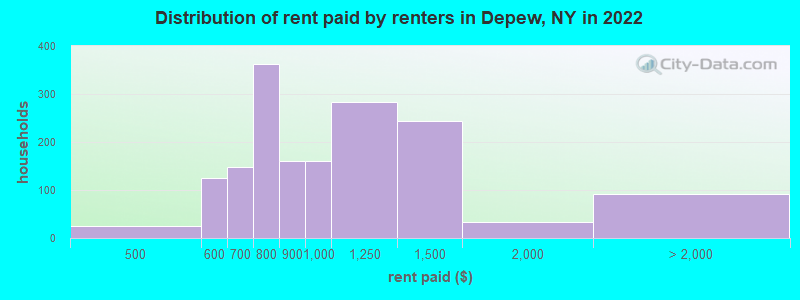
Rent paid by renters in 2022 in Depew, NY
-
- 11$400 to $449
- 12$450 to $499
- 112$500 to $549
- 10$550 to $599
- 91$600 to $649
- 55$650 to $699
- 149$700 to $749
- 212$750 to $799
- 159$800 to $899
- 159$900 to $999
- 283$1,000 to $1,249
- 242$1,250 to $1,499
- 33$1,500 to $1,999
- 15$2,000 to $2,499
- 75No cash rent
Percentage of workers working in this county: 95.4%
Number of people working at home: 681 (8.8% of all workers)
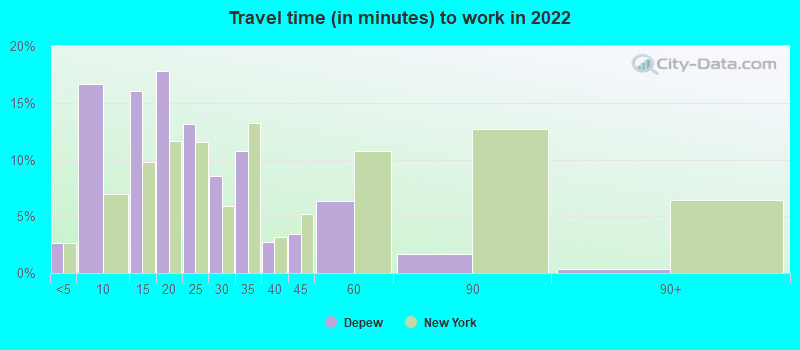
Travel time to work (commute)
- Less than 5 minutes: 220
- 5 to 9 minutes: 1,273
- 10 to 14 minutes: 1,139
- 15 to 19 minutes: 1,366
- 20 to 24 minutes: 923
- 25 to 29 minutes: 519
- 30 to 34 minutes: 837
- 35 to 39 minutes: 132
- 40 to 44 minutes: 73
- 45 to 59 minutes: 187
- 60 to 89 minutes: 144
- 90 or more minutes: 89
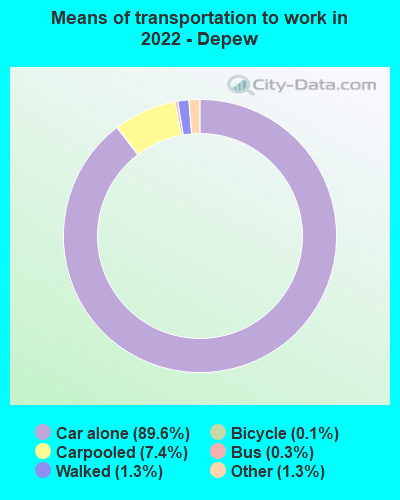
Means of transportation to work:
- Drove a car alone: 7,409 (79.6%)
- Carpooled: 731 (7.9%)
- Bus: 27 (0.3%)
- Taxi: 148 (1.6%)
- Bicycle: 7 (0.1%)
- Walked: 115 (1.2%)
- Worked at home: 681 (7.3%)
- Unemployment by race in 2022
- Unemployment rate for White non-Hispanic residents
- 2.0%Males
- 5.0%Females
- Unemployment rate for Black residents
- 28.9%Females
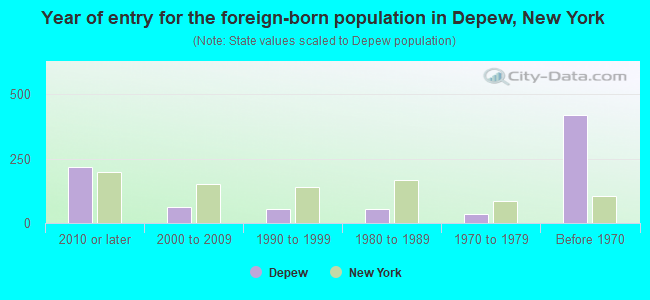
- Year of entry for the foreign-born population in Depew, New York
- 2172010 or later
- 612000 to 2009
- 551990 to 1999
- 561980 to 1989
- 361970 to 1979
- 419Before 1970
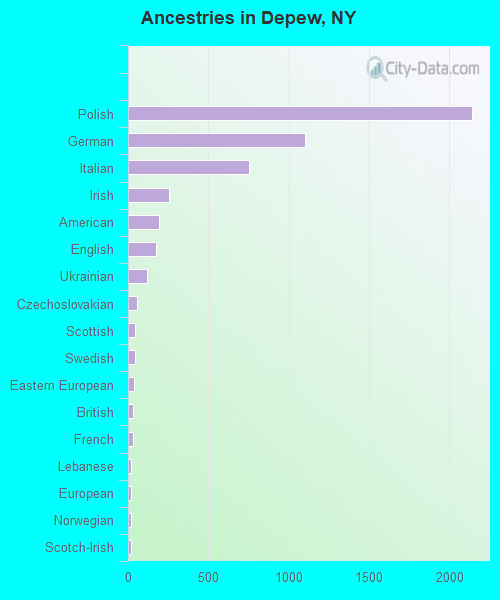
First ancestries reported:
- Polish: 2,140 (33.4%)
- German: 1,104 (17.2%)
- Italian: 755 (11.8%)
- Irish: 258 (4.0%)
- American: 196 (3.1%)
- English: 176 (2.7%)
- Ukrainian: 118 (1.8%)
- Czechoslovakian: 54 (0.8%)
- Scottish: 46 (0.7%)
- Swedish: 44 (0.7%)
- Eastern European: 36 (0.6%)
- British: 34 (0.5%)
- French: 32 (0.5%)
- Lebanese: 21 (0.3%)
- European: 21 (0.3%)
- Norwegian: 20 (0.3%)
- Scotch-Irish: 20 (0.3%)
- Israeli: 17 (0.3%)
- Bulgarian: 12 (0.2%)
- Greek: 12 (0.2%)
- Hungarian: 12 (0.2%)
- French Canadian: 8 (0.1%)
- Slovak: 7 (0.1%)
- Canadian: 6 (0.09%)
- West Indian: 5 (0.08%)
- Austrian: 3 (0.05%)
Most common places of birth for foreign-born residents (%):
| Depew: | 14.8% (79) |
| New York: | 0.0% (1,517) |
| Depew: | 14.6% (78) |
| New York: | 0.9% (38,713) |
| Depew: | 13.7% (73) |
| New York: | 9.1% (410,910) |
| Depew: | 11.4% (61) |
| New York: | 1.7% (78,421) |
| Depew: | 9.2% (49) |
| New York: | 3.5% (158,432) |
| Depew: | 8.6% (46) |
| New York: | 1.4% (65,102) |
| Depew: | 7.1% (38) |
| New York: | 0.1% (5,444) |
| Depew: | 6.2% (33) |
| New York: | 11.1% (501,040) |
| Depew: | 3.4% (18) |
| New York: | 0.7% (29,743) |
| Depew: | 1.9% (10) |
| New York: | 0.2% (8,026) |
| Depew: | 1.9% (10) |
| New York: | 0.2% (6,810) |
| Depew: | 1.7% (9) |
| New York: | 1.8% (81,374) |
Place of birth for U.S.-born residents:
- This state: 12,954
- Other state: 1,364
- Northeast: 487
- Midwest: 147
- South: 446
- West: 313
94.9% of Depew residents lived in the same house 1 years ago.
Out of people who lived in different houses, 44.2% lived in this county.
Out of people who lived in different counties, 21.4% lived in New York.
| Depew: | 94.9% |
| State average: | 89.6% |
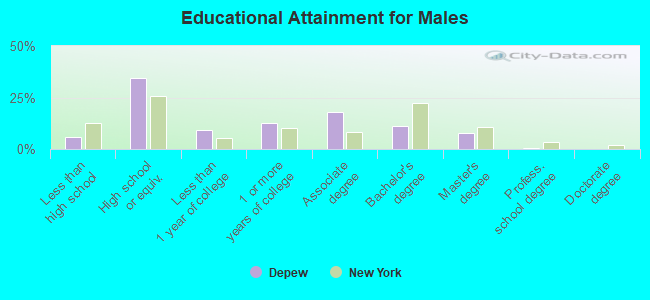
Education attainment for males 25 years and older:
- No schooling: 24
- Nursery to 4th grade: 16
- 5th and 6th grade: 1
- 7th and 8th grade: 49
- 9th grade: 42
- 10th grade: 16
- 11th grade: 42
- 12th grade, no diploma: 104
- High school graduate (or equivalency): 1,743
- Less than 1 year of college: 475
- Some college more than 1 year, no degree: 643
- Associate degree: 893
- Bachelor's degree: 569
- Master's degree: 381
- Professional school degree: 27
- Doctorate degree: 10
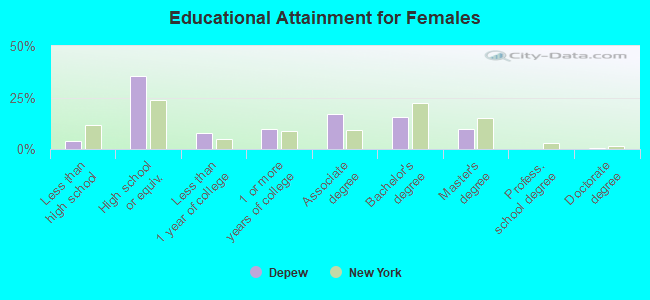
Education attainment for females 25 years and older:
- No schooling: 24
- Nursery to 4th grade: 0
- 5th and 6th grade: 1
- 7th and 8th grade: 9
- 9th grade: 10
- 10th grade: 32
- 11th grade: 38
- 12th grade, no diploma: 130
- High school graduate (or equivalency): 2,154
- Less than 1 year of college: 474
- Some college more than 1 year, no degree: 590
- Associate degree: 1,029
- Bachelor's degree: 944
- Master's degree: 604
- Professional school degree: 6
- Doctorate degree: 29


Housing units in structures:
- One, detached: 5,036
- One, attached: 156
- Two: 1,172
- 3 or 4: 329
- 5 to 9: 269
- 10 to 19: 5
- 20 to 49: 20
- 50 or more: 9
- Mobile homes: 31
Median worth of mobile homes: $12,713
Housing units lacking complete kitchen facilities in 2022: 2.0%
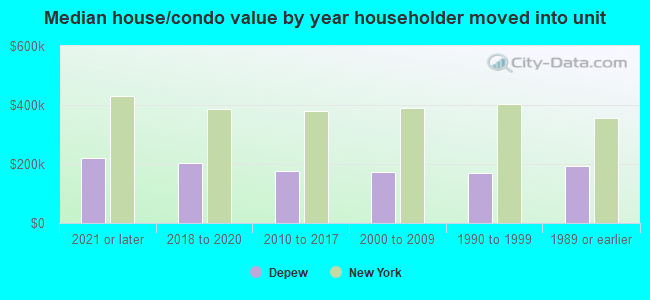
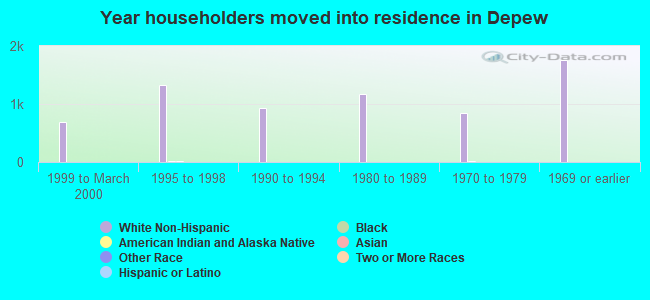
House/condo owner moved in on average 17 years ago
Renter moved in on average 6 years ago
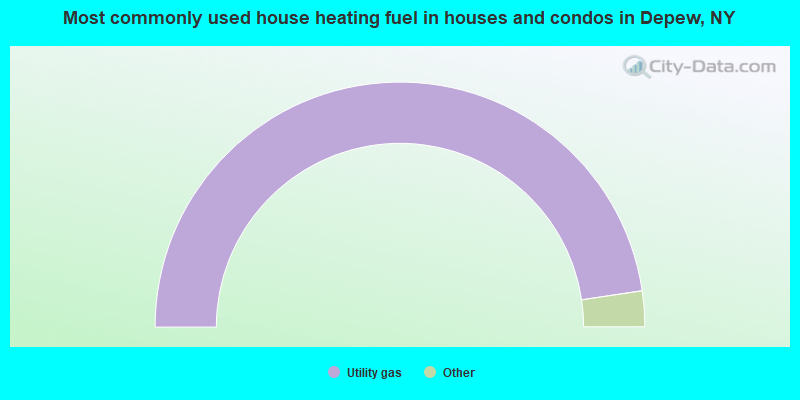
- 95.3%Utility gas
- 1.8%Electricity
- 0.9%Other fuel
- 0.8%Bottled, tank, or LP gas
- 0.5%Wood
- 0.4%Fuel oil, kerosene, etc.
- 0.2%Solar energy
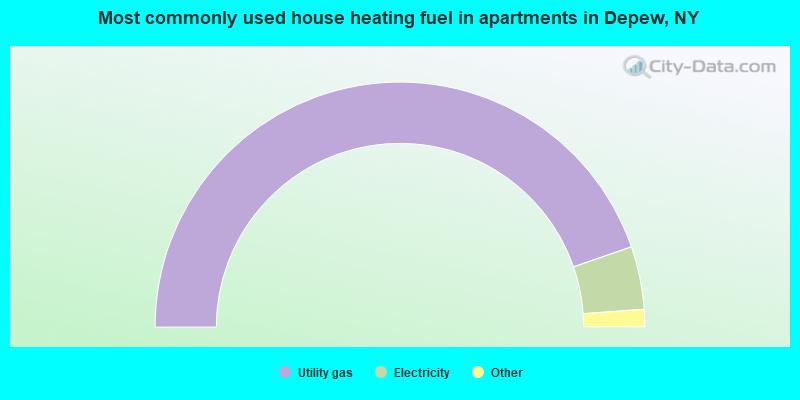
- 89.4%Utility gas
- 8.3%Electricity
- 1.6%Bottled, tank, or LP gas
- 0.6%Other fuel
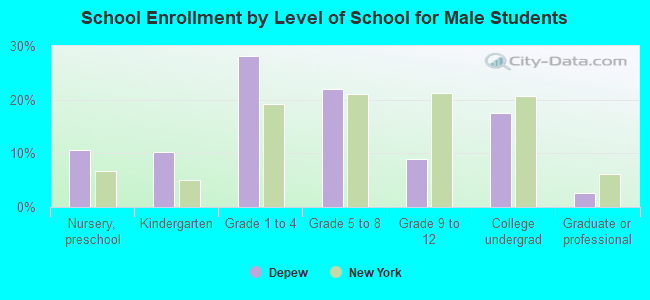
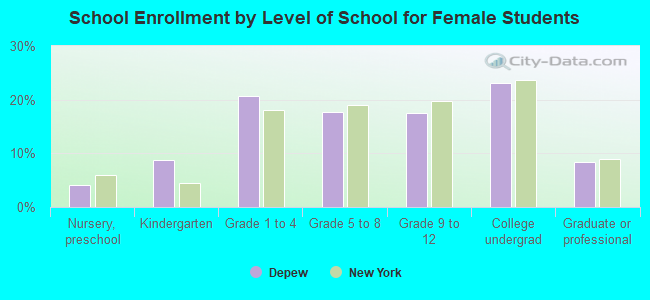
Private vs. public school enrollment:
| Here: | 12.8% |
| New York: | 15.6% |
| Here: | 6.0% |
| New York: | 15.0% |
| Here: | 25.6% |
| New York: | 39.2% |