Delano, CA (California) Houses and Residents
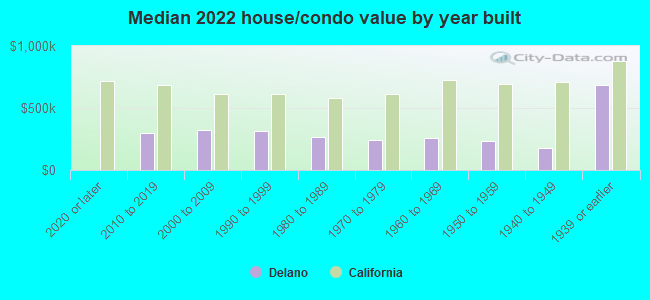
| Delano: | $288,108 |
| California: | $715,900 |
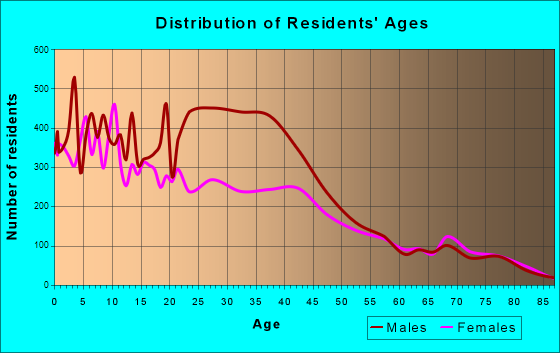
Total population: 52,651 (Urban population: 38,601 (all inside urban clusters), Rural population: 380 (all nonfarm))
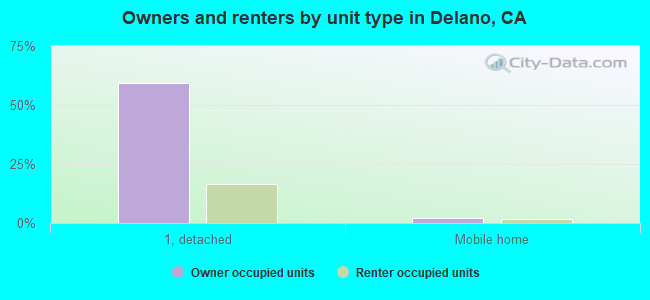
Houses: 12,227 (11,672 occupied: 7,242 owner occupied, 4,506 renter occupied)
| % of renters here: | 38% |
| State: | 44% |
Housing density: 1,210 houses/condos per square mile
Median price asked for vacant for-sale houses and condos in 2022: $863,787.
Median contract rent in 2022: $846 (lower quartile is $609, upper quartile is $1,092)
Median rent asked for vacant for-rent units in 2022: $929
Median gross rent in Delano, CA in 2022: $1,118
Housing units in Delano with a mortgage: 4,742 (205 second mortgage, 32 home equity loan, 101 both second mortgage and home equity loan)
Houses without a mortgage: 77
Median household income for houses/condos with a mortgage: $76,808
Median household income for apartments without a mortgage: $47,561
Median monthly housing costs: $1,202
Compare current foreclosures near Delano, CA:
| Photo | Address | Area | Beds / Baths | Price | Details |
|---|---|---|---|---|---|

|
#1
13th Ave
Delano, CA 93215
|
1,324 sq. feet
|
1 baths 2 beds |
show details | |

|
#2
N Cabrillo Way
Delano, CA 93215
|
1,109 sq. feet
|
2 baths 3 beds |
show details | |

|
#3
18th Ave
Delano, CA 93215
|
1,553 sq. feet
|
2 baths 4 beds |
show details | |

|
#4
W 13th Ave
Delano, CA 93215
|
955 sq. feet
|
2 baths 3 beds |
show details | |

|
#5
San Marco Ct
Delano, CA 93215
|
2,809 sq. feet
|
3 baths 5 beds |
show details | |

|
#6
Clinton St
Delano, CA 93215
|
858 sq. feet
|
1 baths 2 beds |
show details | |

|
#7
7th Ave
Delano, CA 93215
|
1,396 sq. feet
|
2 baths 3 beds |
show details | |

|
#8
College Dr
Delano, CA 93215
|
1,202 sq. feet
|
2 baths 4 beds |
show details | |

|
#9
Catalina Pl
Delano, CA 93215
|
1,434 sq. feet
|
2 baths 4 beds |
show details | |

|
#10
Franciscan Plz
Delano, CA 93215
|
1,434 sq. feet
|
2 baths 4 beds |
show details |
| Photo | Address | Area | Beds / Baths | Price | Details |
|---|---|---|---|---|---|

|
#11
Kensington St
Delano, CA 93215
|
- sq. feet
|
- baths - beds |
show details | |

|
#12
Belmont St Apt 67
Delano, CA 93215
|
- sq. feet
|
- baths - beds |
show details | |

|
#13
18th Ave Apt A
Delano, CA 93215
|
- sq. feet
|
- baths - beds |
show details | |

|
#14
Chaparral Dr
Delano, CA 93215
|
- sq. feet
|
- baths - beds |
show details | |

|
#15
Belmont St Apt 41
Delano, CA 93215
|
- sq. feet
|
- baths - beds |
show details | |

|
#16
N Mariposa Rd
Earlimart, CA 93219
|
1,232 sq. feet
|
2 baths 4 beds |
show details | |

|
#17
Cherrywood St
Mc Farland, CA 93250
|
1,261 sq. feet
|
2 baths 4 beds |
show details | |

|
#18
Cliff Ave
Mc Farland, CA 93250
|
1,040 sq. feet
|
2 baths 3 beds |
show details | |

|
#19
Taylor Ave
Mc Farland, CA 93250
|
1,126 sq. feet
|
2 baths 4 beds |
show details | |

|
#20
Oak Creek Ct
Wasco, CA 93280
|
1,301 sq. feet
|
2 baths 3 beds |
show details |
| Photo | Address | Area | Beds / Baths | Price | Details |
|---|---|---|---|---|---|

|
#21
Appletree Ln
Wasco, CA 93280
|
2,187 sq. feet
|
2 baths 4 beds |
show details | |

|
#22
Buenaventura St
Wasco, CA 93280
|
1,440 sq. feet
|
2 baths 3 beds |
show details | |

|
#23
Primrose Ct
Wasco, CA 93280
|
1,363 sq. feet
|
2 baths 4 beds |
show details | |

|
#24
Rio Santana Ct
Mc Farland, CA 93250
|
- sq. feet
|
- baths - beds |
show details | |

|
#25
W Sherwood Ave Apt 4
Mc Farland, CA 93250
|
- sq. feet
|
- baths - beds |
show details | |

|
#26
Prairie Rose Way
Wasco, CA 93280
|
- sq. feet
|
- baths - beds |
show details | |

|
#27
Terra Bella
Terra Bella, CA 93270
|
- sq. feet
|
- baths - beds |
show details | |

|
Check over 1 million property listings on Foreclosure.com!
|
browse all offers | |||

Latest news about housing in Delano, CA collected exclusively by city-data.com from local newspapers, TV, and radio stations

 | Is Marin County very liberal? (99 replies) |
| Landfills and/or oil wells affect housing?? (8 replies) |
| How do people afford to live in CA (172 replies) |
| Keep Marin County Beautiful! (13 replies) |
| Is the San Joaquin Valley really a desert? (90 replies) |
| Opinions on living adjacent to oil wells (5 replies) |
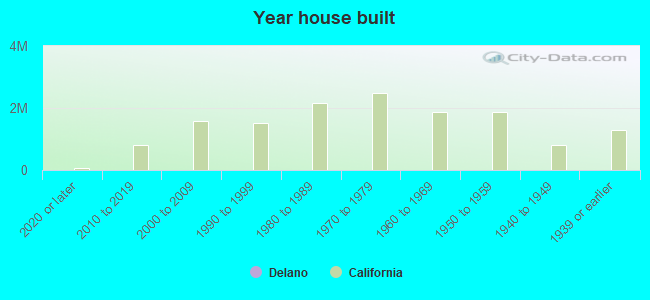
Median year apartment built: 1990
Household type by relationship:
Households: 51,011- Male householders: 6,075 (690 living alone), Female householders: 5,541 (731 living alone)
7,014 spouses (6,992 opposite-sex spouses), 597 unmarried partners, (586 opposite-sex unmarried partners), 18,052 children (17,504 natural, 286 adopted, 261 stepchildren), 1,288 grandchildren, 949 brothers or sisters, 1,553 parents, 22 foster children, 1,826 other relatives, 1,041 non-relatives
- In group quarters: 7,047
Size of family households: 2,377 2-persons, 1,926 3-persons, 2,317 4-persons, 1,710 5-persons, 887 6-persons, 833 7-or-more-persons.
Size of nonfamily households: 1,424 1-person, 234 2-persons, 79 3-persons, 25 6-persons.
7,134 married couples with children.
3,239 single-parent households (854 men, 2,385 women).
26.6% of residents of Delano speak English at home.
60.1% of residents speak Spanish at home (50% speak English very well, 22% speak English well, 16% speak English not well, 12% don't speak English at all).
0.6% of residents speak other Indo-European language at home (41% speak English very well, 11% speak English well, 35% speak English not well, 13% don't speak English at all).
10.2% of residents speak Asian or Pacific Island language at home (44% speak English very well, 36% speak English well, 15% speak English not well, 5% don't speak English at all).
0.7% of residents speak other language at home (66% speak English very well, 27% speak English well, 7% don't speak English at all).
Foreign born population: 17,464 (34.2%)
(36.0% of them are naturalized citizens)
| Here: | 5.7 |
| State: | 6.0 |
| Here: | 4.3 |
| State: | 3.9 |
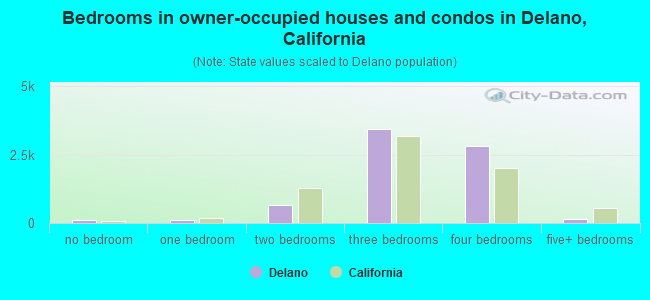
- Bedrooms in owner-occupied houses and condos in Delano, California
- 93no bedroom
- 1111 bedroom
- 6462 bedrooms
- 3,4353 bedrooms
- 2,8054 bedrooms
- 1525+ bedrooms
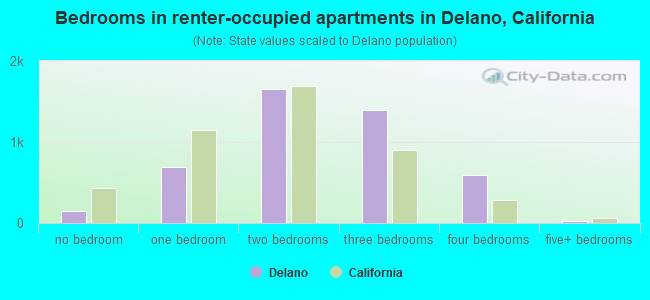
- Bedrooms in renter-occupied apartments in Delano, California
- 144no bedroom
- 6941 bedroom
- 1,6552 bedrooms
- 1,4013 bedrooms
- 5884 bedrooms
- 255+ bedrooms
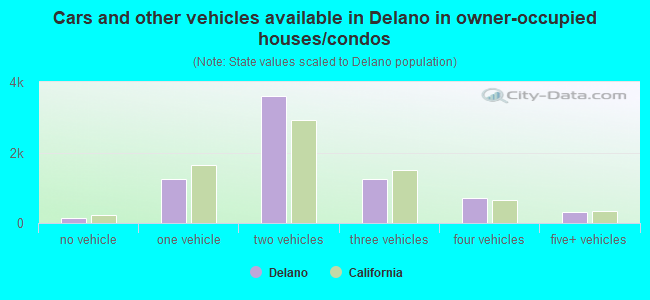
- Cars and other vehicles available in Delano in owner-occupied houses/condos
- 136no vehicle
- 1,2541 vehicle
- 3,5932 vehicles
- 1,2413 vehicles
- 7194 vehicles
- 2995+ vehicles
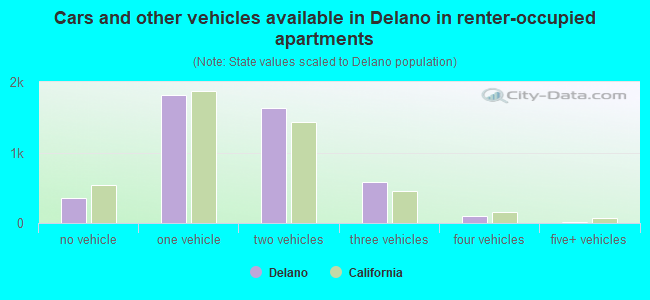
- Cars and other vehicles available in Delano in renter-occupied apartments
- 353no vehicle
- 1,8171 vehicle
- 1,6312 vehicles
- 5843 vehicles
- 1064 vehicles
- 155+ vehicles
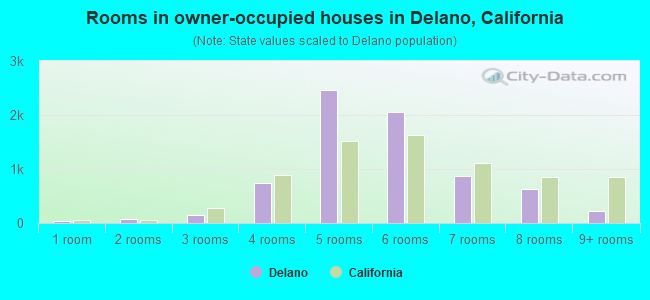
- Rooms in owner-occupied houses in Delano, California
- 461 room
- 752 rooms
- 1403 rooms
- 7414 rooms
- 2,4695 rooms
- 2,0646 rooms
- 8637 rooms
- 6238 rooms
- 2229+ rooms
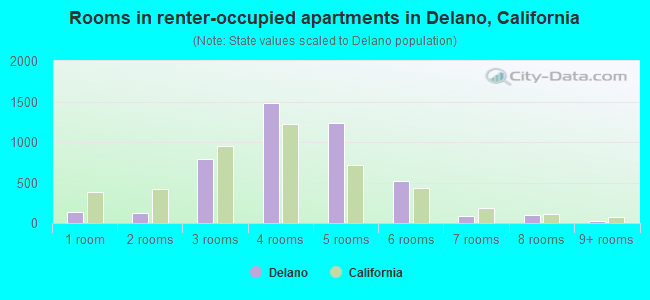
- Rooms in renter-occupied apartments in Delano, California
- 1371 room
- 1252 rooms
- 7883 rooms
- 1,4814 rooms
- 1,2335 rooms
- 5246 rooms
- 907 rooms
- 998 rooms
- 309+ rooms
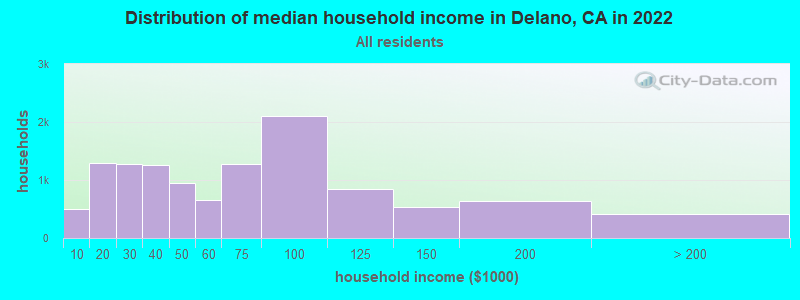
Delano, CA household income distribution

- 504Less than $10,000
- 1,299$10,000 to $19,999
- 1,268$20,000 to $29,999
- 1,261$30,000 to $39,999
- 946$40,000 to $49,999
- 647$50,000 to $59,999
- 1,275$60,000 to $74,999
- 2,106$75,000 to $99,999
- 853$100,000 to $124,999
- 543$125,000 to $149,999
- 632$150,000 to $199,999
- 406$200,000 or more
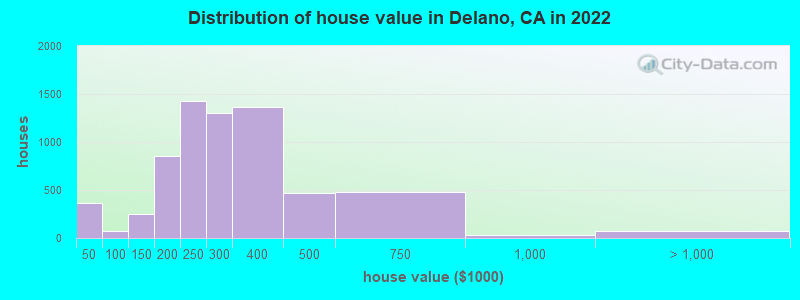
Home value of owner - occupied houses in 2022 in Delano, CA
-
- 120Less than $10,000
- 9$15,000 to $19,999
- 167$20,000 to $24,999
- 24$25,000 to $29,999
- 17$30,000 to $34,999
- 5$35,000 to $39,999
- 19$40,000 to $49,999
- 18$50,000 to $59,999
- 29$60,000 to $69,999
- 8$90,000 to $99,999
- 194$100,000 to $124,999
- 56$125,000 to $149,999
- 417$150,000 to $174,999
- 434$175,000 to $199,999
- 1,429$200,000 to $249,999
- 1,298$250,000 to $299,999
- 1,361$300,000 to $399,999
- 465$400,000 to $499,999
- 477$500,000 to $749,999
- 35$750,000 to $999,999
- 28$1,000,000 to $1,499,999
- 45$2,000,000 or more
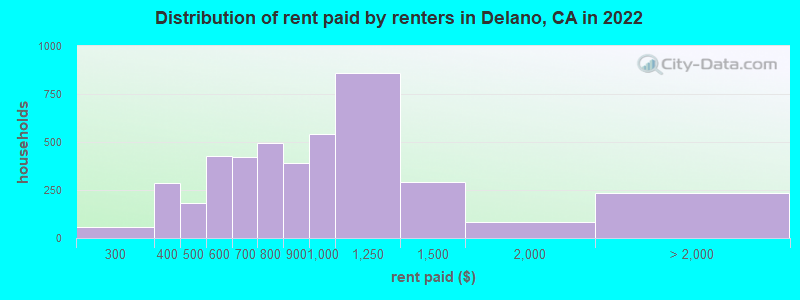
Rent paid by renters in 2022 in Delano, CA
-
- 57$250 to $299
- 39$300 to $349
- 245$350 to $399
- 88$400 to $449
- 94$450 to $499
- 130$500 to $549
- 297$550 to $599
- 73$600 to $649
- 350$650 to $699
- 315$700 to $749
- 181$750 to $799
- 389$800 to $899
- 542$900 to $999
- 861$1,000 to $1,249
- 289$1,250 to $1,499
- 84$1,500 to $1,999
- 44$2,000 to $2,499
- 35$3,000 to $3,499
- 151No cash rent
Percentage of workers working in this county: 86.5%
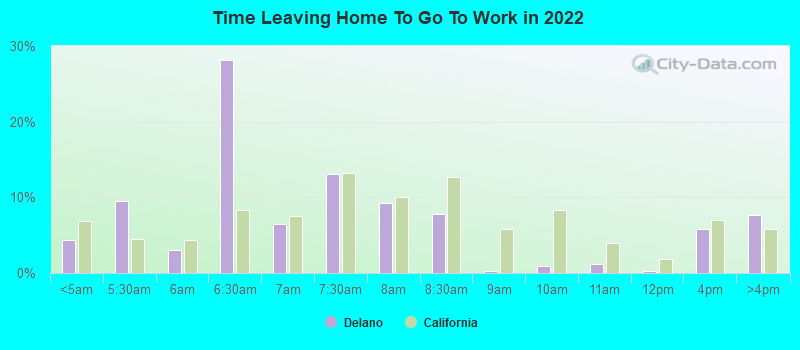
Number of people working at home: 450 (2.4% of all workers)
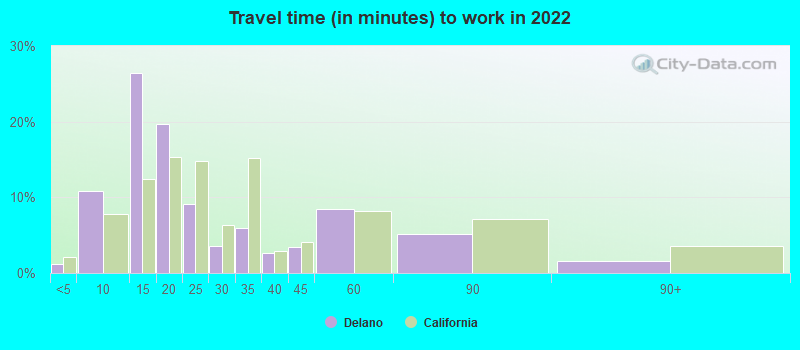
Travel time to work (commute)
- Less than 5 minutes: 201
- 5 to 9 minutes: 1,989
- 10 to 14 minutes: 5,500
- 15 to 19 minutes: 4,051
- 20 to 24 minutes: 1,966
- 25 to 29 minutes: 605
- 30 to 34 minutes: 1,267
- 35 to 39 minutes: 230
- 40 to 44 minutes: 808
- 45 to 59 minutes: 733
- 60 to 89 minutes: 418
- 90 or more minutes: 416
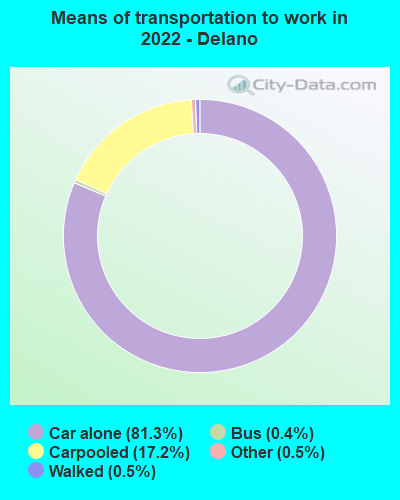
Means of transportation to work:
- Drove a car alone: 14,505 (78.8%)
- Carpooled: 3,059 (16.6%)
- Bus: 33 (0.2%)
- Taxi: 120 (0.7%)
- Bicycle: 8 (0.0%)
- Walked: 108 (0.6%)
- Worked at home: 450 (2.4%)
- Unemployment by race in 2022
- Unemployment rate for White non-Hispanic residents
- 5.7%Males
- 9.9%Females
- Unemployment rate for Black residents
- 7.9%Males
- 51.0%Females
- Unemployment rate for American Indian and Alaska Native residents
- 25.8%Males
- 49.6%Females
- Unemployment rate for Asian residents
- 10.0%Males
- 5.9%Females
- Unemployment rate for other race residents
- 10.5%Males
- 8.2%Females
- Unemployment rate for two or more race residents
- 8.0%Males
- 11.1%Females
- Unemployment rate for Hispanic or Latino residents
- 7.4%Males
- 8.0%Females
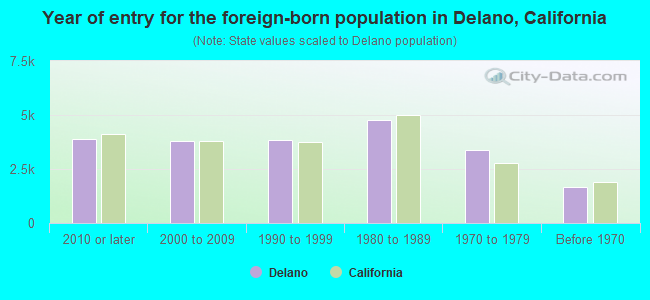
- Year of entry for the foreign-born population in Delano, California
- 3,8872010 or later
- 3,7782000 to 2009
- 3,8381990 to 1999
- 4,7911980 to 1989
- 3,3651970 to 1979
- 1,670Before 1970
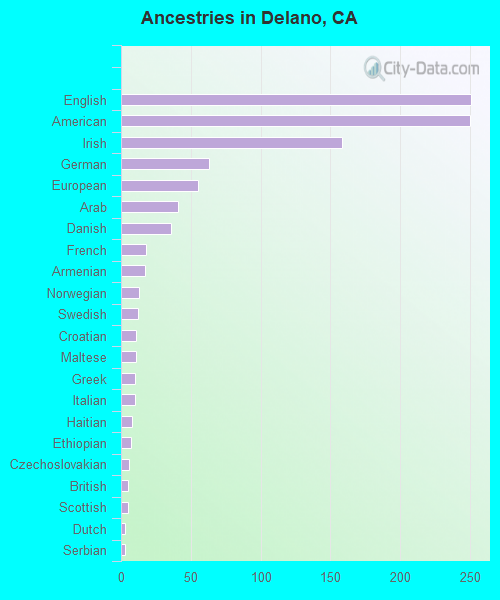
First ancestries reported:
- English: 251 (0.6%)
- American: 250 (0.6%)
- Irish: 158 (0.4%)
- German: 63 (0.2%)
- European: 55 (0.1%)
- Arab: 41 (0.1%)
- Danish: 36 (0.09%)
- French: 18 (0.05%)
- Armenian: 17 (0.04%)
- Norwegian: 13 (0.03%)
- Swedish: 12 (0.03%)
- Croatian: 11 (0.03%)
- Maltese: 11 (0.03%)
- Greek: 10 (0.03%)
- Italian: 10 (0.03%)
- Haitian: 8 (0.02%)
- Ethiopian: 7 (0.02%)
- Czechoslovakian: 6 (0.02%)
- British: 5 (0.01%)
- Scottish: 5 (0.01%)
- Dutch: 3 (0.01%)
- Serbian: 3 (0.01%)
- Afghan: 2 (0.01%)
- Scandinavian: 2 (0.01%)
- Scotch-Irish: 2 (0.01%)
Most common places of birth for foreign-born residents (%):
| Delano: | 68.5% (12,229) |
| California: | 37.2% (3,881,193) |
| Delano: | 22.9% (4,092) |
| California: | 7.8% (818,297) |
| Delano: | 2.4% (432) |
| California: | 4.9% (512,335) |
Place of birth for U.S.-born residents:
- This state: 30,003
- Other state: 2,373
- Northeast: 194
- Midwest: 222
- South: 891
- West: 1,140
96.4% of Delano residents lived in the same house 1 years ago.
Out of people who lived in different houses, 28.3% lived in this county.
Out of people who lived in different counties, 87.9% lived in California.
| Delano: | 96.4% |
| State average: | 88.9% |
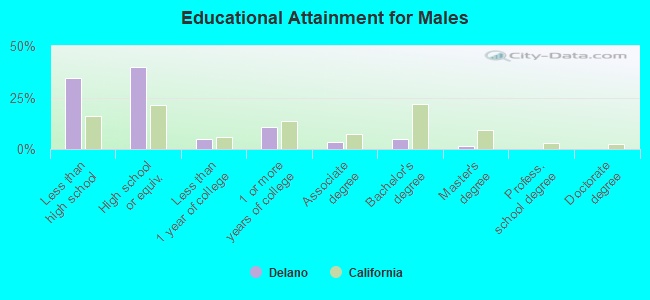
Education attainment for males 25 years and older:
- No schooling: 1,189
- Nursery to 4th grade: 773
- 5th and 6th grade: 932
- 7th and 8th grade: 702
- 9th grade: 434
- 10th grade: 875
- 11th grade: 904
- 12th grade, no diploma: 538
- High school graduate (or equivalency): 7,303
- Less than 1 year of college: 916
- Some college more than 1 year, no degree: 2,001
- Associate degree: 627
- Bachelor's degree: 923
- Master's degree: 257
- Professional school degree: 29
- Doctorate degree: 7
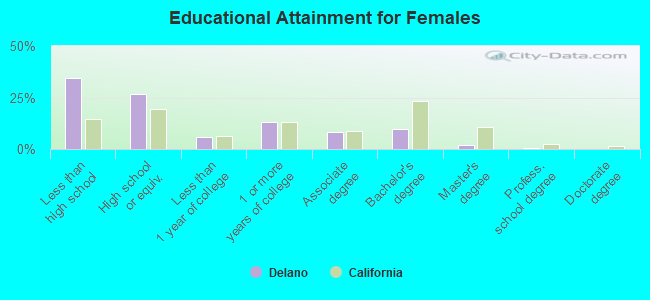
Education attainment for females 25 years and older:
- No schooling: 1,084
- Nursery to 4th grade: 667
- 5th and 6th grade: 1,274
- 7th and 8th grade: 413
- 9th grade: 233
- 10th grade: 241
- 11th grade: 254
- 12th grade, no diploma: 476
- High school graduate (or equivalency): 3,628
- Less than 1 year of college: 797
- Some college more than 1 year, no degree: 1,761
- Associate degree: 1,127
- Bachelor's degree: 1,322
- Master's degree: 232
- Professional school degree: 46
- Doctorate degree: 7
Housing units in structures:
- One, detached: 9,288
- One, attached: 119
- Two: 302
- 3 or 4: 703
- 5 to 9: 324
- 10 to 19: 175
- 20 to 49: 158
- 50 or more: 622
- Mobile homes: 531
Median worth of mobile homes: $58,295
Housing units lacking complete kitchen facilities in 2022: 1.1%
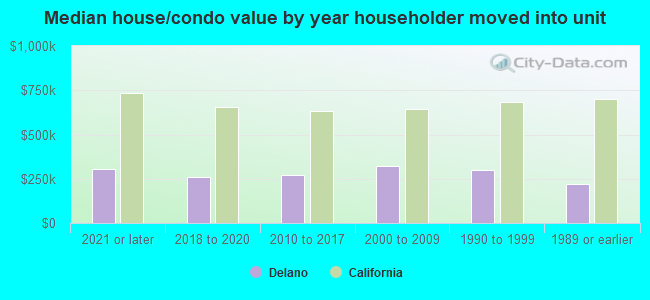
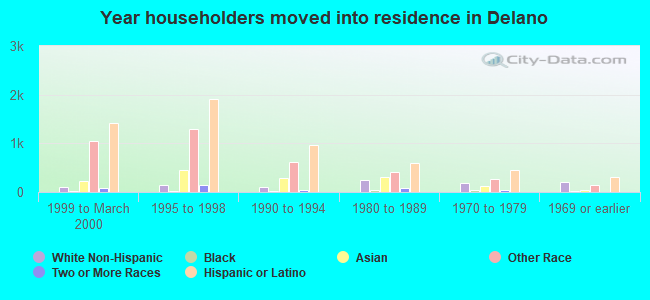
House/condo owner moved in on average 17 years ago
Renter moved in on average 5 years ago
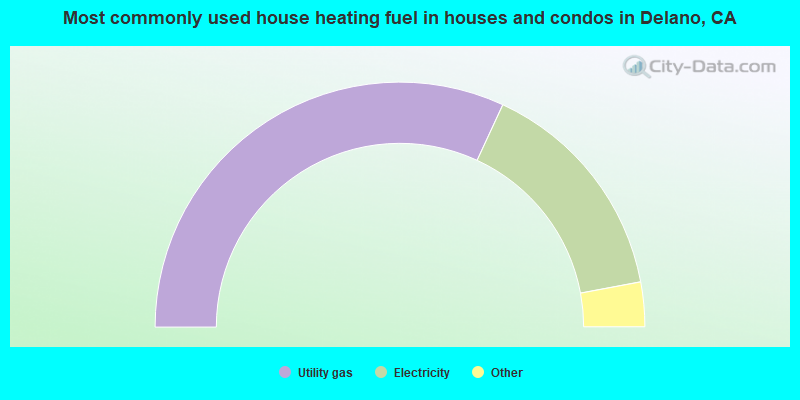
- 63.8%Utility gas
- 30.3%Electricity
- 2.8%No fuel used
- 1.8%Solar energy
- 1.4%Bottled, tank, or LP gas
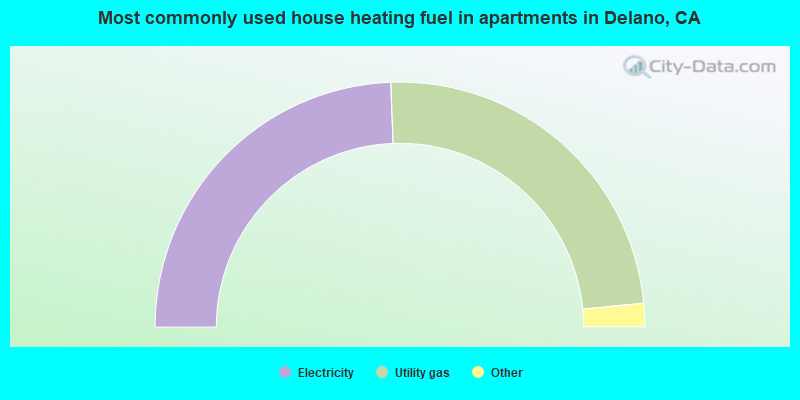
- 48.8%Electricity
- 48.1%Utility gas
- 2.2%No fuel used
- 0.7%Bottled, tank, or LP gas
- 0.2%Solar energy
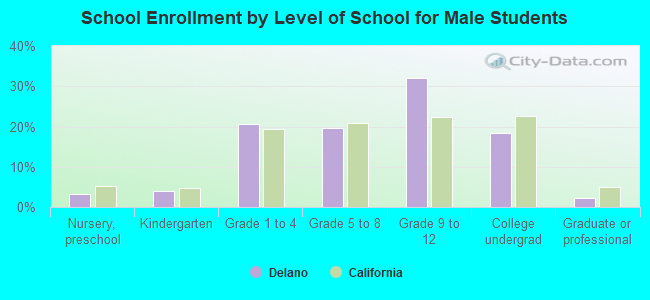
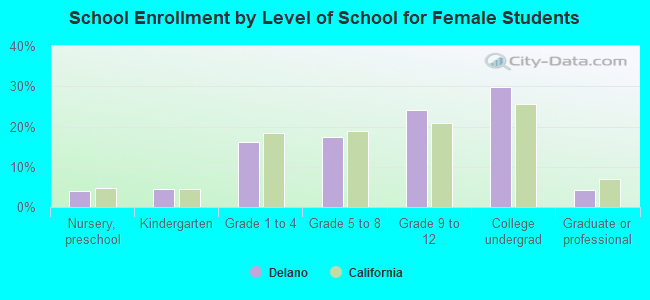
Private vs. public school enrollment:
| Here: | 2.5% |
| California: | 10.5% |
| Here: | 8.5% |
| California: | 8.5% |
| Here: | 18.5% |
| California: | 15.9% |