Deerfield, MA (Massachusetts) Houses and Residents
| Deerfield: | $378,243 |
| Massachusetts: | $534,700 |
Total population: 5,125 (Urban population: 1,125 (all inside urban clusters), Rural population: 3,625 (123 farm, 3,502 nonfarm))
Houses: 2,060 (1,965 occupied: 1,465 owner occupied, 500 renter occupied)
| % of renters here: | 25% |
| State: | 38% |
Housing density: 64 houses/condos per square mile
Median price asked for vacant for-sale houses and condos in 2022 in this county: $191,319.
Median contract rent in 2022: $945 (lower quartile is $557, upper quartile is $1,185)
Median rent asked for vacant for-rent units in 2022: $936
Median gross rent in Deerfield, MA in 2022: $1,049
Housing units in Deerfield with a mortgage: 829 (23 second mortgage, 155 home equity loan, 7 both second mortgage and home equity loan)
Houses without a mortgage: 472
Compare current foreclosures near Deerfield, MA:
| Photo | Address | Area | Beds / Baths | Price | Details |
|---|---|---|---|---|---|

|
#1
Lampblack Rd
Greenfield, MA 01301
|
2,078 sq. feet
|
1 baths 3 beds |
$369,900
|
show details |

|
#2
N Main St
Deerfield, MA 01342
|
- sq. feet
|
- baths - beds |
show details | |

|
#3
Route 2
Shelburne Falls, MA 01370
|
- sq. feet
|
3 baths 6 beds |
$229,900
|
show details |

|
#4
Sabans Rd
Conway, MA 01341
|
1,246 sq. feet
|
2 baths 3 beds |
show details | |

|
#5
J St
Turners Falls, MA 01376
|
3,256 sq. feet
|
2 baths 7 beds |
show details | |

|
#6
Sunderland Rd
South Deerfield, MA 01373
|
1,385 sq. feet
|
1 baths 3 beds |
show details | |

|
#7
Myrtle St # 1
Northampton, MA 01060
|
2,222 sq. feet
|
2 baths 4 beds |
show details | |

|
#8
Bridge St # 1
Hatfield, MA 01038
|
3,300 sq. feet
|
3 baths 4 beds |
show details | |

|
#9
Hillcrest Dr
Bernardston, MA 01337
|
1,120 sq. feet
|
1 baths 3 beds |
show details | |

|
#10
N Main St
South Deerfield, MA 01373
|
2,143 sq. feet
|
1 baths 5 beds |
show details |
| Photo | Address | Area | Beds / Baths | Price | Details |
|---|---|---|---|---|---|

|
#11
Meridian St
Greenfield, MA 01301
|
768 sq. feet
|
1 baths 2 beds |
show details | |

|
#12
Briggs Rd
Shutesbury, MA 01072
|
1,434 sq. feet
|
1 baths 3 beds |
show details | |

|
#13
Boyle Rd
Northfield, MA 01354
|
1,500 sq. feet
|
2 baths 3 beds |
show details | |

|
#14
Bald Mountain Rd
Bernardston, MA 01337
|
918 sq. feet
|
1 baths 2 beds |
show details | |

|
#15
Jacksonville Rd
Colrain, MA 01340
|
1,108 sq. feet
|
1 baths 2 beds |
show details | |

|
#16
Shays St # 1
Amherst, MA 01002
|
925 sq. feet
|
2 baths 3 beds |
show details | |

|
#17
Kosior Dr
Hadley, MA 01035
|
1,040 sq. feet
|
1 baths 2 beds |
show details | |

|
#18
Hawley Rd
Ashfield, MA 01330
|
1,008 sq. feet
|
1 baths 3 beds |
show details | |

|
#19
Wildflower Dr
Amherst, MA 01002
|
2,330 sq. feet
|
2 baths 4 beds |
show details | |

|
#20
S East St
Amherst, MA 01002
|
1,644 sq. feet
|
2 baths 3 beds |
show details |
| Photo | Address | Area | Beds / Baths | Price | Details |
|---|---|---|---|---|---|

|
#21
New Plain Rd
Northfield, MA 01360
|
2,370 sq. feet
|
2 baths 2 beds |
show details | |

|
#22
North St
Hatfield, MA 01038
|
1,900 sq. feet
|
1 baths 3 beds |
show details | |

|
#23
W Main St
New Salem, MA 01355
|
4,624 sq. feet
|
3 baths 6 beds |
show details | |

|
#24
Chesterfield Rd
Easthampton, MA 01027
|
3,977 sq. feet
|
2 baths 6 beds |
show details | |

|
#25
Brierwood Dr
Florence, MA 01062
|
960 sq. feet
|
1 baths 3 beds |
show details | |

|
#26
Cahillane Ter
Florence, MA 01062
|
1,388 sq. feet
|
1 baths 3 beds |
show details | |

|
#27
Cahillane Ter
Florence, MA 01062
|
1,388 sq. feet
|
1 baths 3 beds |
show details | |

|
#28
Bay Rd
Amherst, MA 01002
|
1,671 sq. feet
|
1 baths 4 beds |
show details | |

|
#29
Lake Mattawa Rd
Orange, MA 01364
|
1,666 sq. feet
|
1 baths 3 beds |
show details | |

|
#30
Main St
Northfield, MA 01360
|
6,076 sq. feet
|
2 baths 9 beds |
show details |
| Photo | Address | Area | Beds / Baths | Price | Details |
|---|---|---|---|---|---|

|
#31
Maynard St
Orange, MA 01364
|
1,640 sq. feet
|
2 baths 3 beds |
show details | |

|
#32
N Main St, Unit A
Orange, MA 01364
|
598 sq. feet
|
1 baths 2 beds |
show details | |

|
#33
Tea St
Charlemont, MA 01339
|
2,829 sq. feet
|
2 baths 6 beds |
show details | |

|
#34
E River St
Orange, MA 01364
|
1,332 sq. feet
|
1 baths 3 beds |
show details | |

|
#35
Eddy St
Orange, MA 01364
|
1,116 sq. feet
|
1 baths 2 beds |
show details | |

|
#36
Braeburn Rd
South Deerfield, MA 01373
|
1,661 sq. feet
|
1 baths 3 beds |
show details | |

|
#37
Aldrich St
Granby, MA 01033
|
624 sq. feet
|
1 baths 3 beds |
show details | |

|
#38
Grove St
Turners Falls, MA 01376
|
2,273 sq. feet
|
1 baths 4 beds |
show details | |

|
#39
5th St
Turners Falls, MA 01376
|
1,683 sq. feet
|
2 baths 4 beds |
show details | |

|
#40
Long Plain Rd
South Deerfield, MA 01373
|
1,909 sq. feet
|
2 baths 4 beds |
show details |
| Photo | Address | Area | Beds / Baths | Price | Details |
|---|---|---|---|---|---|

|
#41
Plumtree Rd
Sunderland, MA 01375
|
1,536 sq. feet
|
2 baths 2 beds |
show details | |

|
#42
Chapman St
Greenfield, MA 01301
|
1,472 sq. feet
|
1 baths 2 beds |
show details | |

|
#43
Dell St
Turners Falls, MA 01376
|
720 sq. feet
|
1 baths 1 beds |
show details | |

|
#44
Forest Ave
Greenfield, MA 01301
|
1,764 sq. feet
|
1 baths 4 beds |
show details | |

|
#45
Elm St
Greenfield, MA 01301
|
1,160 sq. feet
|
1 baths 3 beds |
show details | |

|
#46
Garfield St
Greenfield, MA 01301
|
2,260 sq. feet
|
2 baths 4 beds |
show details | |

|
#47
Central St
Turners Falls, MA 01376
|
1,506 sq. feet
|
1 baths 3 beds |
show details | |

|
#48
J Street
Montague, MA Array
|
3,255 sq. feet
|
2 baths 7 beds |
show details | |

|
#49
Chestnut St
West Hatfield, MA 01088
|
1,248 sq. feet
|
1 baths 3 beds |
show details | |

|
Check over 1 million property listings on Foreclosure.com!
|
browse all offers | |||

Latest news about housing in Deerfield, MA collected exclusively by city-data.com from local newspapers, TV, and radio stations

 | How Much Massachusetts Households Make Per Year: Census Data (37 replies) |
| 2024 Real Estate Observations (899 replies) |
| New Job in Springfield MA (Baystate) Housing Options (33 replies) |
| Tree House Brewing Cape Cod (42 replies) |
| Santarpio's vs. Regina's vs. Area Four (82 replies) |
| Photos of MA-please limit to photos & their discussion only, thanks. (672 replies) |

Household type by relationship:
Households: 69,891- In family households: 54,236 (12,210 male householders, 6,107 female householders)
13,655 spouses, 17,750 children (16,448 natural, 543 adopted, 759 stepchildren), 917 grandchildren, 418 brothers or sisters, 464 parents, foster children, 409 other relatives, 1,987 non-relatives
- In nonfamily households: 15,655 (5,446 male householders (3,978 living alone)), 6,699 female householders (5,318 living alone)), 3,510 nonrelatives
- In group quarters: 1,481 (665 institutionalized population)
11,122 married couples with children.
4,422 single-parent households (1,025 men, 3,397 women).
92.7% of residents of Deerfield speak English at home.
2.1% of residents speak Spanish at home (58% speak English very well, 15% speak English well, 27% speak English not well).
5.0% of residents speak other Indo-European language at home (77% speak English very well, 6% speak English well, 16% speak English not well).
0.2% of residents speak Asian or Pacific Island language at home (100% don't speak English at all).
Foreign born population: 392 (8.3%)
(58.2% of them are naturalized citizens)
| Here: | 6.4 |
| State: | 6.5 |
| Here: | 4.0 |
| State: | 4.0 |

- Bedrooms in owner-occupied houses and condos in Deerfield, Massachusetts
- 0no bedroom
- 71 bedroom
- 3322 bedrooms
- 6903 bedrooms
- 3724 bedrooms
- 645+ bedrooms

- Bedrooms in renter-occupied apartments in Deerfield, Massachusetts
- 18no bedroom
- 961 bedroom
- 2152 bedrooms
- 1283 bedrooms
- 254 bedrooms
- 185+ bedrooms

- Cars and other vehicles available in Deerfield in owner-occupied houses/condos
- 36no vehicle
- 4391 vehicle
- 7272 vehicles
- 1503 vehicles
- 984 vehicles
- 155+ vehicles

- Cars and other vehicles available in Deerfield in renter-occupied apartments
- 37no vehicle
- 2291 vehicle
- 1992 vehicles
- 193 vehicles
- 164 vehicles
- 05+ vehicles

- Rooms in owner-occupied houses in Deerfield, Massachusetts
- 01 room
- 02 rooms
- 203 rooms
- 894 rooms
- 3405 rooms
- 3466 rooms
- 2497 rooms
- 1978 rooms
- 2249+ rooms

- Rooms in renter-occupied apartments in Deerfield, Massachusetts
- 91 room
- 462 rooms
- 393 rooms
- 1684 rooms
- 705 rooms
- 1246 rooms
- 107 rooms
- 188 rooms
- 169+ rooms


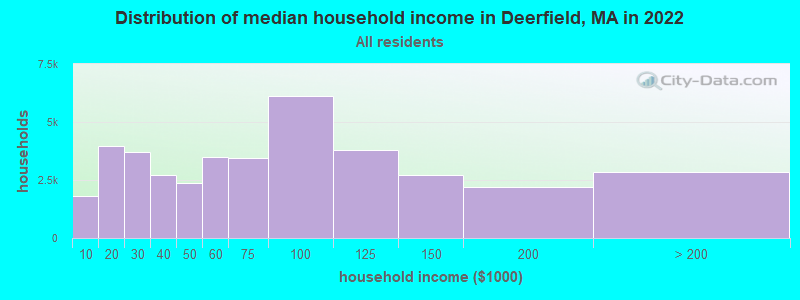
Deerfield, MA household income distribution

- 1,814Less than $10,000
- 3,977$10,000 to $19,999
- 3,723$20,000 to $29,999
- 2,717$30,000 to $39,999
- 2,380$40,000 to $49,999
- 3,476$50,000 to $59,999
- 3,447$60,000 to $74,999
- 6,139$75,000 to $99,999
- 3,783$100,000 to $124,999
- 2,729$125,000 to $149,999
- 2,194$150,000 to $199,999
- 2,856$200,000 or more
Percentage of workers working in this county: 58.0%
Number of people working at home: 549 (18.4% of all workers)
Travel time to work (commute)
- Less than 5 minutes: 112
- 5 to 9 minutes: 257
- 10 to 14 minutes: 377
- 15 to 19 minutes: 479
- 20 to 24 minutes: 531
- 25 to 29 minutes: 211
- 30 to 34 minutes: 196
- 35 to 39 minutes: 69
- 40 to 44 minutes: 95
- 45 to 59 minutes: 81
- 60 to 89 minutes: 49
- 90 or more minutes: 80
Means of transportation to work:
- Drove a car alone: 2,228 (85.3%)
- Carpooled: 178 (6.8%)
- Bus or trolley bus: 27 (1.0%)
- Motorcycle: 7 (0.3%)
- Bicycle: 19 (0.7%)
- Walked: 68 (2.6%)
- Other means: 10 (0.4%)
- Worked at home: 75 (2.9%)


- Year of entry for the foreign-born population in Deerfield, Massachusetts
- 561995 to March 2000
- 151990 to 1994
- 491985 to 1989
- 91980 to 1984
- 331975 to 1979
- 181970 to 1974
- 01965 to 1969
- 71Before 1965

First ancestries reported:
- Polish: 1,231 (20.5%)
- English: 910 (15.2%)
- Irish: 798 (13.3%)
- French: 572 (9.5%)
- Other: 445 (7.4%)
- German: 419 (7.0%)
- Italian: 327 (5.5%)
- Scottish: 206 (3.4%)
- Scotch-Irish: 188 (3.1%)
- French Canadian: 163 (2.7%)
- United States: 137 (2.3%)
- Russian: 101 (1.7%)
- Lithuanian: 89 (1.5%)
- Ukrainian: 74 (1.2%)
- Czech: 63 (1.1%)
- Swedish: 55 (0.9%)
- Norwegian: 42 (0.7%)
- Welsh: 41 (0.7%)
- Danish: 39 (0.7%)
- Dutch: 37 (0.6%)
- Portuguese: 23 (0.4%)
- Greek: 13 (0.2%)
- Swiss: 12 (0.2%)
- Slovak: 10 (0.2%)
Most common places of birth for foreign-born residents (%):
| Deerfield: | 19.1% (48) |
| Massachusetts: | 5.2% (40,247) |
| Deerfield: | 18.3% (46) |
| Massachusetts: | 5.1% (39,255) |
| Deerfield: | 11.6% (29) |
| Massachusetts: | 0.4% (3,066) |
| Deerfield: | 11.2% (28) |
| Massachusetts: | 1.8% (13,543) |
| Deerfield: | 9.6% (24) |
| Massachusetts: | 1.9% (14,883) |
| Deerfield: | 6.0% (15) |
| Massachusetts: | 3.7% (28,319) |
| Deerfield: | 4.4% (11) |
| Massachusetts: | 0.3% (1,943) |
| Deerfield: | 3.6% (9) |
| Massachusetts: | 3.3% (25,403) |
| Deerfield: | 3.6% (9) |
| Massachusetts: | 1.7% (13,456) |
| Deerfield: | 3.6% (9) |
| Massachusetts: | 0.5% (3,834) |
| Deerfield: | 3.2% (8) |
| Massachusetts: | 0.3% (2,470) |
| Deerfield: | 3.2% (8) |
| Massachusetts: | 0.1% (417) |
| Deerfield: | 2.8% (7) |
| Massachusetts: | 1.7% (12,975) |
Place of birth for U.S.-born residents:
- This state: 3,301
- Other state: 1,184
- Northeast: 692
- Midwest: 179
- South: 165
- West: 148
72% of Deerfield residents lived in the same house 5 years ago.
Out of people who lived in different houses, 67% lived in this county.
Out of people who lived in different counties, 57% lived in Massachusetts.
Education attainment for males 25 years and older:
- No schooling: 0
- Nursery to 4th grade: 10
- 5th and 6th grade: 12
- 7th and 8th grade: 11
- 9th grade: 11
- 10th grade: 42
- 11th grade: 42
- 12th grade, no diploma: 49
- High school graduate (or equivalency): 483
- Less than 1 year of college: 78
- Some college more than 1 year, no degree: 166
- Associate degree: 69
- Bachelor's degree: 400
- Master's degree: 184
- Professional school degree: 48
- Doctorate degree: 33

Education attainment for females 25 years and older:
- No schooling: 7
- Nursery to 4th grade: 6
- 5th and 6th grade: 0
- 7th and 8th grade: 31
- 9th grade: 28
- 10th grade: 30
- 11th grade: 22
- 12th grade, no diploma: 64
- High school graduate (or equivalency): 495
- Less than 1 year of college: 124
- Some college more than 1 year, no degree: 177
- Associate degree: 252
- Bachelor's degree: 286
- Master's degree: 195
- Professional school degree: 45
- Doctorate degree: 20


Housing units in structures:
- One, detached: 1,531
- One, attached: 132
- Two: 256
- 3 or 4: 92
- 5 to 9: 21
- 10 to 19: 28
Housing units lacking complete kitchen facilities: 1.5%

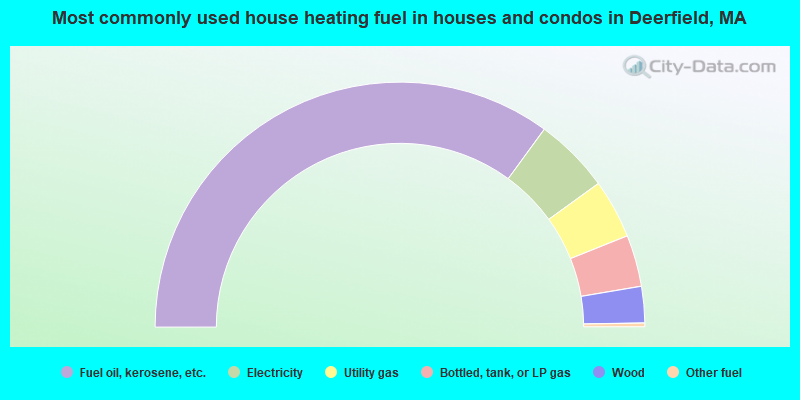
- 70.0%Fuel oil, kerosene, etc.
- 10.0%Electricity
- 7.8%Utility gas
- 6.8%Bottled, tank, or LP gas
- 4.8%Wood
- 0.5%Other fuel
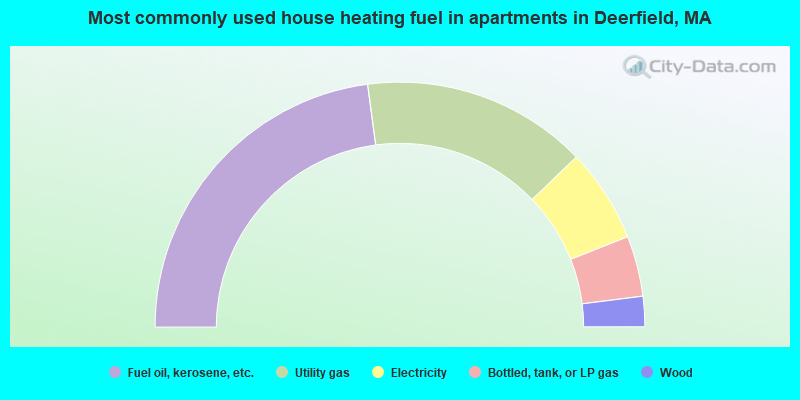
- 45.8%Fuel oil, kerosene, etc.
- 29.8%Utility gas
- 12.4%Electricity
- 8.0%Bottled, tank, or LP gas
- 4.0%Wood
Private vs. public school enrollment:
| Here: | 11.5% |
| Massachusetts: | 10.8% |
| Here: | 5.9% |
| Massachusetts: | 12.2% |
| Here: | 6.5% |
| Massachusetts: | 48.2% |


