Housing density: 144 houses/condos per square mile
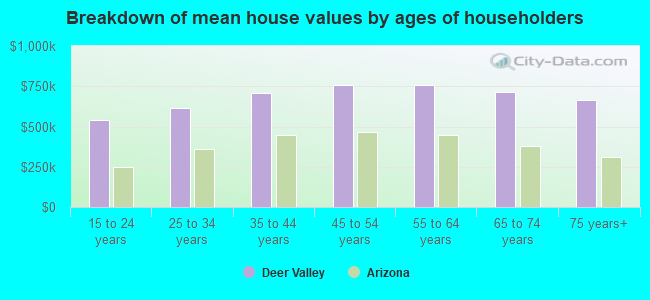
Median price asked for vacant for-sale houses and condos in 2022 in this county: $468,533.
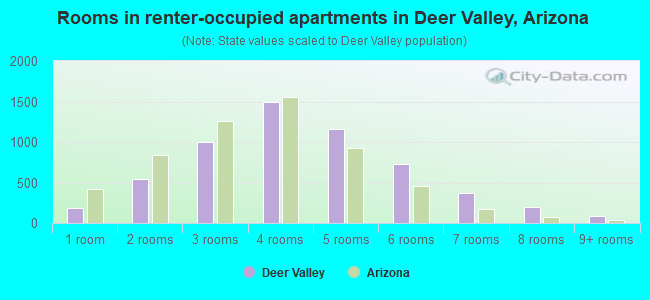
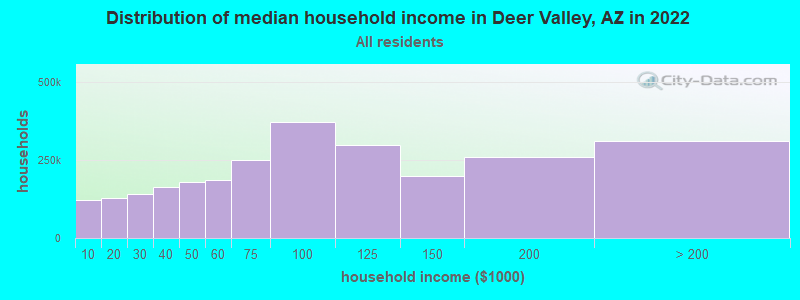
Median contract rent in 2022: over $2,000 (lower quartile is $1,619, upper quartile is over $2,000)
Median rent asked for vacant for-rent units in 2022: $2,184
Median gross rent in Deer Valley, AZ in 2022: over $2,000
Housing units in Deer Valley with a mortgage: 38,245 (5,351 second mortgage, 4,651 home equity loan, 166 both second mortgage and home equity loan) Houses without a mortgage: 6,119
Compare current foreclosures near Deer Valley, AZ:
In family households: 3,138,026 (650,440 male householders, 282,374 female householders)
675,057 spouses, 1,144,635 children (1,062,824 natural, 25,811 adopted, 56,000 stepchildren), 89,562 grandchildren, 49,169 brothers or sisters, 41,379 parents, foster children, 65,445 other relatives, 109,833 non-relatives
In nonfamily households: 625,914 (233,548 male householders (166,796 living alone)), 245,221 female householders (198,416 living alone)), 147,145 nonrelatives
In group quarters: 53,177 (28,412 institutionalized population)
544,876 married couples with children.
186,752 single-parent households (51,395 men, 135,357 women).
90.4% of residents of Deer Valley speak English at home.
4.9% of residents speak Spanish at home (71% speak English very well, 12% speak English well, 14% speak English not well, 2% don't speak English at all).
3.0% of residents speak other Indo-European language at home (76% speak English very well, 19% speak English well, 5% speak English not well).
1.3% of residents speak Asian or Pacific Island language at home (64% speak English very well, 25% speak English well, 10% speak English not well, 1% don't speak English at all).
0.4% of residents speak other language at home (73% speak English very well, 25% speak English well, 2% speak English not well).
Foreign born population: 13,010 (5.9%)
(96.1% of them are naturalized citizens)
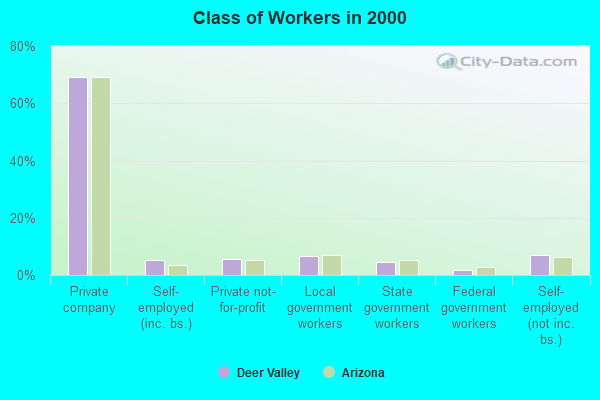
Percentage of workers working in this county: 98.0% Number of people working at home: 26,206 (22.2% of all workers)
Travel time to work (commute)
Less than 5 minutes: 863
5 to 9 minutes: 4,252
10 to 14 minutes: 7,082
15 to 19 minutes: 8,764
20 to 24 minutes: 8,559
25 to 29 minutes: 4,232
30 to 34 minutes: 9,671
35 to 39 minutes: 3,006
40 to 44 minutes: 4,632
45 to 59 minutes: 11,226
60 to 89 minutes: 5,694
90 or more minutes: 1,447
Means of transportation to work:
Drove a car alone: 60,189 (81.6%)
Carpooled: 7,524 (10.2%)
Bus or trolley bus: 242 (0.3%)
Subway or elevated: 5 (0.0%)
Railroad: 8 (0.0%)
Taxi: 13 (0.0%)
Motorcycle: 321 (0.4%)
Bicycle: 196 (0.3%)
Walked: 525 (0.7%)
Other means: 405 (0.5%)
Worked at home: 4,317 (5.9%)
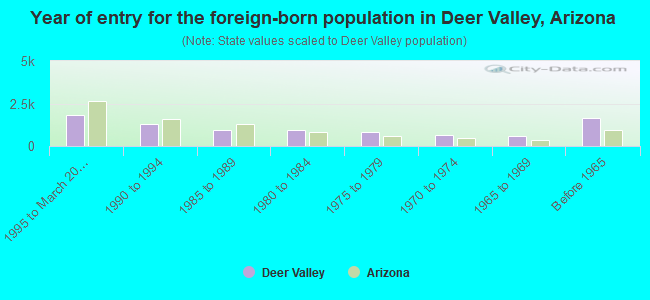
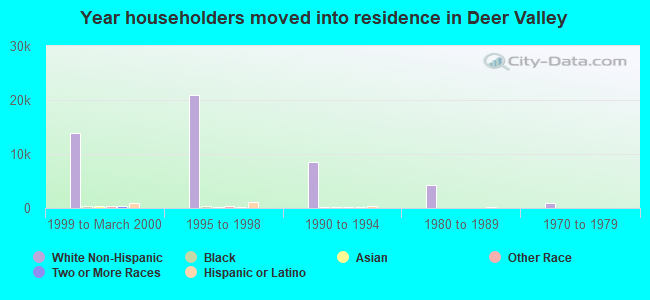
Year of entry for the foreign-born population in Deer Valley, Arizona
1,8201995 to March 2000
1,3171990 to 1994
9601985 to 1989
9361980 to 1984
8181975 to 1979
6231970 to 1974
5681965 to 1969
1,651Before 1965
Most common places of birth for foreign-born residents (%):
Mexico
Deer Valley:
14.3% (1,243)
Arizona:
66.4% (436,022)
Canada
Deer Valley:
11.3% (984)
Arizona:
4.0% (26,323)
United Kingdom
Deer Valley:
9.7% (845)
Arizona:
2.2% (14,655)
Romania
Deer Valley:
6.5% (568)
Arizona:
0.5% (3,398)
Germany
Deer Valley:
5.9% (514)
Arizona:
2.4% (15,868)
Philippines
Deer Valley:
5.1% (443)
Arizona:
1.8% (11,916)
India
Deer Valley:
2.9% (254)
Arizona:
1.4% (9,134)
Vietnam
Deer Valley:
2.7% (236)
Arizona:
1.5% (10,127)
Italy
Deer Valley:
2.4% (210)
Arizona:
0.6% (4,143)
Korea
Deer Valley:
2.4% (205)
Arizona:
1.2% (8,075)
China, excluding Hong Kong and Taiwan
Deer Valley:
1.6% (139)
Arizona:
1.2% (8,140)
Austria
Deer Valley:
1.5% (134)
Arizona:
0.2% (1,118)
Poland
Deer Valley:
1.5% (134)
Arizona:
0.5% (3,420)
Place of birth for U.S.-born residents:
This state: 44,554
Other state: 93,925
Northeast: 18,635
Midwest: 39,225
South: 12,980
West: 23,085
34% of Deer Valley residents lived in the same house 5 years ago. Out of people who lived in different houses, 62% lived in this county. Out of people who lived in different counties, 9% lived in Arizona.
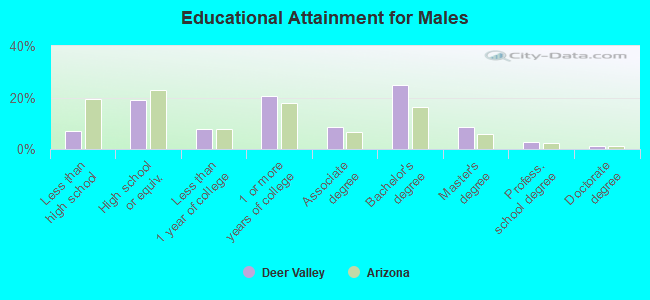
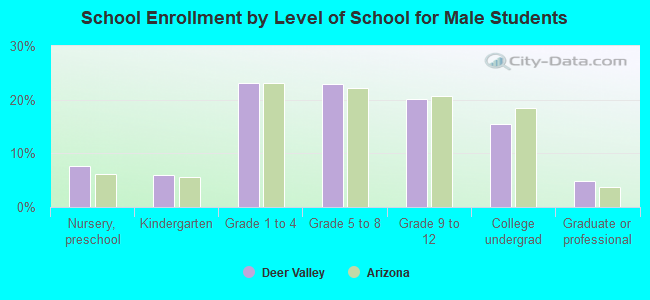
Education attainment for males 25 years and older:
No schooling: 78
Nursery to 4th grade: 46
5th and 6th grade: 222
7th and 8th grade: 437
9th grade: 378
10th grade: 600
11th grade: 557
12th grade, no diploma: 1,085
High school graduate (or equivalency): 9,346
Less than 1 year of college: 3,913
Some college more than 1 year, no degree: 10,213
Associate degree: 4,253
Bachelor's degree: 12,243
Master's degree: 4,139
Professional school degree: 1,359
Doctorate degree: 629
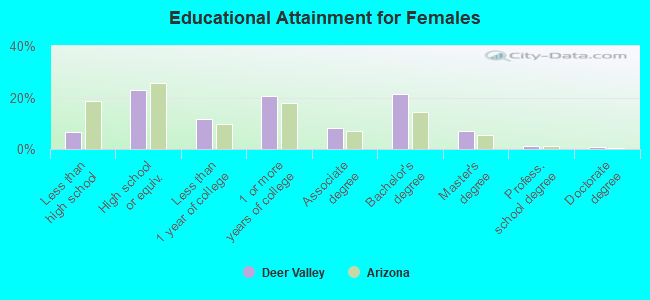
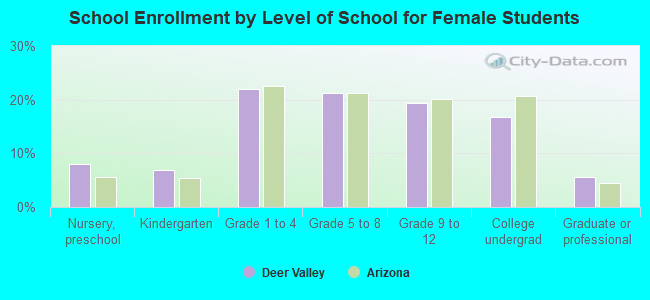
Education attainment for females 25 years and older:
No schooling: 55
Nursery to 4th grade: 54
5th and 6th grade: 161
7th and 8th grade: 547
9th grade: 256
10th grade: 570
11th grade: 596
12th grade, no diploma: 1,190
High school graduate (or equivalency): 11,694
Less than 1 year of college: 5,859
Some college more than 1 year, no degree: 10,458
Associate degree: 4,195
Bachelor's degree: 10,837
Master's degree: 3,645
Professional school degree: 590
Doctorate degree: 343
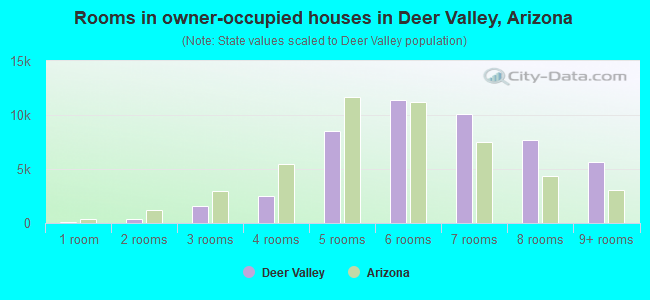
Housing units in structures:
One, detached: 49,998
One, attached: 1,963
Two: 111
3 or 4: 407
5 to 9: 830
10 to 19: 1,023
20 to 49: 386
50 or more: 1,512
Mobile homes: 1,941
Boats, RVs, vans, etc.: 538
Median worth of mobile homes: $114,986
Housing units lacking complete plumbing facilities: 0.5%
Housing units lacking complete kitchen facilities: 0.4%