Dayton, TN (Tennessee) Houses and Residents
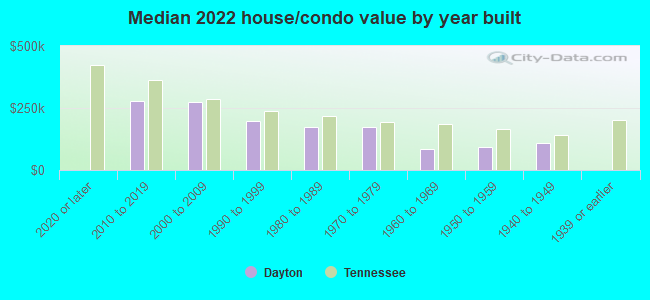
| Dayton: | $160,622 |
| Tennessee: | $284,800 |
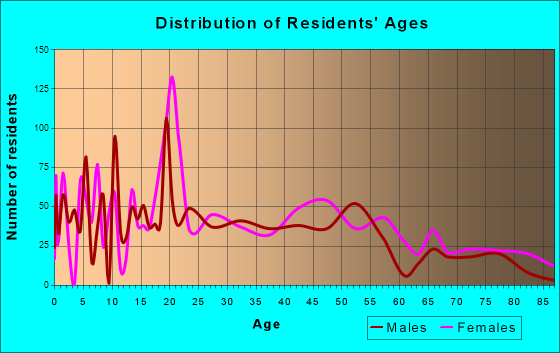
Total population: 7,395 (Urban population: 6,110 (all inside urban clusters), Rural population: 108 (all nonfarm))
Houses: 3,108 (2,673 occupied: 1,429 owner occupied, 1,291 renter occupied)
| % of renters here: | 47% |
| State: | 33% |
Housing density: 507 houses/condos per square mile
Median price asked for vacant for-sale houses and condos in 2022: $390,493.
Median contract rent in 2022: $578 (lower quartile is $426, upper quartile is $749)
Median rent asked for vacant for-rent units in 2022: $742
Median gross rent in Dayton, TN in 2022: $787
Housing units in Dayton with a mortgage: 734 (38 second mortgage, 0 home equity loan, 38 both second mortgage and home equity loan)
Houses without a mortgage: 0
Median household income for houses/condos with a mortgage: $69,030
Median household income for apartments without a mortgage: $54,124
Median monthly housing costs: $753
Compare current foreclosures in Dayton, TN:
| Photo | Address | Area | Beds / Baths | Price | Details |
|---|---|---|---|---|---|

|
#1
Sexton Ln # 50
Dayton, TN 37321
|
885 sq. feet
|
2 baths 3 beds |
show details | |

|
#2
Sussex Rd
Dayton, TN 37321
|
- sq. feet
|
2 baths 3 beds |
show details | |

|
#3
Blythe Ferry Rd
Dayton, TN 37321
|
1,176 sq. feet
|
1 baths - beds |
show details | |

|
#4
Armstrong Ferry Rd
Dayton, TN 37321
|
1,232 sq. feet
|
2 baths - beds |
show details | |

|
#5
Dayton Mountain Hwy
Dayton, TN 37321
|
1,562 sq. feet
|
2 baths - beds |
show details | |

|
#6
9th Ave
Dayton, TN 37321
|
1,392 sq. feet
|
1 baths - beds |
show details | |

|
#7
Cottonport Rd
Dayton, TN 37321
|
1,440 sq. feet
|
2 baths - beds |
show details | |

|
#8
Shady Lane Rd
Dayton, TN 37321
|
1,776 sq. feet
|
2 baths - beds |
show details | |

|
#9
Howard Ln
Dayton, TN 37321
|
1,639 sq. feet
|
2 baths - beds |
show details | |

|
#10
Boyd St
Dayton, TN 37321
|
1,850 sq. feet
|
2 baths - beds |
show details |
| Photo | Address | Area | Beds / Baths | Price | Details |
|---|---|---|---|---|---|

|
#11
14th Ave
Dayton, TN 37321
|
1,176 sq. feet
|
1 baths - beds |
show details | |

|
#12
Troy Dr
Dayton, TN 37321
|
1,300 sq. feet
|
2 baths - beds |
show details | |

|
#13
Fraley Rd
Dayton, TN 37321
|
828 sq. feet
|
1 baths - beds |
show details | |

|
#14
Polk Ave
Dayton, TN 37321
|
1,316 sq. feet
|
2 baths - beds |
show details | |

|
#15
White Oak Rd
Dayton, TN 37321
|
1,254 sq. feet
|
1 baths - beds |
show details | |

|
#16
Belmont Farms Rd
Dayton, TN 37321
|
1,120 sq. feet
|
1 baths - beds |
show details | |

|
#17
Richland St
Dayton, TN 37321
|
1,025 sq. feet
|
2 baths - beds |
show details | |

|
#18
Orchid Ave
Dayton, TN 37321
|
1,080 sq. feet
|
1 baths - beds |
show details | |

|
#19
Shaver Loop Rd
Dayton, TN 37321
|
1,056 sq. feet
|
1 baths - beds |
show details | |

|
#20
Cranmore Cove Rd
Dayton, TN 37321
|
1,078 sq. feet
|
1 baths - beds |
show details |
| Photo | Address | Area | Beds / Baths | Price | Details |
|---|---|---|---|---|---|

|
#21
11th Ave
Dayton, TN 37321
|
1,444 sq. feet
|
1 baths - beds |
show details | |

|
#22
Hurst Ln
Dayton, TN 37321
|
1,406 sq. feet
|
2 baths - beds |
show details | |

|
#23
Azalea Ave
Dayton, TN 37321
|
1,026 sq. feet
|
1 baths - beds |
show details | |

|
#24
Old Washington Hwy
Dayton, TN 37321
|
1,650 sq. feet
|
1 baths - beds |
show details | |

|
#25
Sydney Ln
Dayton, TN 37321
|
1,441 sq. feet
|
2 baths - beds |
show details | |

|
#26
Orchid Ave
Dayton, TN 37321
|
1,075 sq. feet
|
1 baths - beds |
show details | |

|
#27
Oak St
Dayton, TN 37321
|
1,026 sq. feet
|
1 baths - beds |
show details | |

|
#28
Holden Rd
Dayton, TN 37321
|
1,204 sq. feet
|
2 baths - beds |
show details | |

|
#29
Gordon Ln
Dayton, TN 37321
|
1,737 sq. feet
|
2 baths - beds |
show details | |

|
#30
Athel Ln
Dayton, TN 37321
|
1,352 sq. feet
|
2 baths - beds |
show details |
| Photo | Address | Area | Beds / Baths | Price | Details |
|---|---|---|---|---|---|

|
#31
Denton Ln
Dayton, TN 37321
|
1,568 sq. feet
|
2 baths - beds |
show details | |

|
#32
Pine Crest Rd
Dayton, TN 37321
|
- sq. feet
|
- baths - beds |
show details | |

|
#33
Corvin Meadows Ln Lot 26a
Dayton, TN 37321
|
- sq. feet
|
- baths - beds |
show details | |

|
#34
Memorial Ave # 1
Dayton, TN 37321
|
- sq. feet
|
- baths - beds |
show details | |

|
#35
Brookstone Ct # 2
Dayton, TN 37321
|
- sq. feet
|
- baths - beds |
show details | |

|
#36
Nicole Dr
Dayton, TN 37321
|
- sq. feet
|
- baths - beds |
show details | |

|
#37
Sydney Ln
Dayton, TN 37321
|
- sq. feet
|
- baths - beds |
show details | |

|
#38
Pine View Rd
Dayton, TN 37321
|
- sq. feet
|
- baths - beds |
show details | |

|
#39
Housing St Apt 4
Dayton, TN 37321
|
- sq. feet
|
- baths - beds |
show details | |

|
#40
Illinois Ave Apt 2
Dayton, TN 37321
|
- sq. feet
|
- baths - beds |
show details |
| Photo | Address | Area | Beds / Baths | Price | Details |
|---|---|---|---|---|---|

|
#41
Morgan Creek Rd
Dayton, TN 37321
|
728 sq. feet
|
- baths - beds |
show details | |

|
#42
Market St Apt 15
Dayton, TN 37321
|
- sq. feet
|
- baths - beds |
show details | |

|
#43
Rodeo Dr
Dayton, TN 37321
|
- sq. feet
|
- baths - beds |
show details | |

|
#44
Old Pikeville Rd
Dayton, TN 37321
|
- sq. feet
|
- baths - beds |
show details | |

|
#45
2nd Ave Apt 4
Dayton, TN 37321
|
- sq. feet
|
- baths - beds |
show details | |

|
#46
Railroad St
Dayton, TN 37321
|
- sq. feet
|
- baths - beds |
show details | |

|
#47
Church St Apt 1
Dayton, TN 37321
|
- sq. feet
|
- baths - beds |
show details | |

|
#48
Shaver Loop Rd
Dayton, TN 37321
|
- sq. feet
|
- baths - beds |
show details | |

|
#49
Oak St
Dayton, TN 37321
|
- sq. feet
|
- baths - beds |
show details | |

|
Check over 1 million property listings on Foreclosure.com!
|
browse all offers | |||

Latest news about housing in Dayton, TN collected exclusively by city-data.com from local newspapers, TV, and radio stations

 | DAYTON TN - Wanting House to Rent (0 replies) |
| Low Cost Rural Housing? (3 replies) |
| Where to buy a house with acreage/forest in eastern TN? (7 replies) |
| How close to town can you have a decent mobile home? (2 replies) |
| Need advice on small towns in NE Tennessee (3 replies) |
| Walden Ridge (Pikeville area) questions (2 replies) |
Median year apartment built: 1988
Household type by relationship:
Households: 7,270- Male householders: 865 (205 living alone), Female householders: 1,776 (294 living alone)
1,194 spouses (1,194 opposite-sex spouses), 154 unmarried partners, (154 opposite-sex unmarried partners), 1,917 children (1,853 natural, 14 adopted, 49 stepchildren), 404 grandchildren, 40 brothers or sisters, 1 parents, 0 foster children, 103 other relatives, 273 non-relatives
- In group quarters: 537
Size of family households: 849 2-persons, 598 3-persons, 386 4-persons, 169 5-persons, 63 6-persons.
Size of nonfamily households: 508 1-person, 112 2-persons, 38 4-persons.
671 married couples with children.
430 single-parent households (0 men, 430 women).
91.0% of residents of Dayton speak English at home.
7.3% of residents speak Spanish at home (17% speak English very well, 30% speak English well, 16% speak English not well, 37% don't speak English at all).
2.0% of residents speak other Indo-European language at home (20% speak English very well, 80% speak English well).
0.2% of residents speak Asian or Pacific Island language at home (100% speak English not well).
Foreign born population: 564 (7.8%)
(19.5% of them are naturalized citizens)
| Here: | 6.2 |
| State: | 6.5 |
| Here: | 4.4 |
| State: | 4.4 |
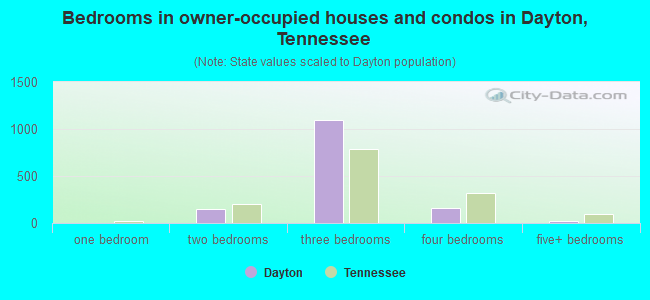
- Bedrooms in owner-occupied houses and condos in Dayton, Tennessee
- 0no bedroom
- 01 bedroom
- 1532 bedrooms
- 1,0963 bedrooms
- 1594 bedrooms
- 215+ bedrooms
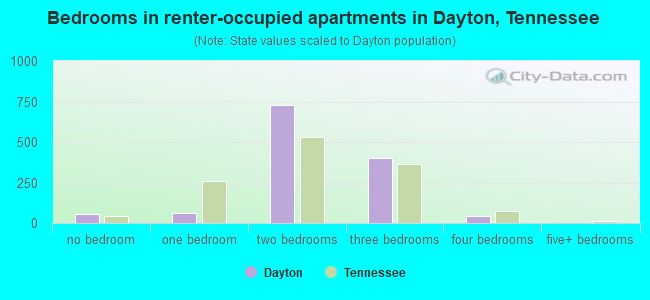
- Bedrooms in renter-occupied apartments in Dayton, Tennessee
- 57no bedroom
- 611 bedroom
- 7302 bedrooms
- 4033 bedrooms
- 414 bedrooms
- 05+ bedrooms
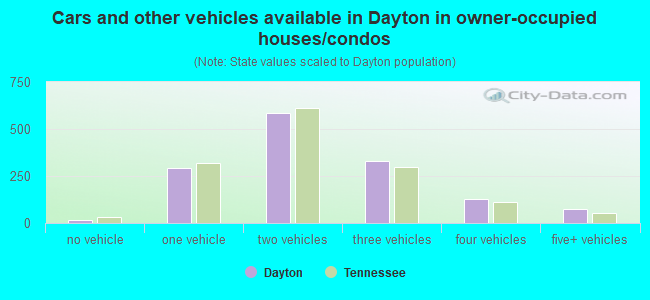
- Cars and other vehicles available in Dayton in owner-occupied houses/condos
- 14no vehicle
- 2921 vehicle
- 5872 vehicles
- 3303 vehicles
- 1304 vehicles
- 775+ vehicles
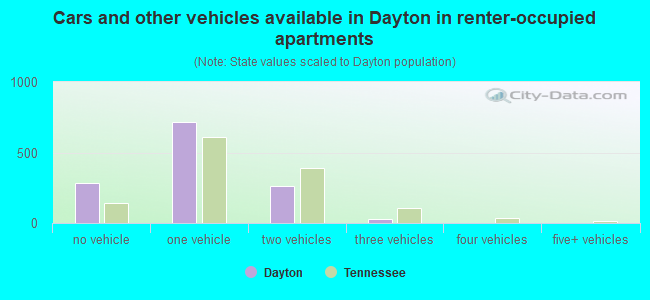
- Cars and other vehicles available in Dayton in renter-occupied apartments
- 287no vehicle
- 7181 vehicle
- 2592 vehicles
- 273 vehicles
- 04 vehicles
- 05+ vehicles
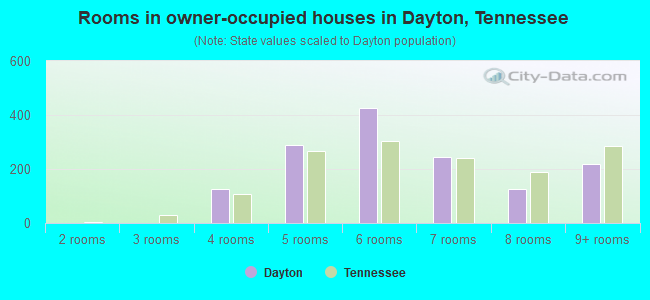
- Rooms in owner-occupied houses in Dayton, Tennessee
- 01 room
- 02 rooms
- 03 rooms
- 1274 rooms
- 2885 rooms
- 4266 rooms
- 2447 rooms
- 1268 rooms
- 2189+ rooms
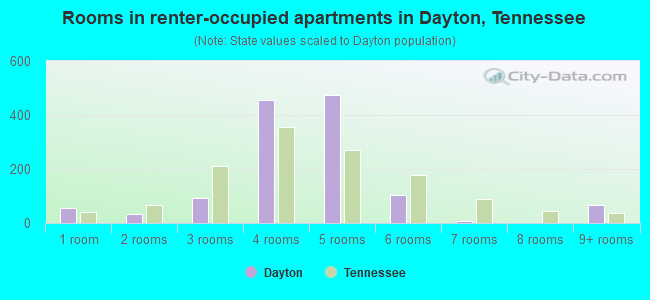
- Rooms in renter-occupied apartments in Dayton, Tennessee
- 571 room
- 332 rooms
- 933 rooms
- 4574 rooms
- 4755 rooms
- 1036 rooms
- 87 rooms
- 08 rooms
- 659+ rooms
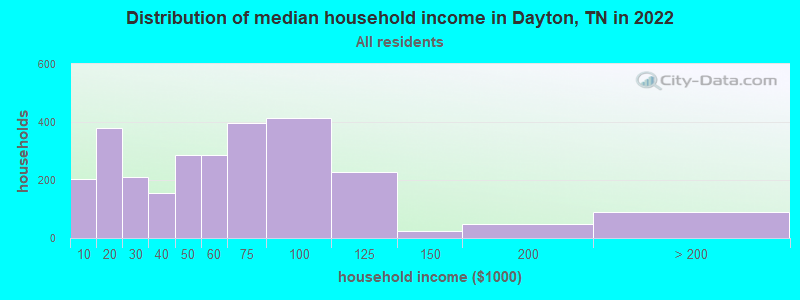
Dayton, TN household income distribution

- 202Less than $10,000
- 378$10,000 to $19,999
- 210$20,000 to $29,999
- 156$30,000 to $39,999
- 286$40,000 to $49,999
- 287$50,000 to $59,999
- 397$60,000 to $74,999
- 413$75,000 to $99,999
- 228$100,000 to $124,999
- 25$125,000 to $149,999
- 48$150,000 to $199,999
- 89$200,000 or more
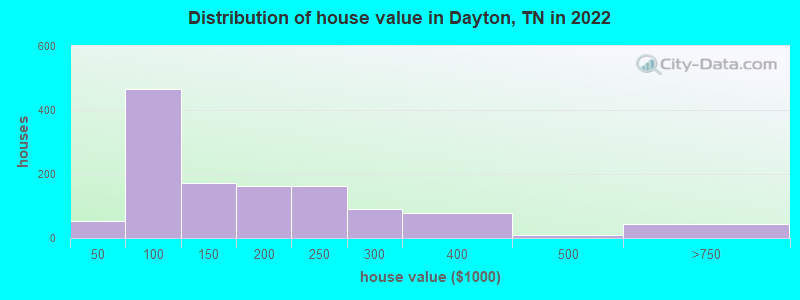
Home value of owner - occupied houses in 2022 in Dayton, TN
-
- 12Less than $10,000
- 41$40,000 to $49,999
- 5$50,000 to $59,999
- 149$60,000 to $69,999
- 175$70,000 to $79,999
- 47$80,000 to $89,999
- 47$90,000 to $99,999
- 75$100,000 to $124,999
- 97$125,000 to $149,999
- 96$150,000 to $174,999
- 64$175,000 to $199,999
- 164$200,000 to $249,999
- 91$250,000 to $299,999
- 76$300,000 to $399,999
- 8$400,000 to $499,999
- 45$500,000 to $749,999
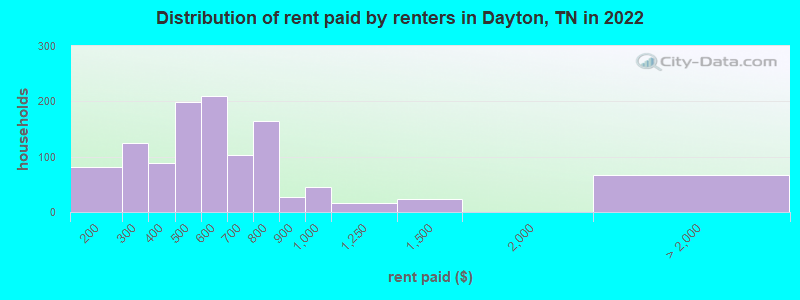
Rent paid by renters in 2022 in Dayton, TN
-
- 37$100 to $149
- 43$150 to $199
- 81$200 to $249
- 43$250 to $299
- 89$300 to $349
- 84$400 to $449
- 114$450 to $499
- 101$500 to $549
- 108$550 to $599
- 18$600 to $649
- 84$650 to $699
- 103$700 to $749
- 60$750 to $799
- 27$800 to $899
- 45$900 to $999
- 17$1,000 to $1,249
- 23$1,250 to $1,499
- 65No cash rent
Percentage of workers working in this county: 79.1%
Number of people working at home: 105 (3.5% of all workers)
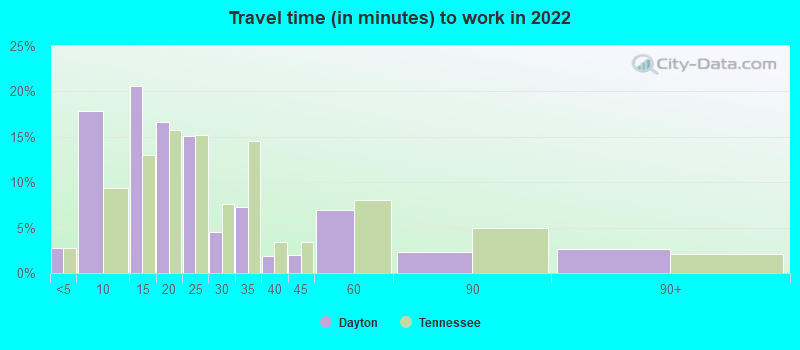
Travel time to work (commute)
- Less than 5 minutes: 182
- 5 to 9 minutes: 884
- 10 to 14 minutes: 618
- 15 to 19 minutes: 250
- 20 to 24 minutes: 320
- 25 to 29 minutes: 23
- 30 to 34 minutes: 86
- 35 to 39 minutes: 93
- 40 to 44 minutes: 69
- 45 to 59 minutes: 173
- 60 to 89 minutes: 104
- 90 or more minutes: 24
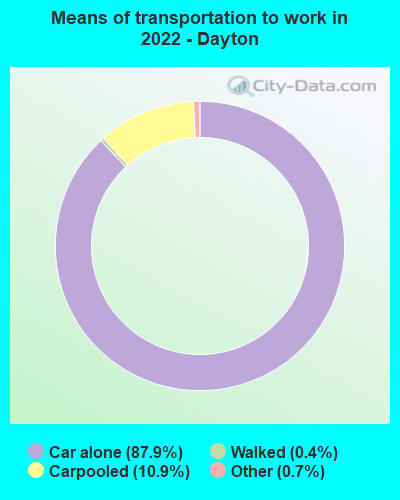
Means of transportation to work:
- Drove a car alone: 6,422 (82.9%)
- Carpooled: 842 (10.9%)
- Taxi: 67 (0.9%)
- Walked: 33 (0.4%)
- Worked at home: 105 (1.4%)
- Unemployment by race in 2022
- Unemployment rate for White non-Hispanic residents
- 1.0%Males
- 8.8%Females
- Unemployment rate for Black residents
- 2.1%Males
- Unemployment rate for two or more race residents
- 16.2%Males
- 22.7%Females
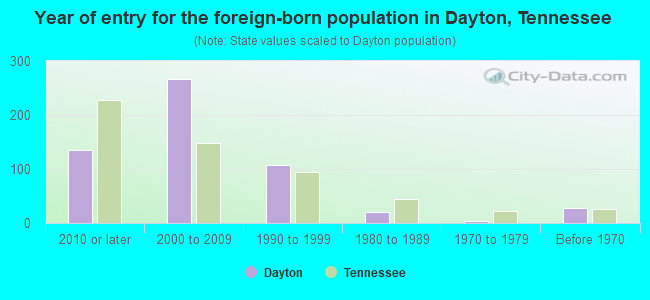
- Year of entry for the foreign-born population in Dayton, Tennessee
- 1352010 or later
- 2672000 to 2009
- 1081990 to 1999
- 211980 to 1989
- 41970 to 1979
- 28Before 1970
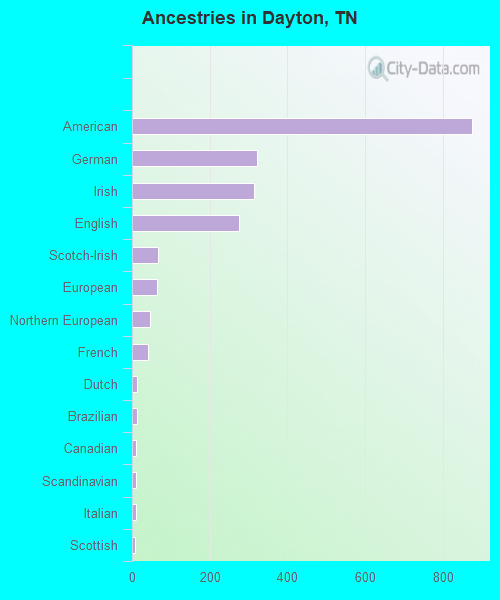
First ancestries reported:
- American: 875 (26.0%)
- German: 321 (9.5%)
- Irish: 315 (9.4%)
- English: 276 (8.2%)
- Scotch-Irish: 68 (2.0%)
- European: 64 (1.9%)
- Northern European: 46 (1.4%)
- French: 41 (1.2%)
- Dutch: 14 (0.4%)
- Brazilian: 13 (0.4%)
- Canadian: 11 (0.3%)
- Scandinavian: 11 (0.3%)
- Italian: 10 (0.3%)
- Scottish: 9 (0.3%)
- French Canadian: 7 (0.2%)
- Swiss: 5 (0.1%)
- Slovak: 3 (0.09%)
- British: 2 (0.06%)
Most common places of birth for foreign-born residents (%):
| Dayton: | 36.2% (204) |
| Tennessee: | 23.0% (86,435) |
| Dayton: | 18.4% (104) |
| Tennessee: | 5.7% (21,286) |
| Dayton: | 9.2% (52) |
| Tennessee: | 0.2% (820) |
| Dayton: | 8.7% (49) |
| Tennessee: | 6.1% (23,079) |
| Dayton: | 4.6% (26) |
| Tennessee: | 0.8% (3,098) |
| Dayton: | 4.3% (24) |
| Tennessee: | 0.4% (1,671) |
| Dayton: | 4.3% (24) |
| Tennessee: | 2.3% (8,490) |
| Dayton: | 2.1% (12) |
| Tennessee: | 2.7% (10,295) |
Place of birth for U.S.-born residents:
- This state: 4,816
- Other state: 1,817
- Northeast: 97
- Midwest: 571
- South: 1,045
- West: 84
76.4% of Dayton residents lived in the same house 1 years ago.
Out of people who lived in different houses, 43.7% lived in this county.
Out of people who lived in different counties, 51.6% lived in Tennessee.
| Dayton: | 76.4% |
| State average: | 87.0% |
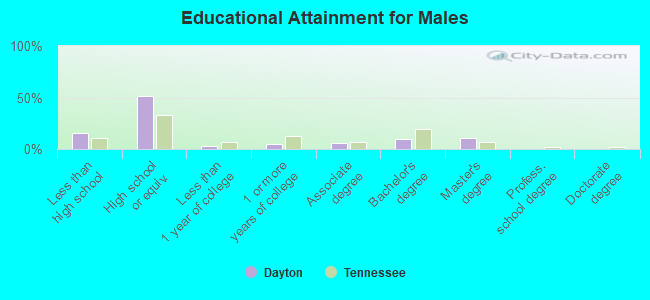
Education attainment for males 25 years and older:
- No schooling: 70
- Nursery to 4th grade: 16
- 5th and 6th grade: 59
- 7th and 8th grade: 28
- 9th grade: 33
- 10th grade: 39
- 11th grade: 28
- 12th grade, no diploma: 60
- High school graduate (or equivalency): 1,113
- Less than 1 year of college: 64
- Some college more than 1 year, no degree: 114
- Associate degree: 116
- Bachelor's degree: 204
- Master's degree: 221
- Professional school degree: 0
- Doctorate degree: 0
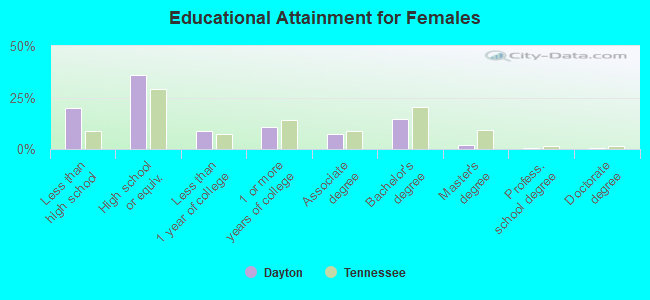
Education attainment for females 25 years and older:
- No schooling: 78
- Nursery to 4th grade: 44
- 5th and 6th grade: 0
- 7th and 8th grade: 33
- 9th grade: 137
- 10th grade: 19
- 11th grade: 160
- 12th grade, no diploma: 6
- High school graduate (or equivalency): 860
- Less than 1 year of college: 215
- Some college more than 1 year, no degree: 252
- Associate degree: 175
- Bachelor's degree: 349
- Master's degree: 51
- Professional school degree: 8
- Doctorate degree: 7
Housing units in structures:
- One, detached: 1,972
- One, attached: 66
- Two: 403
- 3 or 4: 340
- 5 to 9: 196
- 20 to 49: 58
- Mobile homes: 70
Housing units lacking complete kitchen facilities in 2022: 2.6%
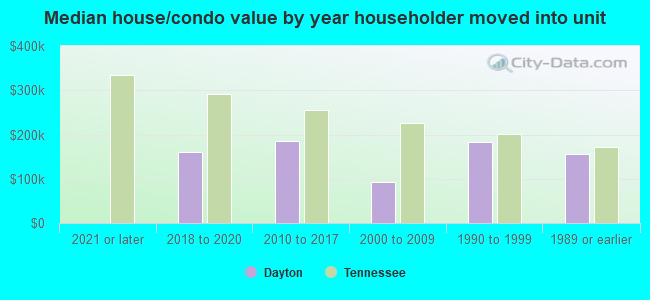
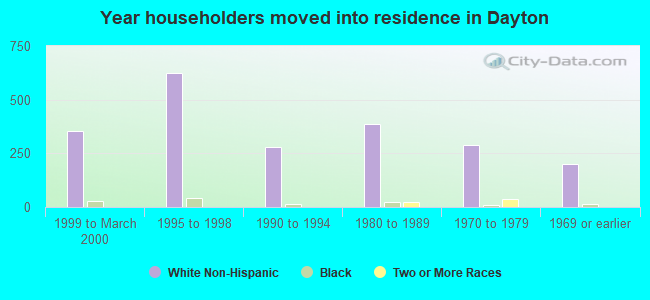
House/condo owner moved in on average 14 years ago
Renter moved in on average 3 years ago
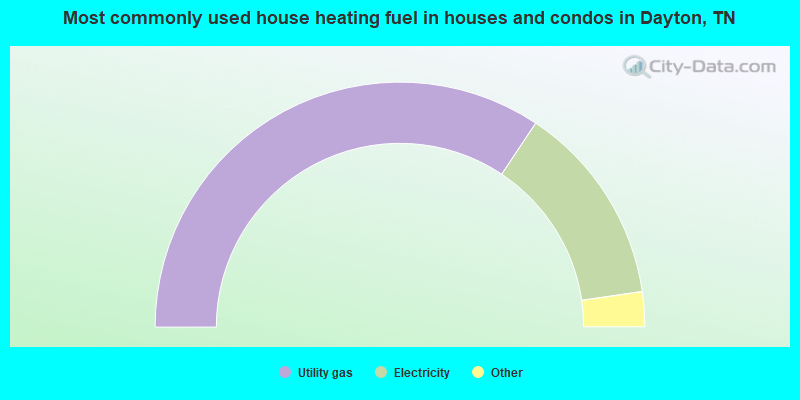
- 68.7%Utility gas
- 26.7%Electricity
- 3.7%Wood
- 0.8%Bottled, tank, or LP gas
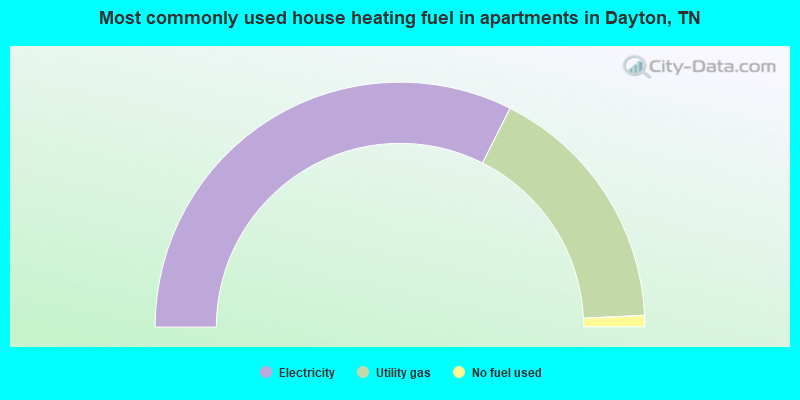
- 64.8%Electricity
- 33.6%Utility gas
- 1.5%No fuel used
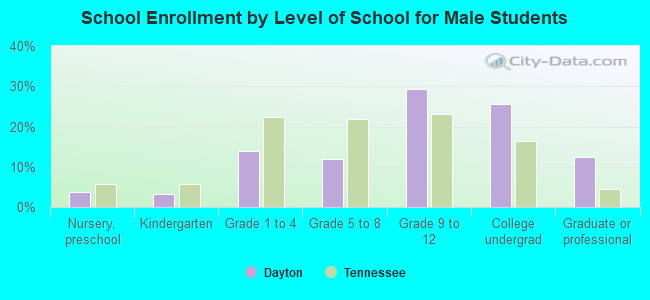
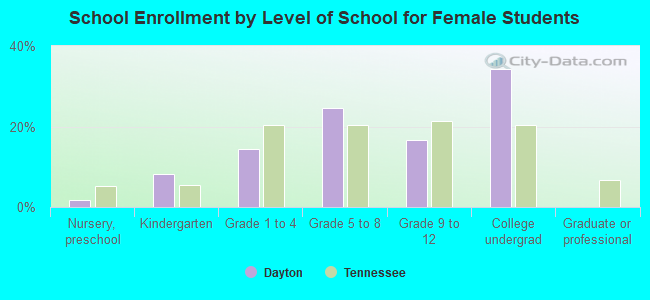
Private vs. public school enrollment:
| Here: | 1.6% |
| Tennessee: | 15.0% |
| Here: | 3.7% |
| Tennessee: | 16.2% |
| Here: | 78.0% |
| Tennessee: | 23.5% |