Darlington, IN (Indiana) Houses and Residents
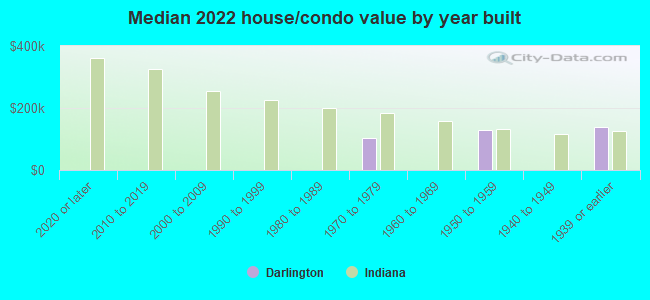
| Darlington: | $128,903 |
| Indiana: | $208,700 |
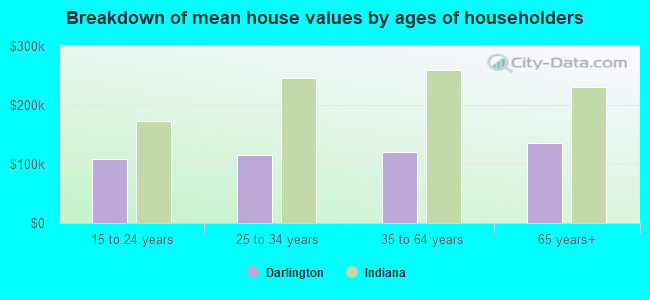
Mean price in 2022:
Detached houses: $131,362
Here: $131,362 State: $257,916 Mobile homes: $14,437
Here: $14,437 State: $67,116
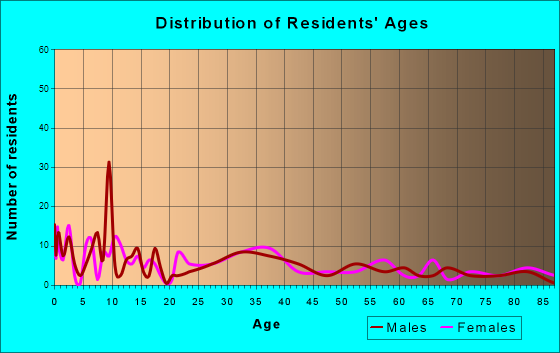
Total population: 839 (Urban population: 0, Rural population: 879 (all nonfarm))
Houses: 346 (318 occupied: 231 owner occupied, 91 renter occupied)
| % of renters here: | 28% |
| State: | 29% |
Housing density: 1,097 houses/condos per square mile
Median price asked for vacant for-sale houses and condos in 2022 in this county: $141,930.
Median contract rent in 2022: $626 (lower quartile is $575, upper quartile is $819)
Median rent asked for vacant for-rent units in 2022: $568
Median gross rent in Darlington, IN in 2022: $849
Housing units in Darlington with a mortgage: 125 (28 second mortgage, 0 home equity loan, 28 both second mortgage and home equity loan)
Houses without a mortgage: 0
Median household income for houses/condos with a mortgage: $69,310
Median household income for apartments without a mortgage: $69,562
Median monthly housing costs: $829
Compare current foreclosures near Darlington, IN:
| Photo | Address | Area | Beds / Baths | Price | Details |
|---|---|---|---|---|---|

|
#1
E Bayou Rd
Darlington, IN 47940
|
- sq. feet
|
- baths - beds |
show details | |

|
#2
W 650 N
Crawfordsville, IN 47933
|
1,284 sq. feet
|
1 baths 2 beds |
show details | |

|
#3
W Shore Dr
Crawfordsville, IN 47933
|
1,920 sq. feet
|
3 baths 3 beds |
show details | |

|
#4
S Main Cross St
Wingate, IN 47994
|
880 sq. feet
|
2 baths 3 beds |
show details | |

|
#5
Wesley Ct
Thorntown, IN 46071
|
1,744 sq. feet
|
2 baths 3 beds |
show details | |

|
#6
W Wabash Ave
Crawfordsville, IN 47933
|
1,792 sq. feet
|
1 baths 3 beds |
show details | |

|
#7
N Market St
Thorntown, IN 46071
|
1,084 sq. feet
|
2 baths 3 beds |
show details | |

|
#8
N Mt Zion Ct
Crawfordsville, IN 47933
|
1,463 sq. feet
|
1 baths 3 beds |
show details | |

|
#9
E Ladoga Rd
Crawfordsville, IN 47933
|
1,600 sq. feet
|
1 baths 2 beds |
show details | |

|
#10
Lafayette Ave Unit 12
Lebanon, IN 46052
|
920 sq. feet
|
1 baths 3 beds |
show details |
| Photo | Address | Area | Beds / Baths | Price | Details |
|---|---|---|---|---|---|

|
#11
W Country Club Rd
Crawfordsville, IN 47933
|
2,016 sq. feet
|
2 baths 4 beds |
show details | |

|
#12
S Wabash St
New Richmond, IN 47967
|
1,275 sq. feet
|
1 baths 3 beds |
show details | |

|
#13
E State Road 234
Ladoga, IN 47954
|
1,568 sq. feet
|
2 baths 4 beds |
show details | |

|
#14
Evergreen Blvd
Linden, IN 47955
|
1,278 sq. feet
|
2 baths 3 beds |
show details | |

|
#15
W 800 N
Lebanon, IN 46052
|
2,113 sq. feet
|
1 baths 4 beds |
show details | |

|
#16
W Jackson St
Frankfort, IN 46041
|
1,064 sq. feet
|
1 baths 3 beds |
show details | |

|
#17
W Garfield St
Waynetown, IN 47990
|
2,282 sq. feet
|
2 baths 4 beds |
show details | |

|
#18
Mary Dr
Lebanon, IN 46052
|
1,066 sq. feet
|
1 baths 3 beds |
show details | |

|
#19
W Main St
Crawfordsville, IN 47933
|
708 sq. feet
|
1 baths 2 beds |
show details | |

|
#20
Thomas Dr
Lebanon, IN 46052
|
2,486 sq. feet
|
2 baths 3 beds |
show details |
| Photo | Address | Area | Beds / Baths | Price | Details |
|---|---|---|---|---|---|

|
#21
Thomas Dr
Lebanon, IN 46052
|
1,375 sq. feet
|
2 baths 3 beds |
show details | |

|
#22
N County Road 0 Ew
Frankfort, IN 46041
|
1,486 sq. feet
|
2 baths 3 beds |
show details | |

|
#23
Ashley Dr
Lebanon, IN 46052
|
960 sq. feet
|
1 baths 3 beds |
show details | |

|
#24
Fairlane Dr
Lebanon, IN 46052
|
1,692 sq. feet
|
1 baths 3 beds |
show details | |

|
#25
Douglas Ln
Lebanon, IN 46052
|
875 sq. feet
|
1 baths 3 beds |
show details | |

|
#26
W Antioch Rd
Frankfort, IN 46041
|
1,613 sq. feet
|
1 baths 3 beds |
show details | |

|
#27
Roselawn Dr
Lebanon, IN 46052
|
1,898 sq. feet
|
2 baths 3 beds |
show details | |

|
#28
Stoltz St
Lebanon, IN 46052
|
816 sq. feet
|
1 baths 2 beds |
show details | |

|
#29
N West St
Lebanon, IN 46052
|
1,581 sq. feet
|
2 baths 3 beds |
show details | |

|
#30
W Mulberry Jefferson Rd
Mulberry, IN 46058
|
1,302 sq. feet
|
2 baths 3 beds |
show details |
| Photo | Address | Area | Beds / Baths | Price | Details |
|---|---|---|---|---|---|

|
#31
W Ash St
Lebanon, IN 46052
|
1,104 sq. feet
|
1 baths 2 beds |
show details | |

|
#32
W Green St
Lebanon, IN 46052
|
1,669 sq. feet
|
1 baths 4 beds |
show details | |

|
#33
W Green St
Lebanon, IN 46052
|
1,094 sq. feet
|
1 baths 3 beds |
show details | |

|
#34
S Barr St
Crawfordsville, IN 47933
|
1,198 sq. feet
|
1 baths 2 beds |
show details | |

|
#35
S Outer Dr
Lebanon, IN 46052
|
1,476 sq. feet
|
2 baths 3 beds |
show details | |

|
#36
S Barr St
Crawfordsville, IN 47933
|
1,344 sq. feet
|
1 baths 4 beds |
show details | |

|
#37
E Us Highway 136
Crawfordsville, IN 47933
|
1,711 sq. feet
|
1 baths 3 beds |
show details | |

|
#38
S Barr St
Crawfordsville, IN 47933
|
1,288 sq. feet
|
1 baths 3 beds |
show details | |

|
#39
E Elmore St
Crawfordsville, IN 47933
|
924 sq. feet
|
1 baths 2 beds |
show details | |

|
#40
Cottage Ave
Crawfordsville, IN 47933
|
768 sq. feet
|
1 baths 2 beds |
show details |
| Photo | Address | Area | Beds / Baths | Price | Details |
|---|---|---|---|---|---|

|
#41
N Grant Ave
Crawfordsville, IN 47933
|
1,044 sq. feet
|
2 baths 2 beds |
show details | |

|
#42
Tuttle Ave
Crawfordsville, IN 47933
|
1,084 sq. feet
|
1 baths 2 beds |
show details | |

|
#43
E College St
Crawfordsville, IN 47933
|
1,132 sq. feet
|
1 baths 3 beds |
show details | |

|
#44
Athens St
Crawfordsville, IN 47933
|
912 sq. feet
|
1 baths 3 beds |
show details | |

|
#45
Parke Ave
Crawfordsville, IN 47933
|
1,308 sq. feet
|
1 baths 3 beds |
show details | |

|
#46
E Jefferson St
Crawfordsville, IN 47933
|
1,800 sq. feet
|
1 baths 3 beds |
show details | |

|
#47
N Englewood Dr
Crawfordsville, IN 47933
|
1,058 sq. feet
|
1 baths 3 beds |
show details | |

|
#48
E Chestnut St
Crawfordsville, IN 47933
|
1,344 sq. feet
|
1 baths 3 beds |
show details | |

|
#49
Seren Dr
Lebanon, IN 46052
|
- sq. feet
|
- baths - beds |
show details | |

|
Check over 1 million property listings on Foreclosure.com!
|
browse all offers | |||

Latest news about housing in Darlington, IN collected exclusively by city-data.com from local newspapers, TV, and radio stations

 | Tornado (65 replies) |
| Any info on Crawfordsville? (15 replies) |
| Three questions about Indy (12 replies) |
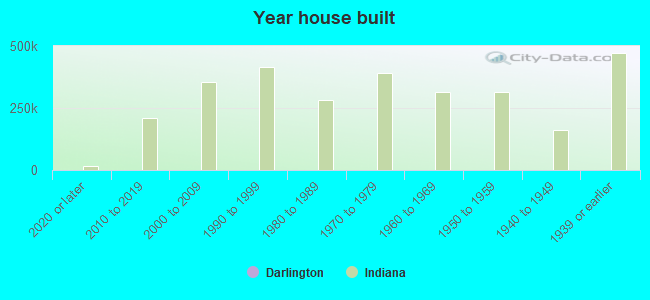
Median year apartment built: 1939
Household type by relationship:
Households: 810- Male householders: 136 (59 living alone), Female householders: 179 (38 living alone)
175 spouses (175 opposite-sex spouses), 48 unmarried partners, (48 opposite-sex unmarried partners), 175 children (164 natural, 7 adopted, 4 stepchildren), 41 grandchildren, 6 brothers or sisters, 4 parents, 0 foster children, 32 other relatives, 12 non-relatives
Size of family households: 75 2-persons, 68 3-persons, 29 4-persons, 21 5-persons, 1 6-persons.
Size of nonfamily households: 100 1-person, 21 2-persons, 4 3-persons.
46 married couples with children.
49 single-parent households (0 men, 49 women).
96.2% of residents of Darlington speak English at home.
2.7% of residents speak Spanish at home (62% speak English very well, 10% speak English well, 24% speak English not well, 5% don't speak English at all).
0.4% of residents speak other Indo-European language at home (100% speak English very well).
Foreign born population: 15 (1.9%)
(0.0% of them are naturalized citizens)
| Here: | 6.7 |
| State: | 6.6 |
| Here: | 4.6 |
| State: | 4.3 |
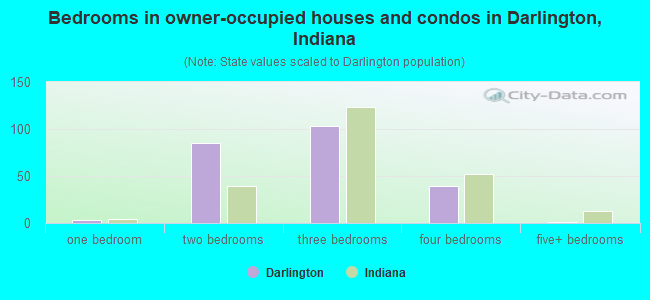
- Bedrooms in owner-occupied houses and condos in Darlington, Indiana
- 0no bedroom
- 31 bedroom
- 852 bedrooms
- 1033 bedrooms
- 394 bedrooms
- 15+ bedrooms
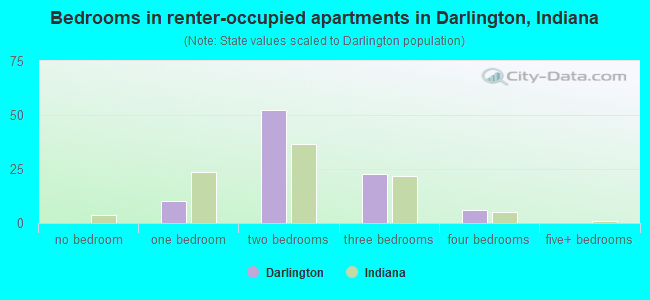
- Bedrooms in renter-occupied apartments in Darlington, Indiana
- 0no bedroom
- 101 bedroom
- 522 bedrooms
- 233 bedrooms
- 64 bedrooms
- 05+ bedrooms
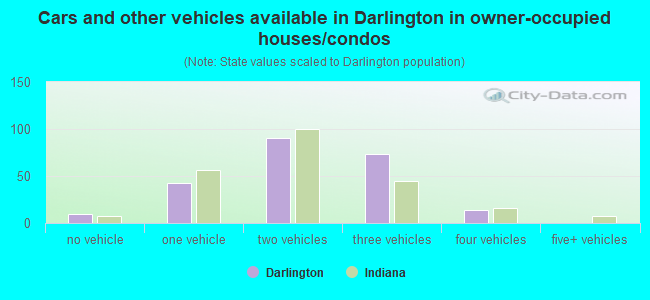
- Cars and other vehicles available in Darlington in owner-occupied houses/condos
- 10no vehicle
- 431 vehicle
- 902 vehicles
- 733 vehicles
- 144 vehicles
- 05+ vehicles
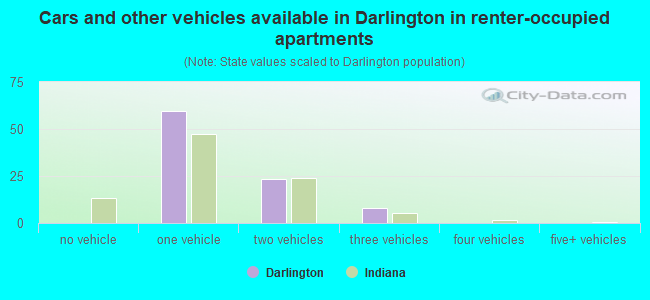
- Cars and other vehicles available in Darlington in renter-occupied apartments
- 0no vehicle
- 601 vehicle
- 242 vehicles
- 83 vehicles
- 04 vehicles
- 05+ vehicles
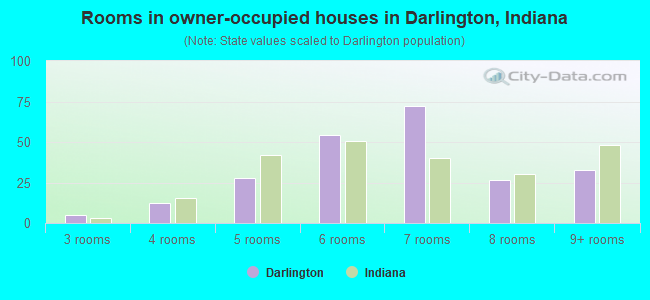
- Rooms in owner-occupied houses in Darlington, Indiana
- 01 room
- 02 rooms
- 53 rooms
- 124 rooms
- 285 rooms
- 546 rooms
- 727 rooms
- 278 rooms
- 339+ rooms
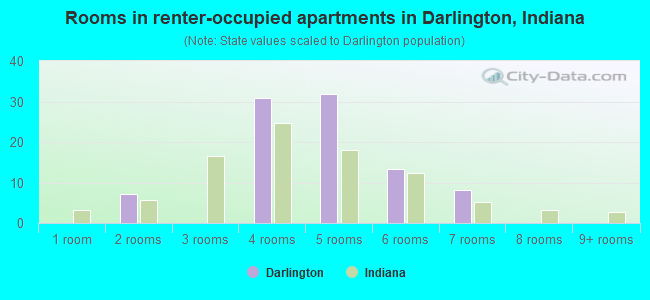
- Rooms in renter-occupied apartments in Darlington, Indiana
- 01 room
- 72 rooms
- 03 rooms
- 314 rooms
- 325 rooms
- 136 rooms
- 87 rooms
- 08 rooms
- 09+ rooms
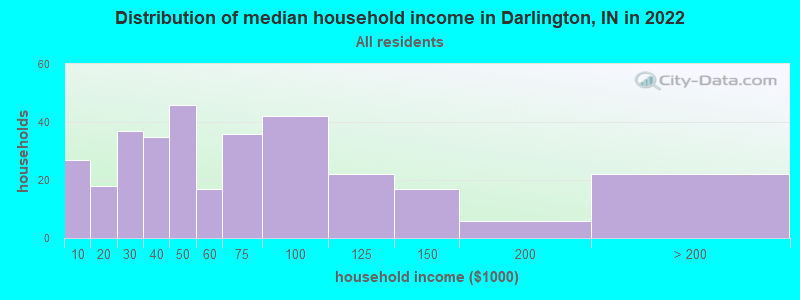
Darlington, IN household income distribution

- 27Less than $10,000
- 18$10,000 to $19,999
- 37$20,000 to $29,999
- 35$30,000 to $39,999
- 46$40,000 to $49,999
- 17$50,000 to $59,999
- 36$60,000 to $74,999
- 42$75,000 to $99,999
- 22$100,000 to $124,999
- 17$125,000 to $149,999
- 6$150,000 to $199,999
- 22$200,000 or more
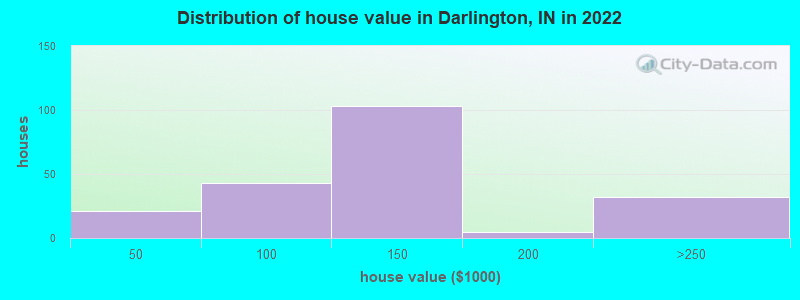
Home value of owner - occupied houses in 2022 in Darlington, IN
-
- 5Less than $10,000
- 5$15,000 to $19,999
- 2$20,000 to $24,999
- 2$30,000 to $34,999
- 5$40,000 to $49,999
- 13$50,000 to $59,999
- 8$70,000 to $79,999
- 6$80,000 to $89,999
- 8$90,000 to $99,999
- 73$100,000 to $124,999
- 29$125,000 to $149,999
- 4$150,000 to $174,999
- 0$175,000 to $199,999
- 32$200,000 to $249,999
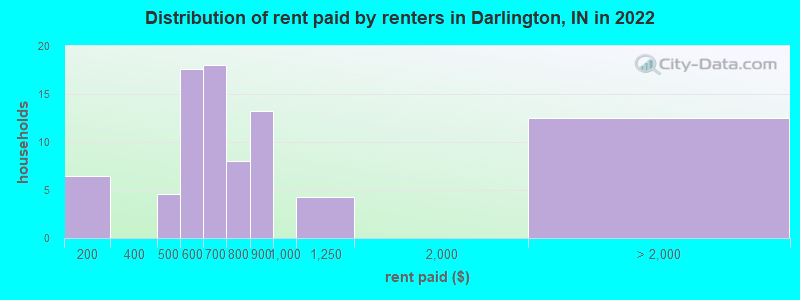
Rent paid by renters in 2022 in Darlington, IN
-
- 6$100 to $149
- 4$450 to $499
- 17$550 to $599
- 13$600 to $649
- 4$650 to $699
- 3$700 to $749
- 3$750 to $799
- 13$800 to $899
- 4$1,000 to $1,249
- 12No cash rent
Percentage of workers working in this county: 58.9%
Number of people working at home: 13 (3.6% of all workers)
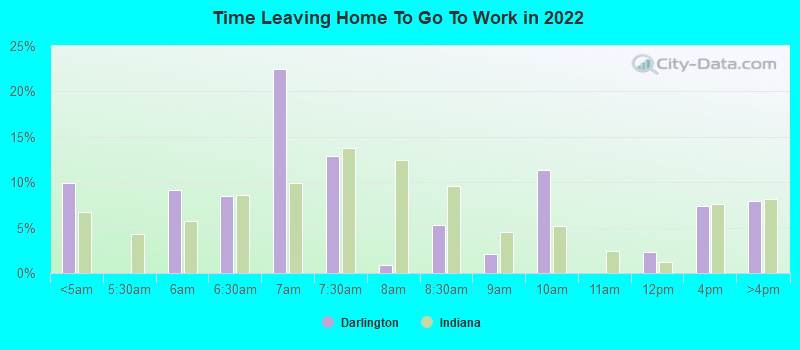
Travel time to work (commute)
- Less than 5 minutes: 26
- 5 to 9 minutes: 0
- 10 to 14 minutes: 63
- 15 to 19 minutes: 63
- 20 to 24 minutes: 31
- 25 to 29 minutes: 25
- 30 to 34 minutes: 25
- 35 to 39 minutes: 22
- 40 to 44 minutes: 4
- 45 to 59 minutes: 60
- 60 to 89 minutes: 17
- 90 or more minutes: 0
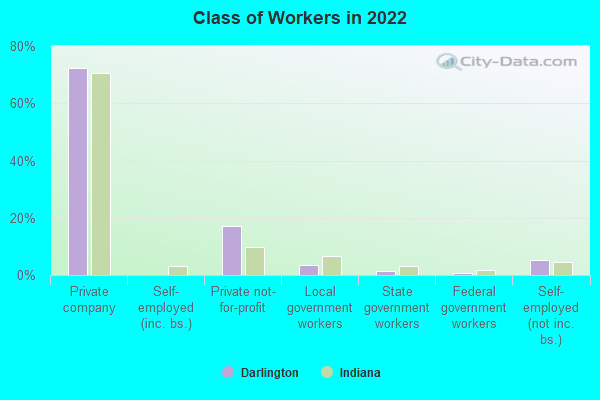
Means of transportation to work:
- Drove a car alone: 314 (82.2%)
- Carpooled: 44 (11.5%)
- Bus or trolley bus: 3 (0.8%)
- Walked: 10 (2.6%)
- Worked at home: 11 (2.9%)
- Unemployment by race in 2022
- Unemployment rate for White non-Hispanic residents
- 3.5%Males
- 1.1%Females
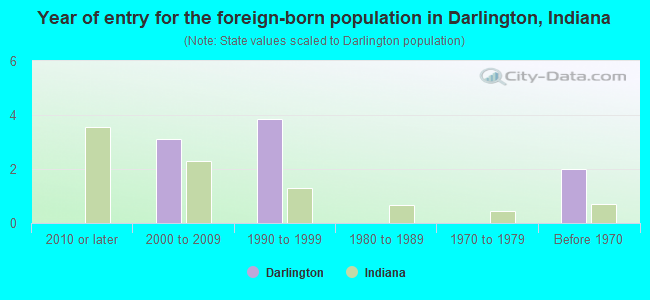
- Year of entry for the foreign-born population in Darlington, Indiana
- 02010 or later
- 32000 to 2009
- 41990 to 1999
- 01980 to 1989
- 01970 to 1979
- 2Before 1970
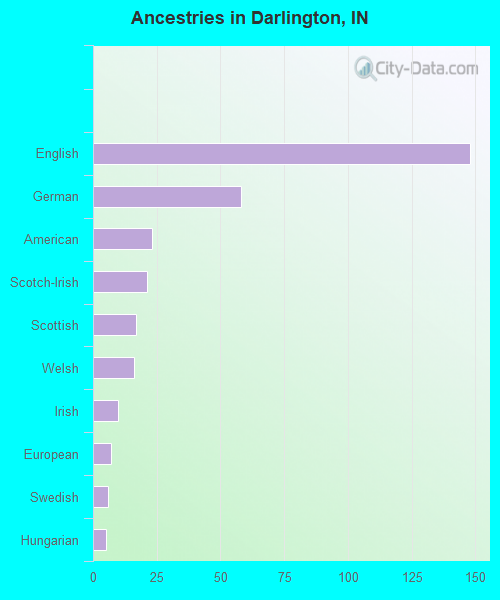
First ancestries reported:
- English: 148 (41.8%)
- German: 58 (16.4%)
- American: 23 (6.5%)
- Scotch-Irish: 21 (5.9%)
- Scottish: 17 (4.8%)
- Welsh: 16 (4.5%)
- Irish: 10 (2.8%)
- European: 7 (2.0%)
- Swedish: 6 (1.7%)
- Hungarian: 5 (1.4%)
Most common places of birth for foreign-born residents (%):
| Darlington: | 93.3% (14) |
| Indiana: | 27.0% (101,996) |
Place of birth for U.S.-born residents:
- This state: 596
- Other state: 182
- Northeast: 26
- Midwest: 70
- South: 68
- West: 17
89.4% of Darlington residents lived in the same house 1 years ago.
Out of people who lived in different houses, 35.3% lived in this county.
Out of people who lived in different counties, 47.5% lived in Indiana.
| Darlington: | 89.4% |
| State average: | 87.1% |
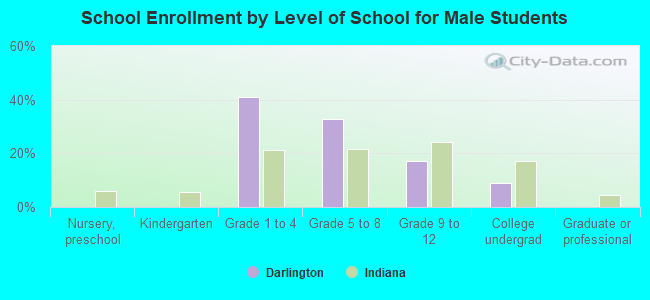
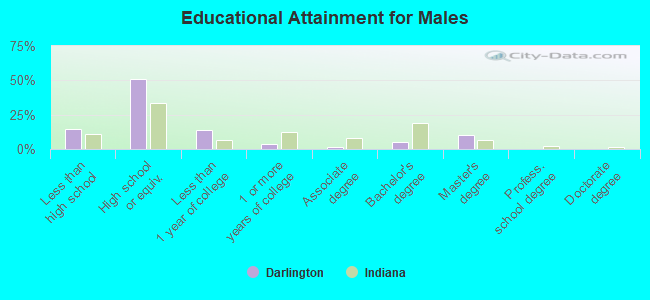
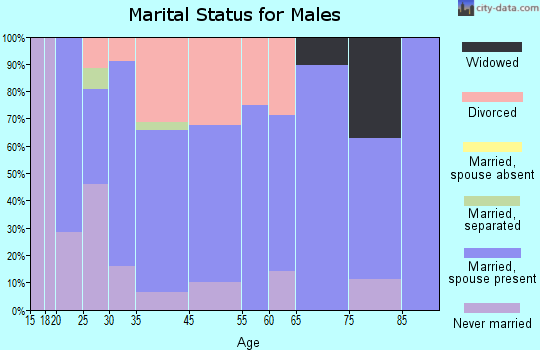
Education attainment for males 25 years and older:
- No schooling: 0
- Nursery to 4th grade: 8
- 5th and 6th grade: 0
- 7th and 8th grade: 0
- 9th grade: 5
- 10th grade: 2
- 11th grade: 14
- 12th grade, no diploma: 19
- High school graduate (or equivalency): 168
- Less than 1 year of college: 46
- Some college more than 1 year, no degree: 13
- Associate degree: 4
- Bachelor's degree: 17
- Master's degree: 34
- Professional school degree: 0
- Doctorate degree: 0
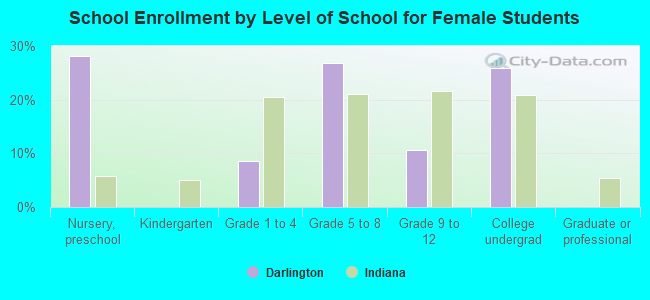
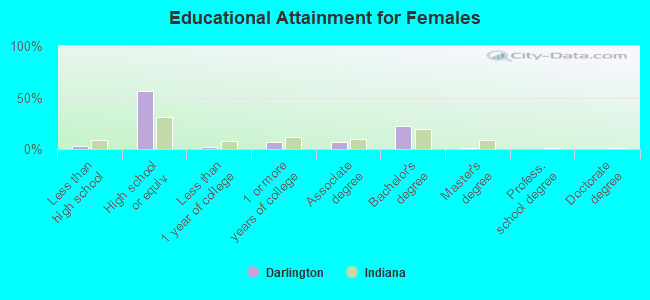
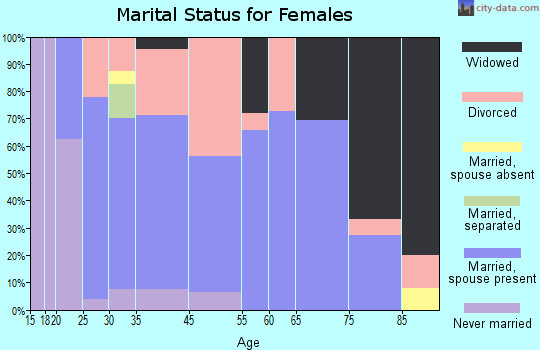
Education attainment for females 25 years and older:
- No schooling: 0
- Nursery to 4th grade: 0
- 5th and 6th grade: 0
- 7th and 8th grade: 0
- 9th grade: 3
- 10th grade: 1
- 11th grade: 3
- 12th grade, no diploma: 2
- High school graduate (or equivalency): 152
- Less than 1 year of college: 6
- Some college more than 1 year, no degree: 19
- Associate degree: 19
- Bachelor's degree: 61
- Master's degree: 2
- Professional school degree: 0
- Doctorate degree: 0
Housing units in structures:
- One, detached: 259
- One, attached: 2
- Two: 24
- 3 or 4: 17
- 5 to 9: 15
- 10 to 19: 8
- Mobile homes: 19
Housing units lacking complete kitchen facilities in 2022: 2.9%
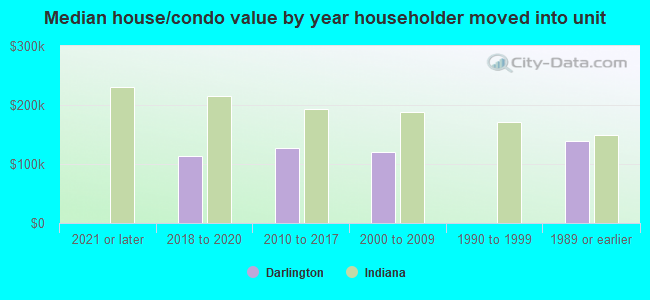
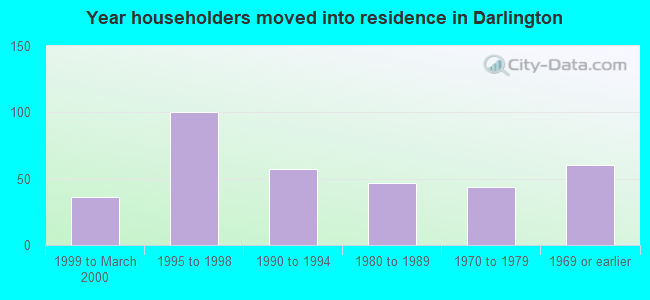
House/condo owner moved in on average 16 years ago
Renter moved in on average 4 years ago
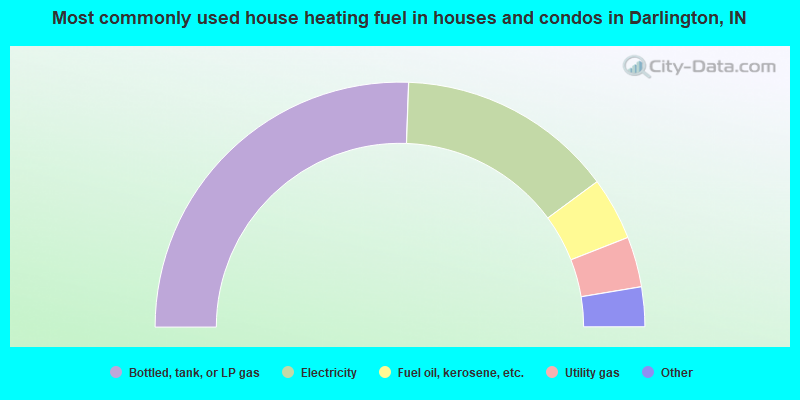
- 51.6%Bottled, tank, or LP gas
- 28.9%Electricity
- 8.4%Fuel oil, kerosene, etc.
- 6.7%Utility gas
- 3.6%No fuel used
- 0.9%Wood
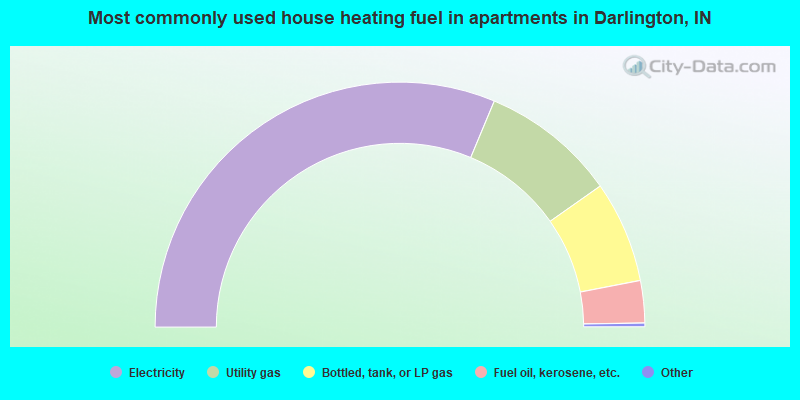
- 62.9%Electricity
- 18.0%Utility gas
- 13.5%Bottled, tank, or LP gas
- 5.6%Fuel oil, kerosene, etc.
Private vs. public school enrollment:
| Here: | 26.1% |
| Indiana: | 14.9% |
| Here: | 0.0% |
| Indiana: | 11.4% |
| Here: | 0.0% |
| Indiana: | 22.3% |