Housing density: 2,606 houses/condos per square mile
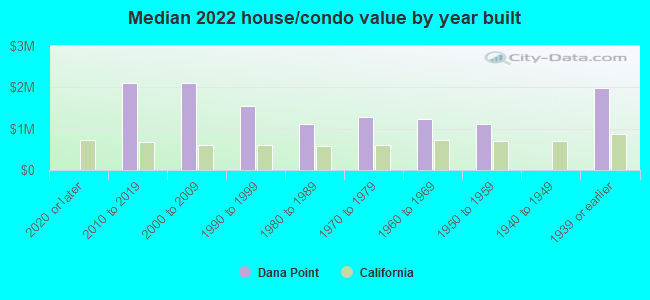
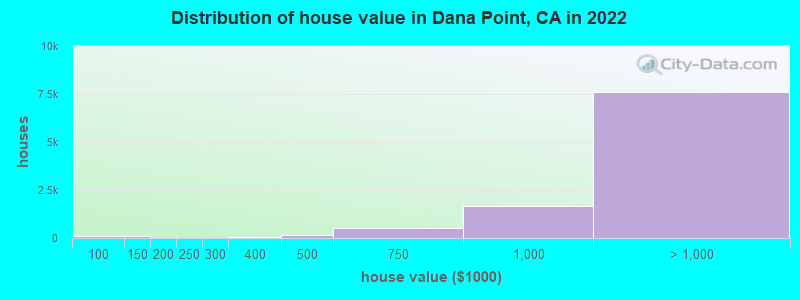
Median price asked for vacant for-sale houses and condos in 2022: $2,239,286.
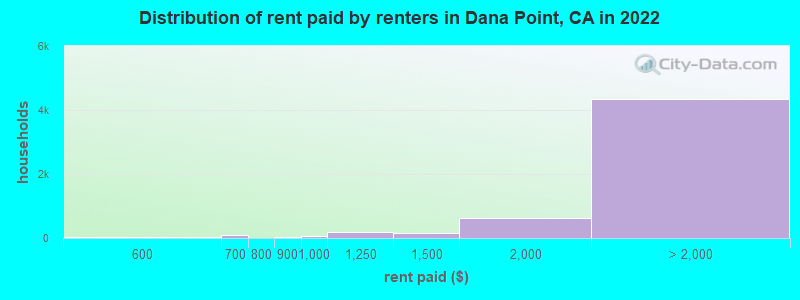
Median contract rent in 2022: over $2,000 (lower quartile is over $2,000, upper quartile is over $2,000)
Median rent asked for vacant for-rent units in 2022: $2,681
Median gross rent in Dana Point, CA in 2022: over $2,000
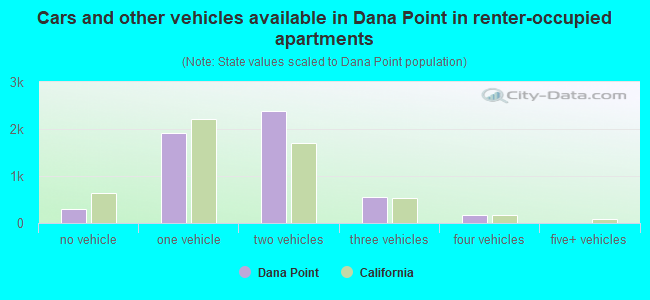
Housing units in Dana Point with a mortgage: 6,110 (534 second mortgage, 15 home equity loan, 419 both second mortgage and home equity loan) Houses without a mortgage: 119
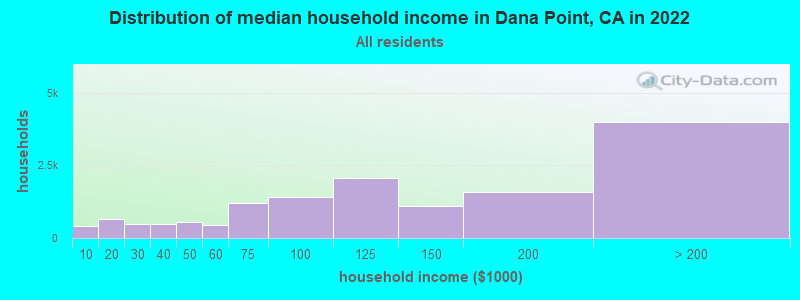
Median household income for houses/condos with a mortgage: $166,324
Median household income for apartments without a mortgage: $119,754
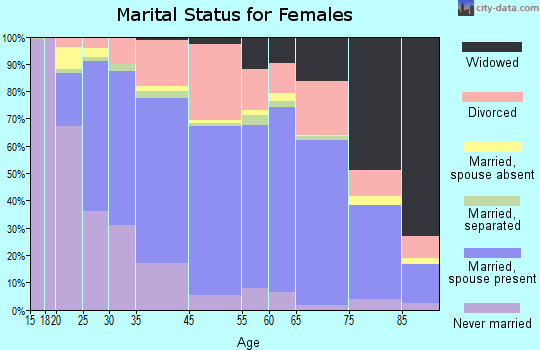
3,668 married couples with children.
1,706 single-parent households (663 men, 1,043 women).
81.3% of residents of Dana Point speak English at home.
9.0% of residents speak Spanish at home (70% speak English very well, 20% speak English well, 3% speak English not well, 7% don't speak English at all).
4.7% of residents speak other Indo-European language at home (85% speak English very well, 11% speak English well, 3% speak English not well).
2.5% of residents speak Asian or Pacific Island language at home (72% speak English very well, 22% speak English well, 6% speak English not well).
1.4% of residents speak other language at home (66% speak English very well, 34% speak English well).
Foreign born population: 4,497 (13.7%)
(71.5% of them are naturalized citizens)
Percentage of workers working in this county: 89.8% Number of people working at home: 5,245 (31.5% of all workers)
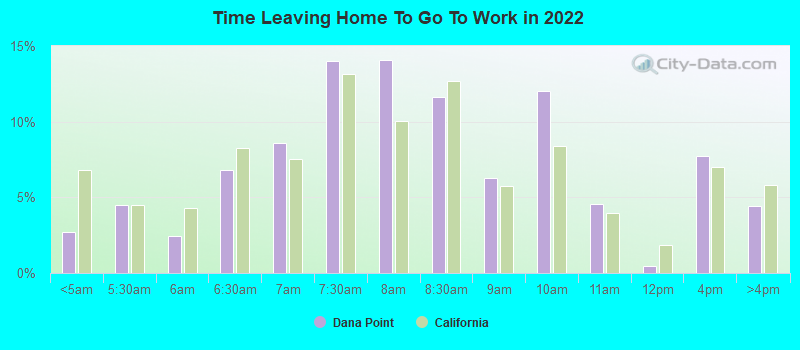
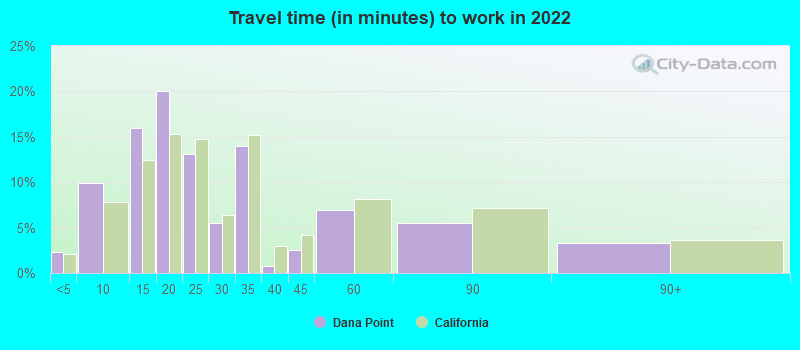
Travel time to work (commute)
Less than 5 minutes: 436
5 to 9 minutes: 1,062
10 to 14 minutes: 1,434
15 to 19 minutes: 1,875
20 to 24 minutes: 1,441
25 to 29 minutes: 869
30 to 34 minutes: 1,399
35 to 39 minutes: 582
40 to 44 minutes: 669
45 to 59 minutes: 849
60 to 89 minutes: 848
90 or more minutes: 367
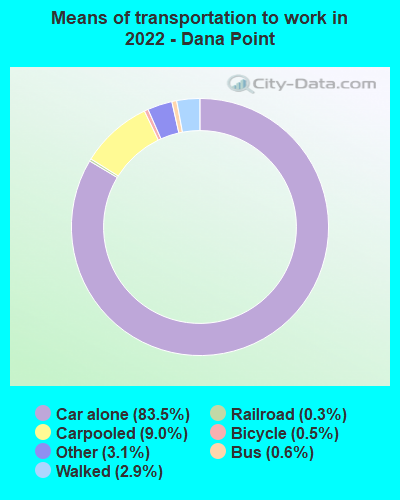
Means of transportation to work:
Drove a car alone: 7,758 (55.3%)
Carpooled: 908 (6.5%)
Bus: 52 (0.4%)
Long-distance train or commuter rail: 6 (0.0%)
Light rail, streetcar or trolley: 18 (0.1%)
Taxi: 330 (2.4%)
Bicycle: 51 (0.4%)
Walked: 270 (1.9%)
Worked at home: 5,245 (37.4%)
Unemployment by race in 2022
Unemployment rate for White non-Hispanic residents
3.3%Males
2.9%Females
Unemployment rate for Black residents
53.1%Males
Unemployment rate for Asian residents
17.6%Males
1.3%Females
Unemployment rate for other race residents
4.1%Females
Unemployment rate for two or more race residents
12.1%Females
Unemployment rate for Hispanic or Latino residents
6.1%Females
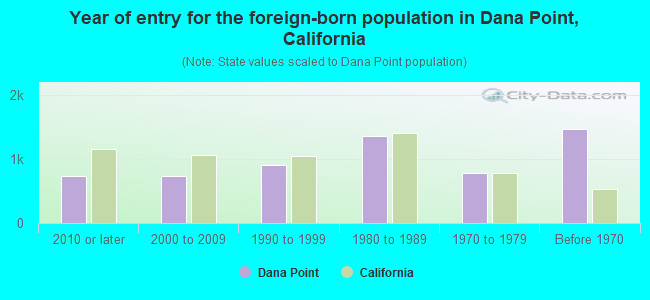
Year of entry for the foreign-born population in Dana Point, California
7282010 or later
7312000 to 2009
9011990 to 1999
1,3631980 to 1989
7791970 to 1979
1,468Before 1970
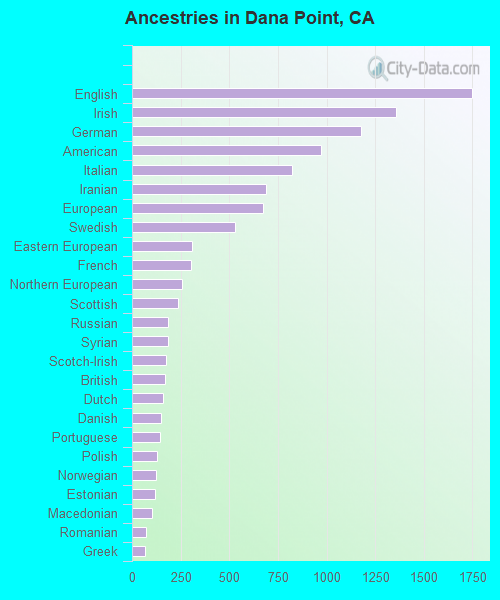
First ancestries reported:
English: 1,748 (10.2%)
Irish: 1,359 (7.9%)
German: 1,176 (6.9%)
American: 971 (5.7%)
Italian: 825 (4.8%)
Iranian: 691 (4.0%)
European: 672 (3.9%)
Swedish: 531 (3.1%)
Eastern European: 307 (1.8%)
French: 301 (1.8%)
Northern European: 256 (1.5%)
Scottish: 236 (1.4%)
Russian: 186 (1.1%)
Syrian: 184 (1.1%)
Scotch-Irish: 177 (1.0%)
British: 172 (1.0%)
Dutch: 157 (0.9%)
Danish: 150 (0.9%)
Portuguese: 144 (0.8%)
Polish: 127 (0.7%)
Norwegian: 121 (0.7%)
Estonian: 119 (0.7%)
Macedonian: 101 (0.6%)
Romanian: 74 (0.4%)
Greek: 67 (0.4%)
French Canadian: 67 (0.4%)
Ukrainian: 66 (0.4%)
Ethiopian: 63 (0.4%)
Croatian: 56 (0.3%)
Hungarian: 54 (0.3%)
Finnish: 54 (0.3%)
Canadian: 50 (0.3%)
Egyptian: 42 (0.2%)
Assyrian: 41 (0.2%)
Turkish: 38 (0.2%)
African: 36 (0.2%)
Australian: 35 (0.2%)
Austrian: 33 (0.2%)
Lebanese: 32 (0.2%)
Slovak: 30 (0.2%)
Czechoslovakian: 16 (0.09%)
Brazilian: 15 (0.09%)
Scandinavian: 14 (0.08%)
New Zealander: 13 (0.08%)
Palestinian: 12 (0.07%)
Armenian: 7 (0.04%)
Jordanian: 6 (0.03%)
Swiss: 6 (0.03%)
Slovene: 5 (0.03%)
Czech: 4 (0.02%)
Most common places of birth for foreign-born residents (%):
Mexico
Dana Point:
20.9% (941)
California:
37.2% (3,881,193)
Canada
Dana Point:
10.0% (449)
California:
1.2% (127,477)
Philippines
Dana Point:
7.6% (341)
California:
7.8% (818,297)
Iran
Dana Point:
6.5% (293)
California:
2.0% (206,004)
England
Dana Point:
4.1% (183)
California:
0.6% (57,953)
United Kingdom, excluding England and Scotland
Dana Point:
2.9% (130)
California:
0.6% (60,582)
Syria
Dana Point:
2.6% (117)
California:
0.3% (30,949)
China, excluding Hong Kong and Taiwan
Dana Point:
2.3% (103)
California:
6.6% (684,672)
Israel
Dana Point:
2.2% (98)
California:
0.3% (33,029)
North Macedonia (Macedonia)
Dana Point:
2.1% (95)
California:
0.0% (686)
France
Dana Point:
2.1% (93)
California:
0.4% (40,224)
Vietnam
Dana Point:
2.0% (89)
California:
4.9% (512,335)
Colombia
Dana Point:
1.8% (80)
California:
0.5% (55,249)
Romania
Dana Point:
1.7% (78)
California:
0.2% (23,058)
Russia
Dana Point:
1.6% (72)
California:
0.7% (71,932)
Netherlands
Dana Point:
1.5% (68)
California:
0.2% (17,937)
Place of birth for U.S.-born residents:
This state: 19,146
Other state: 8,598
Northeast: 2,346
Midwest: 3,108
South: 1,844
West: 1,302
84.3% of Dana Point residents lived in the same house 1 years ago. Out of people who lived in different houses, 40.3% lived in this county. Out of people who lived in different counties, 59.4% lived in California.
Dana Point:
84.3%
State average:
88.9%
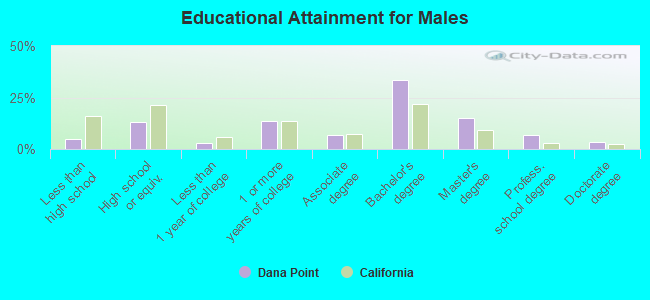
Education attainment for males 25 years and older:
No schooling: 142
Nursery to 4th grade: 11
5th and 6th grade: 0
7th and 8th grade: 9
9th grade: 40
10th grade: 20
11th grade: 30
12th grade, no diploma: 310
High school graduate (or equivalency): 1,560
Less than 1 year of college: 377
Some college more than 1 year, no degree: 1,606
Associate degree: 794
Bachelor's degree: 4,026
Master's degree: 1,809
Professional school degree: 820
Doctorate degree: 409
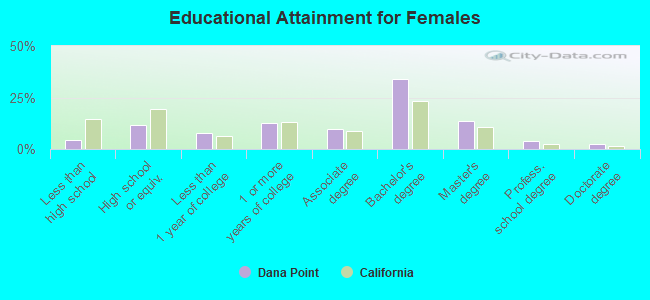
Education attainment for females 25 years and older:
No schooling: 170
Nursery to 4th grade: 48
5th and 6th grade: 50
7th and 8th grade: 5
9th grade: 34
10th grade: 9
11th grade: 11
12th grade, no diploma: 264
High school graduate (or equivalency): 1,563
Less than 1 year of college: 1,025
Some college more than 1 year, no degree: 1,697
Associate degree: 1,267
Bachelor's degree: 4,540
Master's degree: 1,850
Professional school degree: 515
Doctorate degree: 327
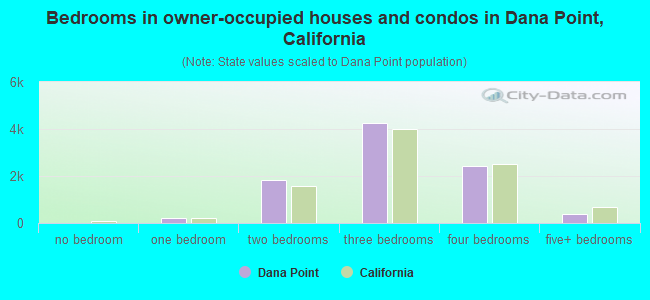
Housing units in structures:
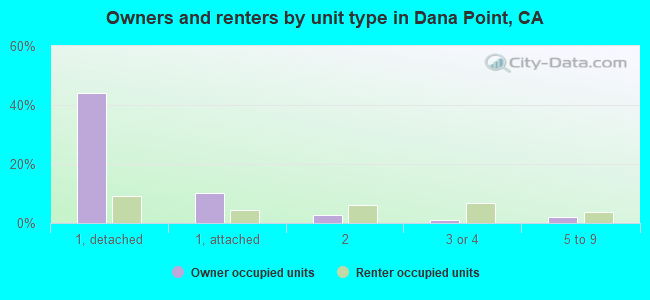
One, detached: 8,886
One, attached: 2,304
Two: 1,324
3 or 4: 1,633
5 to 9: 1,399
10 to 19: 562
20 to 49: 282
50 or more: 766
Mobile homes: 133
Median worth of mobile homes: $155,347
Housing units lacking complete plumbing facilities in 2022: 0.1%
Housing units lacking complete kitchen facilities in 2022: 1.0%
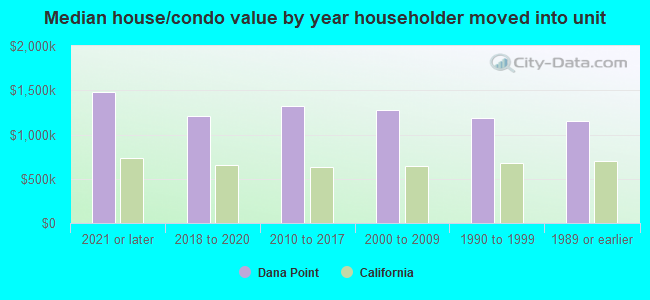
House/condo owner moved in on average 10 years ago