Covington, VA (Virginia) Houses and Residents
| Covington: | $86,205 |
| Virginia: | $365,700 |
Total population: 5,802 (All urban)
Houses: 3,099 (2,544 occupied: 1,934 owner occupied, 637 renter occupied)
| % of renters here: | 25% |
| State: | 33% |
Housing density: 546 houses/condos per square mile
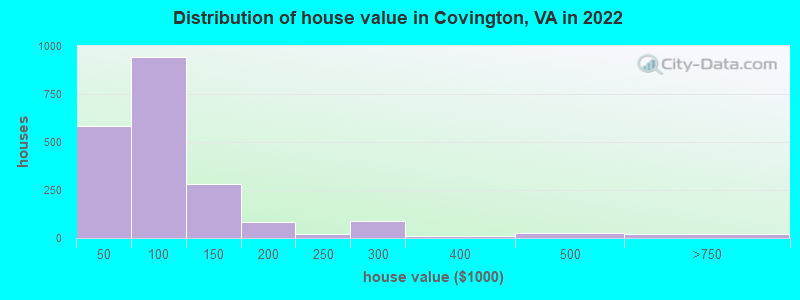
Median price asked for vacant for-sale houses and condos in 2022: $110,316.
Median contract rent in 2022: $520 (lower quartile is $423, upper quartile is $571)
Median rent asked for vacant for-rent units in 2022: $486
Median gross rent in Covington, VA in 2022: $718
Housing units in Covington with a mortgage: 795 (47 second mortgage, 0 home equity loan, 36 both second mortgage and home equity loan)
Houses without a mortgage: 73
Median household income for houses/condos with a mortgage: $69,094
Median household income for apartments without a mortgage: $34,691
Median monthly housing costs: $609
Compare current foreclosures near Covington, VA:
| Photo | Address | Area | Beds / Baths | Price | Details |
|---|---|---|---|---|---|

|
#1
N Lexington Ave
Covington, VA 24426
|
- sq. feet
|
2 baths 4 beds |
$14,900
|
show details |

|
#2
N Magazine Ave
Covington, VA 24426
|
1,790 sq. feet
|
2 baths 4 beds |
show details | |

|
#3
S Franklin Ave
Covington, VA 24426
|
1,055 sq. feet
|
1 baths 2 beds |
show details | |

|
#4
Potts Creek Rd
Covington, VA 24426
|
2,925 sq. feet
|
2 baths 3 beds |
show details | |

|
#5
Todd St
Covington, VA 24426
|
1,352 sq. feet
|
1 baths 3 beds |
show details | |

|
#6
Potts Creek Rd
Covington, VA 24426
|
1,655 sq. feet
|
3 baths 3 beds |
show details | |

|
#7
Johnson Creek Rd
Covington, VA 24426
|
864 sq. feet
|
1 baths 2 beds |
show details | |

|
#8
Roaring Run Rd
Covington, VA 24426
|
1,376 sq. feet
|
1 baths 3 beds |
show details | |

|
#9
Jackson River Rd
Covington, VA 24426
|
1,323 sq. feet
|
2 baths 3 beds |
show details | |

|
#10
Dunlap Creek Rd
Covington, VA 24426
|
1,504 sq. feet
|
2 baths 3 beds |
show details |
| Photo | Address | Area | Beds / Baths | Price | Details |
|---|---|---|---|---|---|

|
#11
E Trout St
Covington, VA 24426
|
- sq. feet
|
- baths - beds |
show details | |

|
#12
E Walnut Street, Apt 2
Covington, VA 24426
|
- sq. feet
|
- baths - beds |
show details | |

|
#13
E Beech St
Covington, VA 24426
|
- sq. feet
|
- baths - beds |
show details | |

|
#14
Grande Rd
Covington, VA 24426
|
- sq. feet
|
- baths - beds |
show details | |

|
#15
S Fitzgerald Ave
Covington, VA 24426
|
- sq. feet
|
- baths - beds |
show details | |

|
#16
Mert Rd
Covington, VA 24426
|
- sq. feet
|
- baths - beds |
show details | |

|
#17
Nicelytown Rd
Clifton Forge, VA 24422
|
1,384 sq. feet
|
1 baths 2 beds |
show details | |

|
#18
Alleghany Ave
Clifton Forge, VA 24422
|
1,152 sq. feet
|
- baths - beds |
$27,900
|
show details |

|
#19
Roxbury St
Clifton Forge, VA 24422
|
1,957 sq. feet
|
1 baths 3 beds |
show details | |

|
#20
Hamilton Ave
Clifton Forge, VA 24422
|
960 sq. feet
|
1 baths 2 beds |
show details |
| Photo | Address | Area | Beds / Baths | Price | Details |
|---|---|---|---|---|---|

|
#21
Hamilton Ave
Clifton Forge, VA 24422
|
960 sq. feet
|
1 baths 2 beds |
show details | |

|
#22
W Ridgeway St
Clifton Forge, VA 24422
|
- sq. feet
|
- baths - beds |
show details | |

|
#23
Jefferson Ave
Clifton Forge, VA 24422
|
- sq. feet
|
- baths - beds |
show details | |

|
#24
Park St
Clifton Forge, VA 24422
|
- sq. feet
|
- baths - beds |
show details | |

|
#25
Pocahontas Trl, Beckley
White Sulphur Springs, WV 24986
|
- sq. feet
|
- baths - beds |
show details | |

|
#26
Griffith Ln
Clifton Forge, VA 24422
|
- sq. feet
|
- baths - beds |
show details | |

|
#27
Sharon Ln
Fincastle, VA 24090
|
- sq. feet
|
- baths - beds |
show details | |

|
#28
Tuckahoe Rd
White Sulphur Springs, WV 24986
|
- sq. feet
|
- baths - beds |
show details | |

|
#29
Bryant St
Clifton Forge, VA 24422
|
- sq. feet
|
- baths - beds |
show details | |

|
Check over 1 million property listings on Foreclosure.com!
|
browse all offers | |||

Latest news about housing in Covington, VA collected exclusively by city-data.com from local newspapers, TV, and radio stations

 | Apartments or townhouses near Metro for family with young kids? (18 replies) |
| Trip to VA - looking for home - Floyd + ? (16 replies) |
| Where to rent to commute to Covington, VA? (3 replies) |
| Covington area house to rent (1 reply) |
| How can singles afford houses in NOVA?!?! (143 replies) |
| Covington--prelim inquiry? (3 replies) |

Median year apartment built: 1958
Household type by relationship:
Households: 5,761- Male householders: 1,166 (345 living alone), Female householders: 1,353 (557 living alone)
1,138 spouses (1,122 opposite-sex spouses), 161 unmarried partners, (161 opposite-sex unmarried partners), 1,562 children (1,417 natural, 31 adopted, 113 stepchildren), 127 grandchildren, 56 brothers or sisters, 12 parents, 0 foster children, 63 other relatives, 30 non-relatives
- In group quarters: 88
Size of family households: 775 2-persons, 404 3-persons, 161 4-persons, 188 5-persons, 17 6-persons.
Size of nonfamily households: 929 1-person, 87 2-persons, 5 4-persons.
736 married couples with children.
480 single-parent households (222 men, 258 women).
97.1% of residents of Covington speak English at home.
0.9% of residents speak Spanish at home (100% speak English very well).
0.5% of residents speak other Indo-European language at home (88% speak English very well, 12% speak English not well).
1.2% of residents speak Asian or Pacific Island language at home (57% speak English very well, 29% speak English well, 14% speak English not well).
Foreign born population: 52 (0.9%)
(55.8% of them are naturalized citizens)
| Here: | 5.8 |
| State: | 7.0 |
| Here: | 4.9 |
| State: | 4.3 |

- Bedrooms in owner-occupied houses and condos in Covington, Virginia
- 0no bedroom
- 491 bedroom
- 6492 bedrooms
- 8383 bedrooms
- 2804 bedrooms
- 1195+ bedrooms

- Bedrooms in renter-occupied apartments in Covington, Virginia
- 0no bedroom
- 921 bedroom
- 2252 bedrooms
- 2683 bedrooms
- 514 bedrooms
- 05+ bedrooms

- Cars and other vehicles available in Covington in owner-occupied houses/condos
- 168no vehicle
- 6131 vehicle
- 5562 vehicles
- 4263 vehicles
- 1374 vehicles
- 355+ vehicles

- Cars and other vehicles available in Covington in renter-occupied apartments
- 51no vehicle
- 2861 vehicle
- 2702 vehicles
- 303 vehicles
- 04 vehicles
- 05+ vehicles

- Rooms in owner-occupied houses in Covington, Virginia
- 01 room
- 392 rooms
- 643 rooms
- 3124 rooms
- 4425 rooms
- 3496 rooms
- 1687 rooms
- 2128 rooms
- 3499+ rooms

- Rooms in renter-occupied apartments in Covington, Virginia
- 01 room
- 402 rooms
- 793 rooms
- 1254 rooms
- 1405 rooms
- 2176 rooms
- 277 rooms
- 38 rooms
- 69+ rooms


Covington, VA household income distribution

- 178Less than $10,000
- 261$10,000 to $19,999
- 478$20,000 to $29,999
- 257$30,000 to $39,999
- 235$40,000 to $49,999
- 273$50,000 to $59,999
- 227$60,000 to $74,999
- 226$75,000 to $99,999
- 212$100,000 to $124,999
- 140$125,000 to $149,999
- 68$150,000 to $199,999
- 5$200,000 or more

Home value of owner - occupied houses in 2022 in Covington, VA
-
- 239Less than $10,000
- 53$10,000 to $14,999
- 20$15,000 to $19,999
- 12$20,000 to $24,999
- 9$25,000 to $29,999
- 7$30,000 to $34,999
- 3$35,000 to $39,999
- 237$40,000 to $49,999
- 146$50,000 to $59,999
- 124$60,000 to $69,999
- 112$70,000 to $79,999
- 275$80,000 to $89,999
- 49$90,000 to $99,999
- 236$100,000 to $124,999
- 43$125,000 to $149,999
- 32$150,000 to $174,999
- 52$175,000 to $199,999
- 21$200,000 to $249,999
- 89$250,000 to $299,999
- 13$300,000 to $399,999
- 27$400,000 to $499,999
- 19$500,000 to $749,999
Rent paid by renters in 2022 in Covington, VA
-
- 7$150 to $199
- 10$200 to $249
- 16$300 to $349
- 63$350 to $399
- 84$400 to $449
- 45$450 to $499
- 157$500 to $549
- 43$550 to $599
- 18$600 to $649
- 5$650 to $699
- 45$700 to $749
- 9$750 to $799
- 9$1,000 to $1,249
- 132No cash rent


Percentage of workers working in this county: 41.1%
Number of people working at home: 114 (4.8% of all workers)
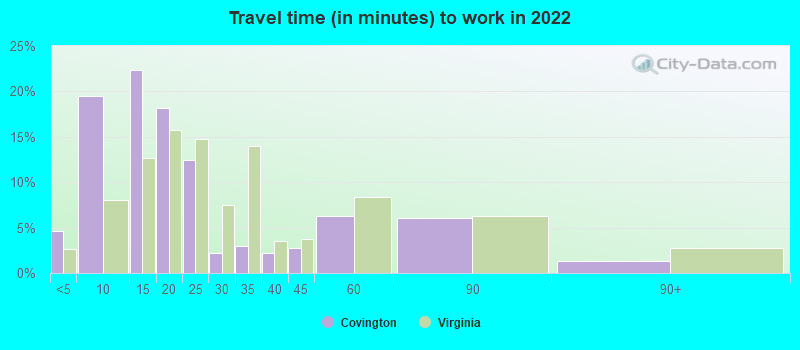
Travel time to work (commute)
- Less than 5 minutes: 266
- 5 to 9 minutes: 495
- 10 to 14 minutes: 587
- 15 to 19 minutes: 254
- 20 to 24 minutes: 173
- 25 to 29 minutes: 99
- 30 to 34 minutes: 122
- 35 to 39 minutes: 18
- 40 to 44 minutes: 53
- 45 to 59 minutes: 54
- 60 to 89 minutes: 20
- 90 or more minutes: 66
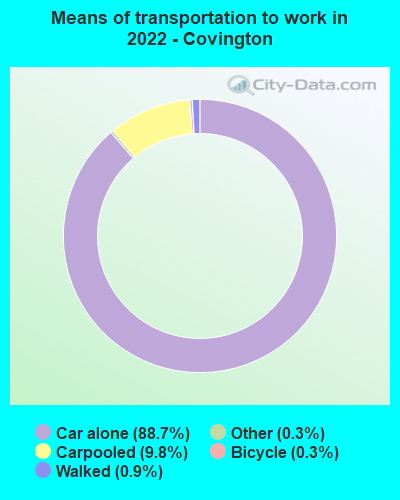
Means of transportation to work:
- Drove a car alone: 2,491 (82.0%)
- Carpooled: 279 (9.2%)
- Taxi: 10 (0.3%)
- Bicycle: 9 (0.3%)
- Walked: 25 (0.8%)
- Worked at home: 114 (3.8%)

- Unemployment by race in 2022
- Unemployment rate for White non-Hispanic residents
- 3.6%Males
- 0.3%Females
- Unemployment rate for Black residents
- 8.4%Females

- Year of entry for the foreign-born population in Covington, Virginia
- 212010 or later
- 152000 to 2009
- 31990 to 1999
- 261980 to 1989
- 141970 to 1979
- 18Before 1970

First ancestries reported:
- American: 671 (27.8%)
- English: 333 (13.8%)
- Irish: 246 (10.2%)
- European: 223 (9.2%)
- German: 113 (4.7%)
- Scottish: 40 (1.7%)
- Polish: 13 (0.5%)
- Czech: 6 (0.2%)
- Scotch-Irish: 4 (0.2%)
- British: 3 (0.1%)
Most common places of birth for foreign-born residents (%):
| Covington: | 61.5% (32) |
| Virginia: | 4.8% (52,629) |
| Covington: | 23.1% (12) |
| Virginia: | 4.9% (52,857) |
| Covington: | 11.5% (6) |
| Virginia: | 3.9% (42,989) |
Place of birth for U.S.-born residents:
- This state: 4,567
- Other state: 1,063
- Northeast: 224
- Midwest: 104
- South: 640
- West: 92
96.3% of Covington residents lived in the same house 1 years ago.
Out of people who lived in different houses, 17.8% lived in this county.
Out of people who lived in different counties, 87.1% lived in Virginia.
| Covington: | 96.3% |
| State average: | 86.6% |
Education attainment for males 25 years and older:
- No schooling: 0
- Nursery to 4th grade: 0
- 5th and 6th grade: 6
- 7th and 8th grade: 35
- 9th grade: 32
- 10th grade: 37
- 11th grade: 94
- 12th grade, no diploma: 94
- High school graduate (or equivalency): 985
- Less than 1 year of college: 144
- Some college more than 1 year, no degree: 189
- Associate degree: 103
- Bachelor's degree: 101
- Master's degree: 37
- Professional school degree: 19
- Doctorate degree: 0

Education attainment for females 25 years and older:
- No schooling: 12
- Nursery to 4th grade: 2
- 5th and 6th grade: 0
- 7th and 8th grade: 34
- 9th grade: 10
- 10th grade: 0
- 11th grade: 60
- 12th grade, no diploma: 0
- High school graduate (or equivalency): 957
- Less than 1 year of college: 283
- Some college more than 1 year, no degree: 245
- Associate degree: 173
- Bachelor's degree: 203
- Master's degree: 98
- Professional school degree: 11
- Doctorate degree: 0


Housing units in structures:
- One, detached: 2,628
- One, attached: 13
- Two: 137
- 3 or 4: 60
- 5 to 9: 10
- 10 to 19: 7
- 20 to 49: 11
- 50 or more: 12
- Mobile homes: 179
- Boats, RVs, vans, etc.: 38
Median worth of mobile homes: $11,233
Housing units lacking complete kitchen facilities in 2022: 10.3%
House/condo owner moved in on average 14 years ago
Renter moved in on average 5 years ago

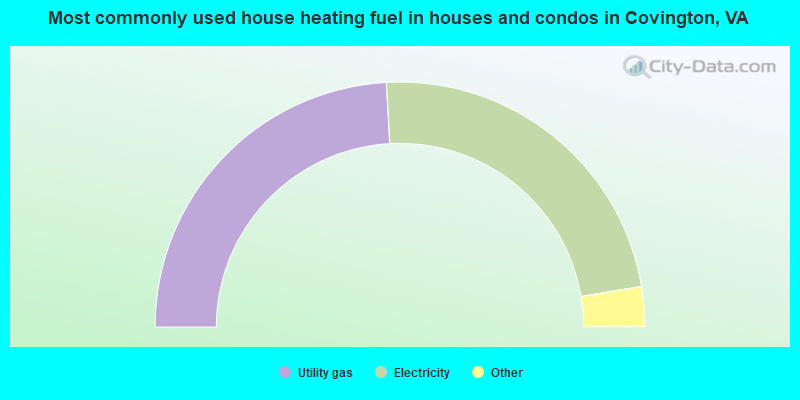
- 48.3%Utility gas
- 46.5%Electricity
- 2.6%Fuel oil, kerosene, etc.
- 1.0%Bottled, tank, or LP gas
- 0.8%Other fuel
- 0.4%No fuel used
- 0.4%Wood
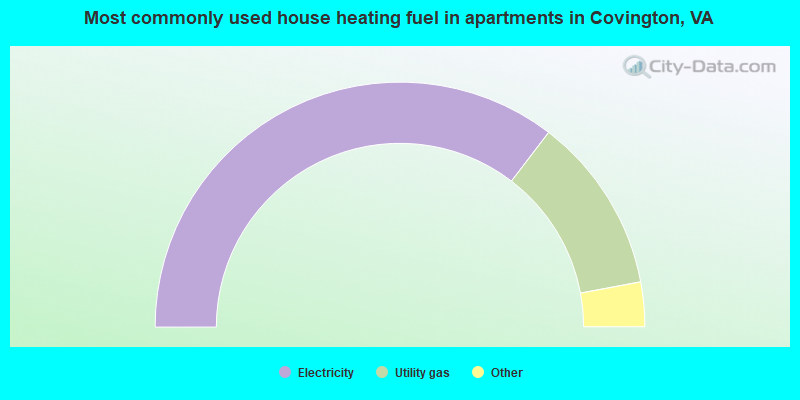
- 71.0%Electricity
- 23.4%Utility gas
- 3.7%Fuel oil, kerosene, etc.
- 1.9%Bottled, tank, or LP gas
Private vs. public school enrollment:
| Here: | 12.1% |
| Virginia: | 13.2% |
| Here: | 9.7% |
| Virginia: | 10.2% |
| Here: | 55.7% |
| Virginia: | 18.7% |


