Coventry, CT (Connecticut) Houses and Residents
| Coventry: | $315,420 |
| Connecticut: | $347,200 |
Total population: 12,435 (Urban population: 5,320 (103 inside urbanized areas, 5,217 inside urban clusters), Rural population: 6,184 (all nonfarm))
Houses: 4,486 (4,261 occupied: 3,682 owner occupied, 579 renter occupied)
| % of renters here: | 14% |
| State: | 34% |
Housing density: 119 houses/condos per square mile
Median price asked for vacant for-sale houses and condos in 2022 in this county: $251,692.
Median contract rent in 2022: $1,215 (lower quartile is $829, upper quartile is $1,607)
Median rent asked for vacant for-rent units in 2022: $1,443
Median gross rent in Coventry, CT in 2022: $1,423
Housing units in Coventry with a mortgage: 2,682 (182 second mortgage, 417 home equity loan, 0 both second mortgage and home equity loan)
Houses without a mortgage: 642
Compare current foreclosures near Coventry, CT:
| Photo | Address | Area | Beds / Baths | Price | Details |
|---|---|---|---|---|---|

|
#1
Merrow Rd Apt 146
Coventry, CT 06238
|
1,230 sq. feet
|
1 baths 2 beds |
show details | |

|
#2
Parker Bridge Rd
Coventry, CT 06238
|
1,382 sq. feet
|
2 baths 2 beds |
show details | |

|
#3
South St
Coventry, CT 06238
|
1,821 sq. feet
|
2 baths 3 beds |
show details | |

|
#4
High St
Coventry, CT 06238
|
913 sq. feet
|
1 baths 3 beds |
show details | |

|
#5
South St
Coventry, CT 06238
|
1,529 sq. feet
|
1 baths 4 beds |
show details | |

|
#6
Pine Knoll Rd
Coventry, CT 06238
|
1,836 sq. feet
|
2 baths 3 beds |
show details | |

|
#7
Newberry Rd
South Windsor, CT 06074
|
3,386 sq. feet
|
2 baths 4 beds |
$649,900
|
show details |

|
#8
Kozley Rd
Tolland, CT 06084
|
1,132 sq. feet
|
2 baths 3 beds |
$264,900
|
show details |

|
#9
Shares Ln
South Windsor, CT 06074
|
1,850 sq. feet
|
2 baths 4 beds |
$365,000
|
show details |

|
#10
Tolland Ave
Stafford Springs, CT 06076
|
896 sq. feet
|
1 baths 3 beds |
$100,000
|
show details |
| Photo | Address | Area | Beds / Baths | Price | Details |
|---|---|---|---|---|---|

|
#11
Reservoir Rd
Vernon Rockville, CT 06066
|
1,288 sq. feet
|
2 baths 3 beds |
$379,900
|
show details |

|
#12
Irving St
Manchester, CT 06042
|
1,335 sq. feet
|
2 baths 3 beds |
$251,750
|
show details |

|
#13
Saville St
Windsor, CT 06095
|
1,181 sq. feet
|
2 baths 3 beds |
show details | |

|
#14
New London Rd
Colchester, CT 06415
|
1,938 sq. feet
|
3 baths 3 beds |
show details | |

|
#15
Willimantic Rd
Chaplin, CT 06235
|
2,332 sq. feet
|
3 baths 5 beds |
show details | |

|
#16
Thompson Rd # 2g
Manchester, CT 06040
|
734 sq. feet
|
1 baths 1 beds |
show details | |

|
#17
Mountain Rd
Colchester, CT 06415
|
3,158 sq. feet
|
3 baths 3 beds |
show details | |

|
#18
Huntington Rd
Scotland, CT 06264
|
960 sq. feet
|
1 baths 3 beds |
show details | |

|
#19
High St
South Windsor, CT 06074
|
1,338 sq. feet
|
2 baths 3 beds |
show details | |

|
#20
Greenwood Dr
Manchester, CT 06042
|
750 sq. feet
|
1 baths 2 beds |
show details |
| Photo | Address | Area | Beds / Baths | Price | Details |
|---|---|---|---|---|---|

|
#21
Lennys Ln
Hampton, CT 06247
|
1,402 sq. feet
|
2 baths 4 beds |
show details | |

|
#22
Hollister Dr
East Hartford, CT 06118
|
1,300 sq. feet
|
1 baths 3 beds |
show details | |

|
#23
Summer St
Manchester, CT 06040
|
2,418 sq. feet
|
2 baths 6 beds |
show details | |

|
#24
Main St
Somers, CT 06071
|
3,092 sq. feet
|
2 baths 3 beds |
show details | |

|
#25
Donahue Ln # 1
Manchester, CT 06042
|
1,240 sq. feet
|
1 baths 2 beds |
show details | |

|
#26
Llynwood Dr
Bolton, CT 06043
|
1,335 sq. feet
|
1 baths 4 beds |
show details | |

|
#27
Dillenback Rd
Somers, CT 06071
|
3,358 sq. feet
|
3 baths 4 beds |
show details | |

|
#28
Hammond Ct
Colchester, CT 06415
|
1,152 sq. feet
|
1 baths 3 beds |
show details | |

|
#29
Holbrook Ave
Willimantic, CT 06226
|
1,536 sq. feet
|
2 baths 4 beds |
show details | |

|
#30
Hope Valley Rd
Amston, CT 06231
|
2,128 sq. feet
|
2 baths 3 beds |
show details |
| Photo | Address | Area | Beds / Baths | Price | Details |
|---|---|---|---|---|---|

|
#31
Jones Hollow Rd
Marlborough, CT 06447
|
1,984 sq. feet
|
2 baths 3 beds |
show details | |

|
#32
Circle Dr
Mansfield Center, CT 06250
|
1,152 sq. feet
|
1 baths 3 beds |
show details | |

|
#33
Mansfield Ave
Willimantic, CT 06226
|
920 sq. feet
|
1 baths 3 beds |
show details | |

|
#34
Burke St
East Hartford, CT 06118
|
1,058 sq. feet
|
1 baths 3 beds |
show details | |

|
#35
Blair Rd
Willington, CT 06279
|
1,056 sq. feet
|
1 baths 3 beds |
show details | |

|
#36
Garland Dr # 7d
Glastonbury, CT 06033
|
1,152 sq. feet
|
1 baths 2 beds |
show details | |

|
#37
Garland Dr
Glastonbury, CT 06033
|
1,152 sq. feet
|
1 baths 2 beds |
show details | |

|
#38
Conestoga Way
Glastonbury, CT 06033
|
1,360 sq. feet
|
2 baths 3 beds |
show details | |

|
#39
College Dr
East Hartford, CT 06108
|
1,735 sq. feet
|
2 baths 3 beds |
show details | |

|
#40
Summerset Dr
East Hartford, CT 06118
|
1,869 sq. feet
|
2 baths 3 beds |
show details |
| Photo | Address | Area | Beds / Baths | Price | Details |
|---|---|---|---|---|---|

|
#41
Forest St
East Hartford, CT 06118
|
1,040 sq. feet
|
2 baths 3 beds |
show details | |

|
#42
Chester St
East Hartford, CT 06108
|
1,344 sq. feet
|
2 baths 3 beds |
show details | |

|
#43
Hillcrest Rd
East Hartford, CT 06108
|
1,882 sq. feet
|
1 baths 4 beds |
show details | |

|
#44
Saner Rd
Marlborough, CT 06447
|
2,386 sq. feet
|
2 baths 4 beds |
show details | |

|
#45
Higbie Dr
East Hartford, CT 06108
|
1,081 sq. feet
|
2 baths 2 beds |
show details | |

|
#46
Stafford St
Stafford Springs, CT 06076
|
1,351 sq. feet
|
2 baths 3 beds |
show details | |

|
#47
Blueberry Cir
Ellington, CT 06029
|
1,434 sq. feet
|
1 baths 4 beds |
show details | |

|
#48
Tolland Ave
Stafford Springs, CT 06076
|
1,076 sq. feet
|
1 baths 2 beds |
show details | |

|
#49
Mulcahy Dr
East Hartford, CT 06118
|
1,703 sq. feet
|
1 baths 3 beds |
show details | |

|
Check over 1 million property listings on Foreclosure.com!
|
browse all offers | |||
Latest news about housing in Coventry, CT collected exclusively by city-data.com from local newspapers, TV, and radio stations

 | Current Real estate markets (3987 replies) |
| 2024 Connecticut Town Tournament VI (Celebrating the 10-Year Anniversary & Dazzleman's Memorial) (1007 replies) |
| Buying a house - crumbling foundation issue (10 replies) |
| Connecticut TOWN TOURNAMENT V (2022) (831 replies) |
| Are there any affordable apartments on the East Side of the River? (7 replies) |
| Lakefront home near Plainfield (17 replies) |

Household type by relationship:
Households: 136,574- In family households: 112,649 (26,574 male householders, 10,133 female householders)
29,922 spouses, 38,844 children (36,460 natural, 1,015 adopted, 1,369 stepchildren), 1,606 grandchildren, 688 brothers or sisters, 931 parents, foster children, 693 other relatives, 2,519 non-relatives
- In nonfamily households: 23,925 (8,485 male householders (5,980 living alone)), 9,285 female householders (7,198 living alone)), 6,155 nonrelatives
- In group quarters: 16,117 (4,028 institutionalized population)
24,754 married couples with children.
5,247 single-parent households (1,309 men, 3,938 women).
93.0% of residents of Coventry speak English at home.
1.4% of residents speak Spanish at home (79% speak English very well, 21% speak English well).
5.0% of residents speak other Indo-European language at home (77% speak English very well, 19% speak English well, 4% speak English not well).
0.4% of residents speak Asian or Pacific Island language at home (49% speak English very well, 51% speak English well).
0.2% of residents speak other language at home (100% speak English very well).
Foreign born population: 894 (6.9%)
(76.2% of them are naturalized citizens)
| Here: | 6.8 |
| State: | 6.5 |
| Here: | 4.4 |
| State: | 4.0 |

- Bedrooms in owner-occupied houses and condos in Coventry, Connecticut
- 0no bedroom
- 381 bedroom
- 7122 bedrooms
- 2,2273 bedrooms
- 6354 bedrooms
- 705+ bedrooms

- Bedrooms in renter-occupied apartments in Coventry, Connecticut
- 17no bedroom
- 1721 bedroom
- 2852 bedrooms
- 623 bedrooms
- 374 bedrooms
- 65+ bedrooms

- Cars and other vehicles available in Coventry in owner-occupied houses/condos
- 71no vehicle
- 6261 vehicle
- 1,9742 vehicles
- 6873 vehicles
- 2734 vehicles
- 515+ vehicles

- Cars and other vehicles available in Coventry in renter-occupied apartments
- 71no vehicle
- 2431 vehicle
- 1772 vehicles
- 493 vehicles
- 314 vehicles
- 85+ vehicles

- Rooms in owner-occupied houses in Coventry, Connecticut
- 01 room
- 02 rooms
- 223 rooms
- 2194 rooms
- 7775 rooms
- 1,0366 rooms
- 7977 rooms
- 5378 rooms
- 2949+ rooms

- Rooms in renter-occupied apartments in Coventry, Connecticut
- 91 room
- 952 rooms
- 613 rooms
- 2134 rooms
- 1085 rooms
- 636 rooms
- 247 rooms
- 08 rooms
- 69+ rooms


Coventry, CT household income distribution

- 43,890Less than $10,000
- 49,466$10,000 to $19,999
- 56,020$20,000 to $29,999
- 50,317$30,000 to $39,999
- 49,968$40,000 to $49,999
- 49,023$50,000 to $59,999
- 68,761$60,000 to $74,999
- 107,358$75,000 to $99,999
- 83,644$100,000 to $124,999
- 66,800$125,000 to $149,999
- 91,399$150,000 to $199,999
- 136,690$200,000 or more

Percentage of workers working in this county: 36.4%
Number of people working at home: 1,197 (17.2% of all workers)
Travel time to work (commute)
- Less than 5 minutes: 123
- 5 to 9 minutes: 412
- 10 to 14 minutes: 640
- 15 to 19 minutes: 725
- 20 to 24 minutes: 922
- 25 to 29 minutes: 567
- 30 to 34 minutes: 1,145
- 35 to 39 minutes: 321
- 40 to 44 minutes: 290
- 45 to 59 minutes: 489
- 60 to 89 minutes: 257
- 90 or more minutes: 77
Means of transportation to work:
- Drove a car alone: 5,409 (88.4%)
- Carpooled: 421 (6.9%)
- Bus or trolley bus: 51 (0.8%)
- Motorcycle: 6 (0.1%)
- Walked: 65 (1.1%)
- Other means: 16 (0.3%)
- Worked at home: 152 (2.5%)


- Year of entry for the foreign-born population in Coventry, Connecticut
- 791995 to March 2000
- 211990 to 1994
- 181985 to 1989
- 511980 to 1984
- 341975 to 1979
- 411970 to 1974
- 661965 to 1969
- 250Before 1965

First ancestries reported:
- Irish: 2,505 (17.1%)
- English: 1,879 (12.8%)
- German: 1,843 (12.6%)
- French: 1,591 (10.9%)
- Italian: 1,525 (10.4%)
- Polish: 1,158 (7.9%)
- Other: 931 (6.4%)
- French Canadian: 694 (4.7%)
- Swedish: 391 (2.7%)
- United States: 323 (2.2%)
- Scottish: 320 (2.2%)
- Scotch-Irish: 242 (1.7%)
- Portuguese: 183 (1.3%)
- Lithuanian: 176 (1.2%)
- Dutch: 115 (0.8%)
- Russian: 111 (0.8%)
- Welsh: 105 (0.7%)
- Ukrainian: 100 (0.7%)
- Hungarian: 95 (0.6%)
- Norwegian: 83 (0.6%)
- Danish: 59 (0.4%)
- Greek: 58 (0.4%)
- Czech: 51 (0.3%)
- Swiss: 41 (0.3%)
- Slovak: 22 (0.2%)
- Arab: 18 (0.1%)
- West Indian: 16 (0.1%)
Most common places of birth for foreign-born residents (%):
| Coventry: | 21.8% (122) |
| Connecticut: | 5.2% (19,083) |
| Coventry: | 9.5% (53) |
| Connecticut: | 4.4% (16,395) |
| Coventry: | 9.5% (53) |
| Connecticut: | 3.1% (11,432) |
| Coventry: | 6.1% (34) |
| Connecticut: | 3.6% (13,234) |
| Coventry: | 5.9% (33) |
| Connecticut: | 0.7% (2,646) |
| Coventry: | 5.7% (32) |
| Connecticut: | 6.9% (25,507) |
| Coventry: | 5.4% (30) |
| Connecticut: | 4.1% (15,108) |
| Coventry: | 3.0% (17) |
| Connecticut: | 7.0% (26,023) |
| Coventry: | 2.9% (16) |
| Connecticut: | 0.4% (1,463) |
| Coventry: | 2.9% (16) |
| Connecticut: | 1.8% (6,680) |
| Coventry: | 2.7% (15) |
| Connecticut: | 0.8% (2,940) |
| Coventry: | 2.5% (14) |
| Connecticut: | 1.2% (4,344) |
| Coventry: | 2.5% (14) |
| Connecticut: | 2.1% (7,596) |
| Coventry: | 2.1% (12) |
| Connecticut: | 0.7% (2,742) |
| Coventry: | 2.1% (12) |
| Connecticut: | 1.5% (5,508) |
| Coventry: | 1.6% (9) |
| Connecticut: | 0.5% (1,983) |
| Coventry: | 1.6% (9) |
| Connecticut: | 1.4% (5,021) |
| Coventry: | 1.6% (9) |
| Connecticut: | 0.3% (982) |
| Coventry: | 1.6% (9) |
| Connecticut: | 0.4% (1,527) |
Place of birth for U.S.-born residents:
- This state: 8,018
- Other state: 2,872
- Northeast: 2,016
- Midwest: 408
- South: 291
- West: 157
69% of Coventry residents lived in the same house 5 years ago.
Out of people who lived in different houses, 43% lived in this county.
Out of people who lived in different counties, 74% lived in Connecticut.
Education attainment for males 25 years and older:
- No schooling: 0
- Nursery to 4th grade: 0
- 5th and 6th grade: 0
- 7th and 8th grade: 49
- 9th grade: 43
- 10th grade: 50
- 11th grade: 64
- 12th grade, no diploma: 137
- High school graduate (or equivalency): 1,302
- Less than 1 year of college: 254
- Some college more than 1 year, no degree: 574
- Associate degree: 266
- Bachelor's degree: 598
- Master's degree: 284
- Professional school degree: 81
- Doctorate degree: 106

Education attainment for females 25 years and older:
- No schooling: 8
- Nursery to 4th grade: 0
- 5th and 6th grade: 0
- 7th and 8th grade: 52
- 9th grade: 17
- 10th grade: 43
- 11th grade: 28
- 12th grade, no diploma: 150
- High school graduate (or equivalency): 1,184
- Less than 1 year of college: 203
- Some college more than 1 year, no degree: 675
- Associate degree: 426
- Bachelor's degree: 641
- Master's degree: 411
- Professional school degree: 32
- Doctorate degree: 14


Housing units in structures:
- One, detached: 4,074
- One, attached: 21
- Two: 109
- 3 or 4: 142
- 5 to 9: 84
- 10 to 19: 36
- 50 or more: 14
- Mobile homes: 6
Median worth of mobile homes: $18,623
Housing units lacking complete kitchen facilities: 0.2%

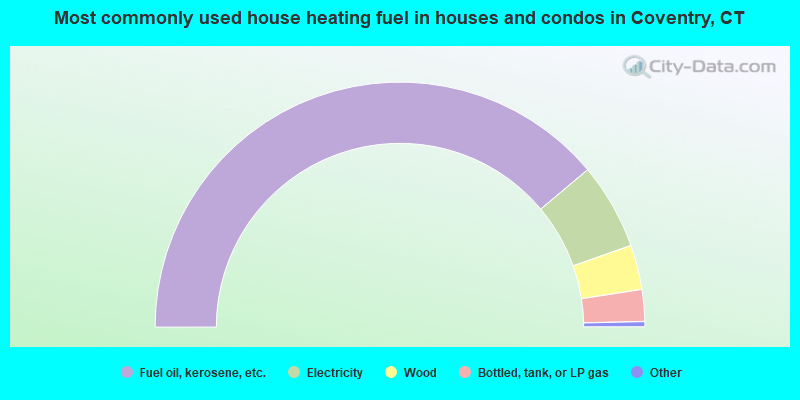
- 77.8%Fuel oil, kerosene, etc.
- 11.4%Electricity
- 5.9%Wood
- 4.2%Bottled, tank, or LP gas
- 0.5%Coal or coke
- 0.2%Other fuel
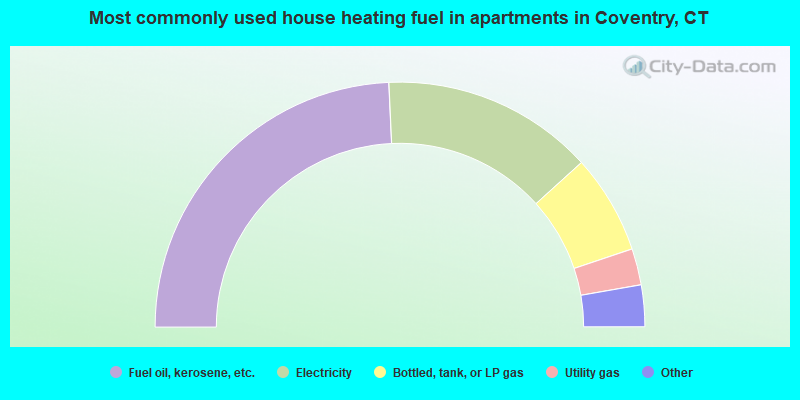
- 48.5%Fuel oil, kerosene, etc.
- 28.0%Electricity
- 13.1%Bottled, tank, or LP gas
- 4.8%Utility gas
- 2.4%Wood
- 2.4%Other fuel
- 0.7%Coal or coke
Private vs. public school enrollment:
| Here: | 7.1% |
| Connecticut: | 9.9% |
| Here: | 7.8% |
| Connecticut: | 11.0% |
| Here: | 11.3% |
| Connecticut: | 33.4% |


