Housing density: 2,051 houses/condos per square mile
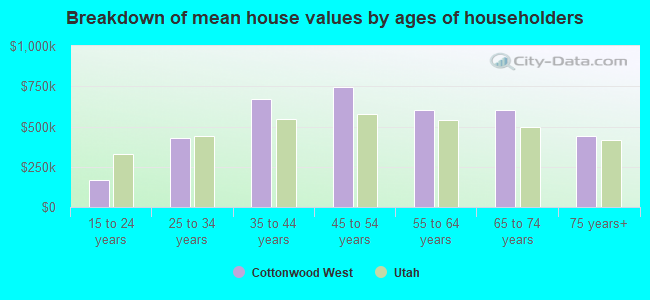
Median price asked for vacant for-sale houses and condos in 2022 in this county: $719,617.
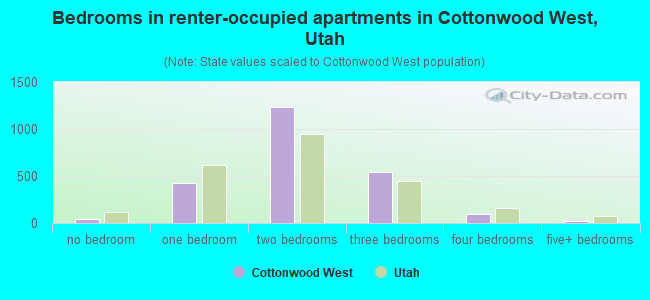
Median contract rent in 2022: $1,562 (lower quartile is $1,303, upper quartile is over $2,000)
Median rent asked for vacant for-rent units in 2022: $1,690
Median gross rent in Cottonwood West, UT in 2022: $1,638
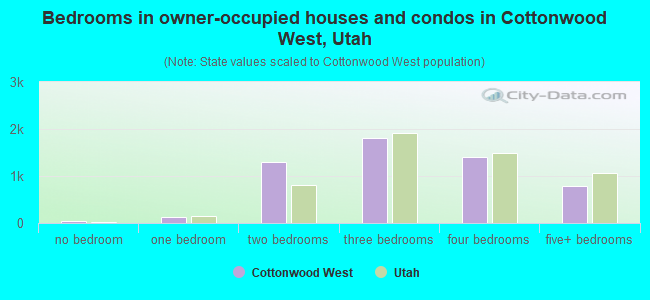
Housing units in Cottonwood West with a mortgage: 2,550 (397 second mortgage, 389 home equity loan, 17 both second mortgage and home equity loan) Houses without a mortgage: 1,691
Compare current foreclosures near Cottonwood West, UT:
In family households: 879,880 (178,461 male householders, 64,165 female householders)
187,678 spouses, 347,268 children (321,676 natural, 9,572 adopted, 16,020 stepchildren), 25,511 grandchildren, 12,209 brothers or sisters, 7,940 parents, foster children, 18,887 other relatives, 27,608 non-relatives
In nonfamily households: 135,769 (49,607 male householders (35,052 living alone)), 50,389 female householders (40,012 living alone)), 35,773 nonrelatives
In group quarters: 14,006 (9,420 institutionalized population)
205,311 married couples with children.
43,285 single-parent households (10,357 men, 32,928 women).
89.7% of residents of Cottonwood West speak English at home.
3.7% of residents speak Spanish at home (72% speak English very well, 18% speak English well, 9% speak English not well, 2% don't speak English at all).
5.0% of residents speak other Indo-European language at home (67% speak English very well, 26% speak English well, 6% speak English not well, 1% don't speak English at all).
1.6% of residents speak Asian or Pacific Island language at home (74% speak English very well, 17% speak English well, 10% speak English not well).
0.1% of residents speak other language at home (100% speak English very well).
Foreign born population: 1,981 (8.1%)
(60.2% of them are naturalized citizens)
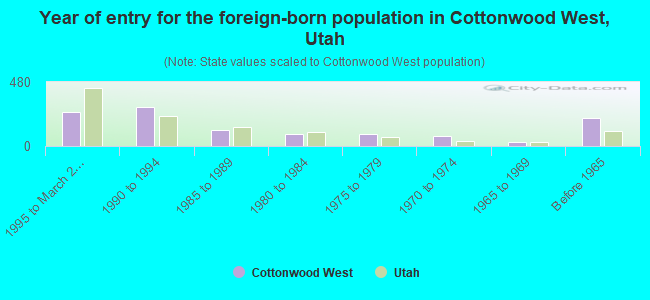
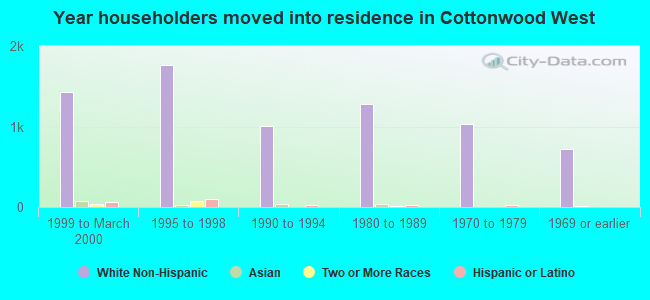
Year of entry for the foreign-born population in Cottonwood West, Utah
2531995 to March 2000
2911990 to 1994
1211985 to 1989
921980 to 1984
881975 to 1979
741970 to 1974
291965 to 1969
207Before 1965
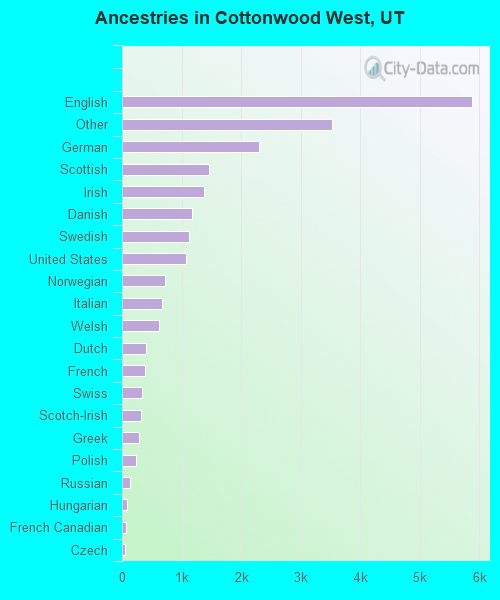
First ancestries reported:
English: 5,867 (26.2%)
Other: 3,525 (15.7%)
German: 2,303 (10.3%)
Scottish: 1,456 (6.5%)
Irish: 1,378 (6.2%)
Danish: 1,175 (5.2%)
Swedish: 1,127 (5.0%)
United States: 1,067 (4.8%)
Norwegian: 719 (3.2%)
Italian: 672 (3.0%)
Welsh: 619 (2.8%)
Dutch: 411 (1.8%)
French: 394 (1.8%)
Swiss: 328 (1.5%)
Scotch-Irish: 327 (1.5%)
Greek: 287 (1.3%)
Polish: 243 (1.1%)
Russian: 129 (0.6%)
Hungarian: 87 (0.4%)
French Canadian: 71 (0.3%)
Czech: 57 (0.3%)
Ukrainian: 39 (0.2%)
Portuguese: 36 (0.2%)
Subsaharan African: 32 (0.1%)
Arab: 31 (0.1%)
West Indian: 15 (0.07%)
Slovak: 10 (0.04%)
Most common places of birth for foreign-born residents (%):
Mexico
Cottonwood West:
9.8% (113)
Utah:
41.9% (66,478)
India
Cottonwood West:
9.6% (111)
Utah:
1.3% (2,030)
Canada
Cottonwood West:
8.1% (94)
Utah:
4.9% (7,722)
Germany
Cottonwood West:
6.8% (78)
Utah:
3.2% (5,086)
United Kingdom
Cottonwood West:
6.7% (77)
Utah:
3.0% (4,784)
Korea
Cottonwood West:
5.9% (68)
Utah:
1.9% (3,013)
Philippines
Cottonwood West:
4.8% (56)
Utah:
1.7% (2,680)
Other Eastern Europe
Cottonwood West:
4.8% (55)
Utah:
0.6% (983)
Bosnia and Herzegovina
Cottonwood West:
4.3% (50)
Utah:
1.6% (2,526)
Russia
Cottonwood West:
3.2% (37)
Utah:
0.9% (1,392)
Iran
Cottonwood West:
3.1% (36)
Utah:
0.7% (1,050)
Guatemala
Cottonwood West:
2.9% (34)
Utah:
1.5% (2,389)
Sweden
Cottonwood West:
2.8% (32)
Utah:
0.4% (613)
Other South America
Cottonwood West:
2.3% (27)
Utah:
0.2% (315)
Brazil
Cottonwood West:
1.9% (22)
Utah:
1.6% (2,507)
Peru
Cottonwood West:
1.8% (21)
Utah:
1.5% (2,357)
France
Cottonwood West:
1.7% (20)
Utah:
0.5% (839)
Other Northern Europe
Cottonwood West:
1.6% (19)
Utah:
1.0% (1,655)
Italy
Cottonwood West:
1.6% (19)
Utah:
0.4% (580)
Place of birth for U.S.-born residents:
This state: 12,126
Other state: 5,196
Northeast: 633
Midwest: 930
South: 547
West: 3,086
57% of Cottonwood West residents lived in the same house 5 years ago. Out of people who lived in different houses, 68% lived in this county. Out of people who lived in different counties, 30% lived in Utah.
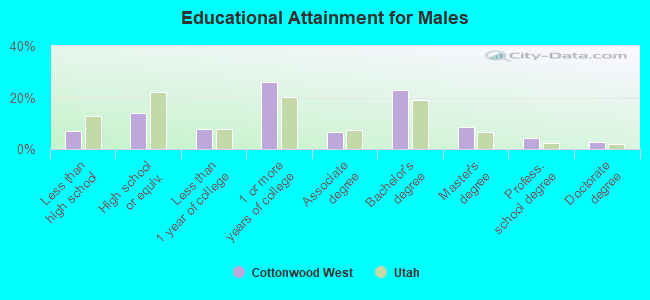
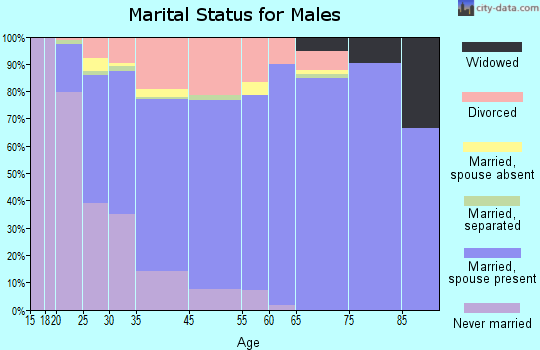
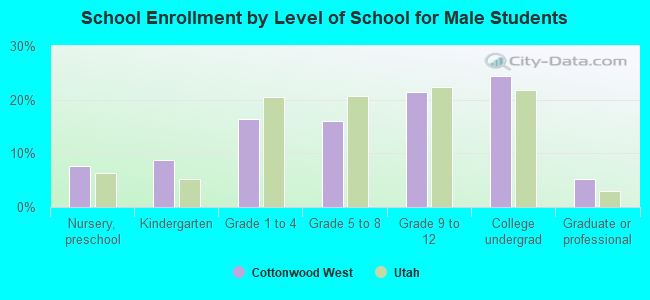
Education attainment for males 25 years and older:
No schooling: 0
Nursery to 4th grade: 0
5th and 6th grade: 0
7th and 8th grade: 26
9th grade: 62
10th grade: 66
11th grade: 86
12th grade, no diploma: 159
High school graduate (or equivalency): 819
Less than 1 year of college: 463
Some college more than 1 year, no degree: 1,518
Associate degree: 379
Bachelor's degree: 1,350
Master's degree: 505
Professional school degree: 260
Doctorate degree: 156
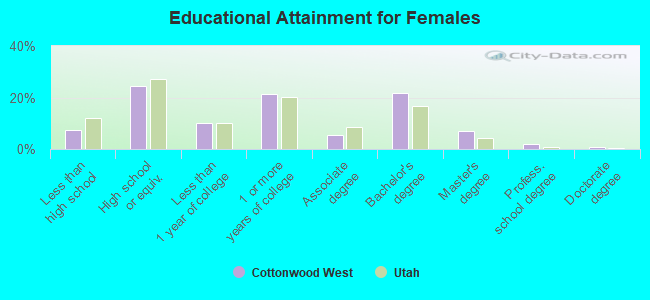
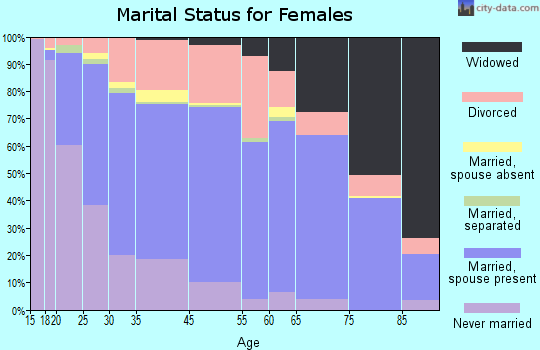
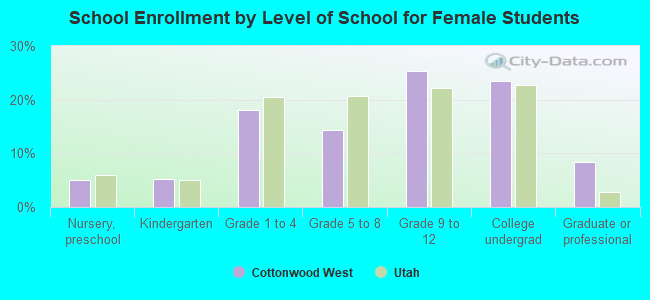
Education attainment for females 25 years and older:
No schooling: 19
Nursery to 4th grade: 6
5th and 6th grade: 11
7th and 8th grade: 62
9th grade: 14
10th grade: 104
11th grade: 113
12th grade, no diploma: 197
High school graduate (or equivalency): 1,714
Less than 1 year of college: 709
Some college more than 1 year, no degree: 1,487
Associate degree: 372
Bachelor's degree: 1,504
Master's degree: 485
Professional school degree: 126
Doctorate degree: 48
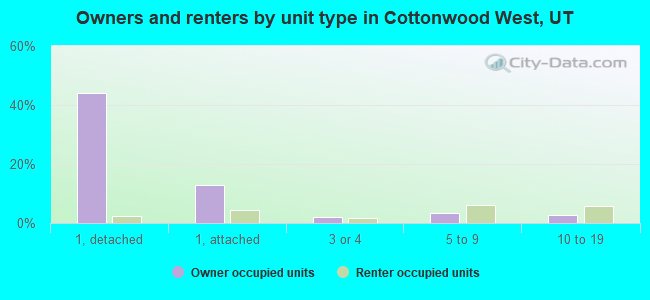
Housing units in structures:
One, detached: 3,719
One, attached: 1,380
Two: 329
3 or 4: 307
5 to 9: 901
10 to 19: 748
20 to 49: 192
50 or more: 341
Mobile homes: 334
Median worth of mobile homes: $88,986
Housing units lacking complete plumbing facilities: 0.1%
Housing units lacking complete kitchen facilities: 0.1%