Corvallis, OR (Oregon) Houses and Residents
Estimated median house or condo value in 2022: $513,283 (it was $154,700 in 2000 )
Corvallis:
$513,283Oregon:
$475,600
Lower value quartile - upper value quartile: $389,195 - $638,036Mean price in 2022: Detached houses: $516,319 Here:
$516,319State:
$562,872
Townhouses or other attached units: $369,576 Here:
$369,576State:
$463,029
In 2-unit structures: $386,208 Here:
$386,208State:
$505,105
In 3-to-4-unit structures: $460,462 Here:
$460,462State:
$419,673
In 5-or-more-unit structures: $265,083 Here:
$265,083State:
$420,389
Mobile homes: $65,086 Here:
$65,086State:
$214,044
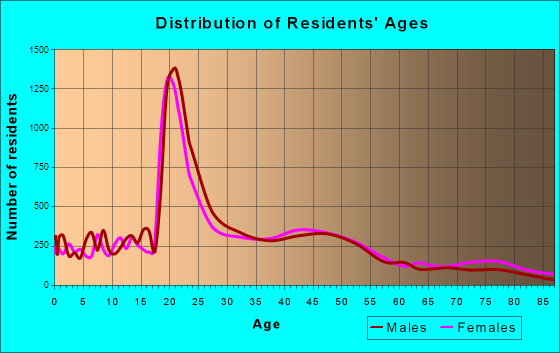
Total population: 54,953 (Urban population: 49,004, Rural population: 180 (all nonfarm) )
Houses: 26,164 (24,637 occupied: 10,158 owner occupied, 14,589 renter occupied )
% of renters here:
59%State:
37%
Housing density: 1,923 houses/condos per square mile
Median price asked for vacant for-sale houses and condos in 2022: $526,150.
Median contract rent in 2022: $1,191 (lower quartile is $959, upper quartile is $1,549)
Median rent asked for vacant for-rent units in 2022: $1,300
Median gross rent in Corvallis, OR in 2022: $1,272
Housing units in Corvallis with a mortgage: 5,193 (474 second mortgage, 35 home equity loan, 271 both second mortgage and home equity loan )Houses without a mortgage: 217
Median household income for houses/condos with a mortgage: $104,079
Median household income for apartments without a mortgage: $109,506
Median monthly housing costs: $1,227
Data:
Median house or condo value ($)
Median house or condo value ($ change since 2000)
Median house or condo value ($) - White
Median house or condo value ($) - Black or African American
Median house or condo value ($) - Asian
Median house or condo value ($) - Hispanic or Latino
Median house or condo value ($) - American Indian and Alaska Native
Median house or condo value ($) - Multirace
Median house or condo value ($) - Other Race
Median price asked for mobile homes ($)
Household density (households per square mile)
Mean house or condo value by units in structure - 1, detached ($)
Mean house or condo value by units in structure - 1, attached ($)
Mean house or condo value by units in structure - 2 ($)
Mean house or condo value by units in structure by units in structure - 3 or 4 ($)
Mean house or condo value by units in structure - 5 or more ($)
Mean house or condo value by units in structure - Boat, RV, van, etc. ($)
Mean house or condo value by units in structure - Mobile home ($)
Median contract rent ($)
Median contract rent - Lower quartile ($)
Median contract rent - Upper quartile ($)
Median gross rent ($)
Urban houses (%)
Rural houses (%)
Houses occupied (%)
Houses occupied (% change since 2000)
Houses owner occupied (%)
Houses owner occupied (% change since 2000)
Houses renter occupied (%)
Houses renter occupied (% change since 2000)
Vacant housing units - For rent (%)
Vacant housing units - For rent (% change since 2000)
Vacant housing units - For sale only (%)
Vacant housing units - For sale only (% change since 2000)
Vacant housing units - Rented or sold, not occupied (%)
Vacant housing units - Rented or sold, not occupied (% change since 2000)
Vacant housing units - For seasonal, recreational, or occasional use (%)
Vacant housing units - For seasonal, recreational, or occasional use (% change since 2000)
Vacant housing units - For migrant workers (%)
Vacant housing units - For migrant workers (% change since 2000)
Vacant housing units - Other vacant (%)
Vacant housing units - Other vacant (% change since 2000)
Median monthly housing costs ($)
Median household income for houses/condos with a mortgage ($)
Median household income for houses/condos without a mortgage ($)
Median household income ($)
Median household income ($) - White
Median household income ($) - Black or African American
Median household income ($) - Asian
Median household income ($) - Hispanic or Latino
Median household income ($) - American Indian and Alaska Native
Median household income ($) - Multirace
Median household income ($) - Other Race
Mortgage status - with mortgage (%)
Mortgage status - with second mortgage (%)
Mortgage status - with home equity loan (%)
Mortgage status - with both second mortgage and home equity loan (%)
Mortgage status - without a mortgage (%)
Median year house/condo built
Median year apartment built
Household type by relationship - Male householder living alone (%)
Household type by relationship - Male householder not living alone (%)
Household type by relationship - Female householder living alone (%)
Household type by relationship - Female householder not living alone (%)
Household type by relationship - Opposite-Sex spouse (%)
Household type by relationship - Same-Sex spouse (%)
Household type by relationship - Opposite-Sex unmarried partner (%)
Household type by relationship - Same-Sex unmarried partner (%)
Household type by relationship - In group quarters (%)
Size of family households - 2-person household (%)
Size of family households - 3-person household (%)
Size of family households - 4-person household (%)
Size of family households - 5-person household (%)
Size of family households - 6-person household (%)
Size of family households - 7-or-more-person household (%)
Size of nonfamily households - 1-person household (%)
Size of nonfamily households - 2-person household (%)
Size of nonfamily households - 3-person household (%)
Size of nonfamily households - 4-person household (%)
Size of nonfamily households - 5-person household (%)
Size of nonfamily households - 6-person household (%)
Size of nonfamily households - 7-or-moreperson household (%)
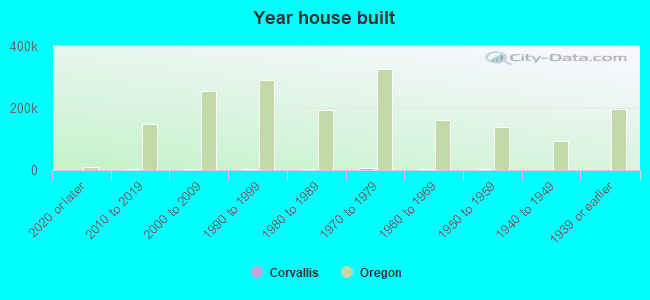
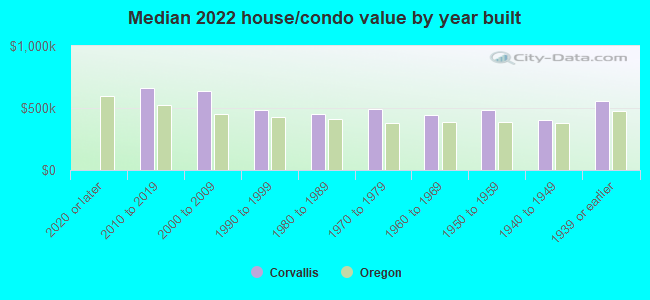
Year house built - Built 2010 or later (%)
Year house built - Built 2000 to 2009 (%)
Year house built - Built 1990 to 1999 (%)
Year house built - Built 1980 to 1989 (%)
Year house built - Built 1970 to 1979 (%)
Year house built - Built 1960 to 1969 (%)
Year house built - Built 1950 to 1959 (%)
Year house built - Built 1940 to 1949 (%)
Year house built - Built 1939 or earlier (%)
Median number of rooms in houses and condos
Median number of rooms in apartments
Median number of bedrooms in owner occupied houses
Mean number of bedrooms in owner occupied houses
Median number of bedrooms in renter occupied houses
Mean number of bedrooms in renter occupied houses
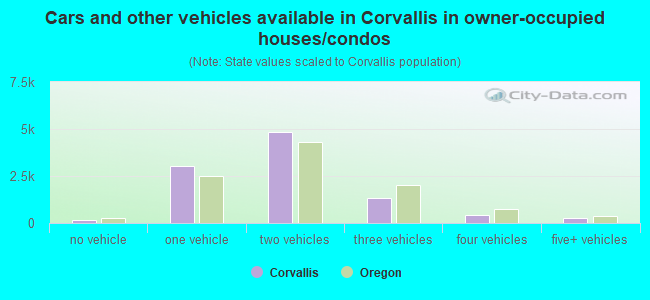
Median number of vehichles in owner occupied houses
Mean number of vehichles in owner occupied houses
Median number of vehichles in renter occupied houses
Mean number of vehichles in renter occupied houses
Rooms in owner-occupied houses - 1 room (%)
Rooms in owner-occupied houses - 2 rooms (%)
Rooms in owner-occupied houses - 3 rooms (%)
Rooms in owner-occupied houses - 4 rooms (%)
Rooms in owner-occupied houses - 5 rooms (%)
Rooms in owner-occupied houses - 6 rooms (%)
Rooms in owner-occupied houses - 7 rooms (%)
Rooms in owner-occupied houses - 8 rooms (%)
Rooms in owner-occupied houses - 9+ rooms (%)
Rooms in renter-occupied houses - 1 room (%)
Rooms in renter-occupied houses - 2 rooms (%)
Rooms in renter-occupied houses - 3 rooms (%)
Rooms in renter-occupied houses - 4 rooms (%)
Rooms in renter-occupied houses - 5 rooms (%)
Rooms in renter-occupied houses - 6 rooms (%)
Rooms in renter-occupied houses - 7 rooms (%)
Rooms in renter-occupied houses - 8 rooms (%)
Rooms in renter-occupied houses - 9+ rooms (%)
Bedrooms in owner-occupied houses - no bedrooms (%)
Bedrooms in owner-occupied houses - 1 bedroom (%)
Bedrooms in owner-occupied houses - 2 bedrooms (%)
Bedrooms in owner-occupied houses - 3 bedrooms (%)
Bedrooms in owner-occupied houses - 4 bedrooms (%)
Bedrooms in owner-occupied houses - 5+ bedrooms (%)
Bedrooms in renter-occupied houses - no bedrooms (%)
Bedrooms in renter-occupied houses - 1 bedroom (%)
Bedrooms in renter-occupied houses - 2 bedrooms (%)
Bedrooms in renter-occupied houses - 3 bedrooms (%)
Bedrooms in renter-occupied houses - 4 bedrooms (%)
Bedrooms in renter-occupied houses - 5+ bedrooms (%)
Vehicles available in owner-occupied houses - no vehicle available (%)
Vehicles available in owner-occupied houses - 1 vehicle available(%)
Vehicles available in owner-occupied houses - 2 Vehicles available (%)
Vehicles available in owner-occupied houses - 3 Vehicles available (%)
Vehicles available in owner-occupied houses - 4 Vehicles available (%)
Vehicles available in owner-occupied houses - 5+ Vehicles available (%)
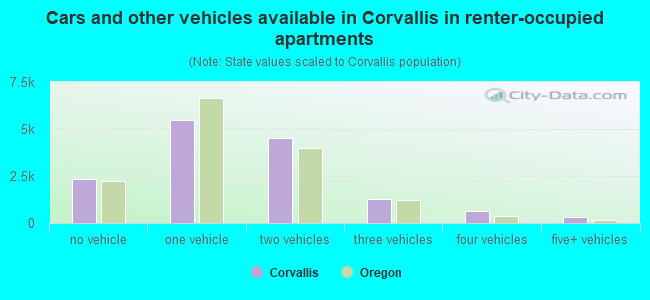
Vehicles available in renter-occupied houses - no vehicle available (%)
Vehicles available in renter-occupied houses - 1 vehicle available (%)
Vehicles available in renter-occupied houses - 2 Vehicles available (%)
Vehicles available in renter-occupied houses - 3 Vehicles available (%)
Vehicles available in renter-occupied houses - 4 Vehicles available (%)
Vehicles available in renter-occupied houses - 5+ Vehicles available (%)
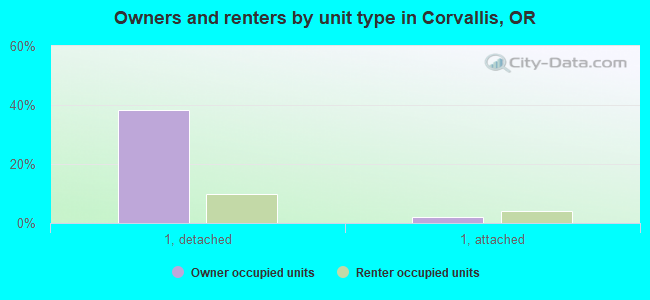
Housing units in structures - 1, detached (%)
Housing units in structures - 1, attached (%)
Housing units in structures - 2 (%)
Housing units in structures - 3 or 4 (%)
Housing units in structures - 5 to 9 (%)
Housing units in structures - 10 to 19 (%)
Housing units in structures - 20 to 49 (%)
Housing units in structures - 50 or more (%)
Housing units in structures - Mobile home (%)
Housing units in structures - Boat, RV, van, etc. (%)
Housing units in structures - Owners - 1, detached (%)
Housing units in structures - Owners - 1, attached (%)
Housing units in structures - Owners - 2 (%)
Housing units in structures - Owners - 3 or 4 (%)
Housing units in structures - Owners - 5 to 9 (%)
Housing units in structures - Owners - 10 to 19 (%)
Housing units in structures - Owners - 20 to 49 (%)
Housing units in structures - Owners - 50 or more (%)
Housing units in structures - Owners - Mobile home (%)
Housing units in structures - Owners - Boat, RV, van, etc. (%)
Housing units in structures - Renters - 1, detached (%)
Housing units in structures - Renters - 1, attached (%)
Housing units in structures - Renters - 2 (%)
Housing units in structures - Renters - 3 or 4 (%)
Housing units in structures - Renters - 5 to 9 (%)
Housing units in structures - Renters - 10 to 19 (%)
Housing units in structures - Renters - 20 to 49 (%)
Housing units in structures - Renters - 50 or more (%)
Housing units in structures - Renters - Mobile home (%)
Housing units in structures - Renters - Boat, RV, van, etc. (%)
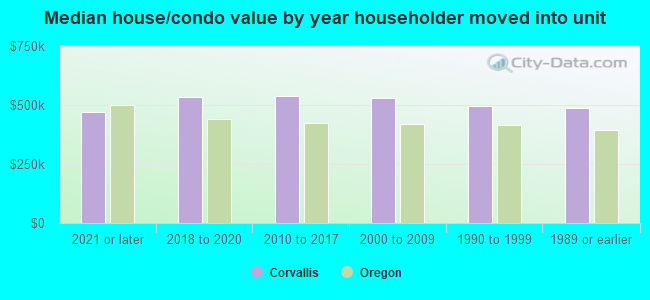
House/condo owner moved in on average (years ago)
Renter moved in on average (years ago)
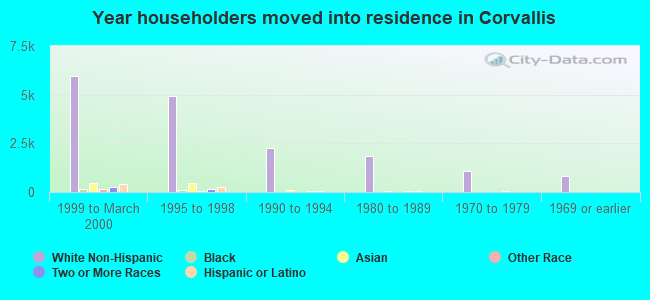
Year householder moved into unit - Moved in 1999 to March 2000 (%)
Year householder moved into unit - Moved in 1999 to March 2000 (%) - White
Year householder moved into unit - Moved in 1999 to March 2000 (%) - Black or African American
Year householder moved into unit - Moved in 1999 to March 2000 (%) - Asian
Year householder moved into unit - Moved in 1999 to March 2000 (%) - Hispanic or Latino
Year householder moved into unit - Moved in 1999 to March 2000 (%) - American Indian and Alaska Native
Year householder moved into unit - Moved in 1999 to March 2000 (%) - Multirace
Year householder moved into unit - Moved in 1999 to March 2000 (%) - Other Race
Year householder moved into unit - Moved in 1995 to 1998 (%)
Year householder moved into unit - Moved in 1995 to 1998 (%) - White
Year householder moved into unit - Moved in 1995 to 1998 (%) - Black or African American
Year householder moved into unit - Moved in 1995 to 1998 (%) - Asian
Year householder moved into unit - Moved in 1995 to 1998 (%) - Hispanic or Latino
Year householder moved into unit - Moved in 1995 to 1998 (%) - American Indian and Alaska Native
Year householder moved into unit - Moved in 1995 to 1998 (%) - Multirace
Year householder moved into unit - Moved in 1995 to 1998 (%) - Other Race
Year householder moved into unit - Moved in 1990 to 1994 (%)
Year householder moved into unit - Moved in 1990 to 1994 (%) - White
Year householder moved into unit - Moved in 1990 to 1994 (%) - Black or African American
Year householder moved into unit - Moved in 1990 to 1994 (%) - Asian
Year householder moved into unit - Moved in 1990 to 1994 (%) - Hispanic or Latino
Year householder moved into unit - Moved in 1990 to 1994 (%) - American Indian and Alaska Native
Year householder moved into unit - Moved in 1990 to 1994 (%) - Multirace
Year householder moved into unit - Moved in 1990 to 1994 (%) - Other Race
Year householder moved into unit - Moved in 1980 to 1989 (%)
Year householder moved into unit - Moved in 1980 to 1989 (%) - White
Year householder moved into unit - Moved in 1980 to 1989 (%) - Black or African American
Year householder moved into unit - Moved in 1980 to 1989 (%) - Asian
Year householder moved into unit - Moved in 1980 to 1989 (%) - Hispanic or Latino
Year householder moved into unit - Moved in 1980 to 1989 (%) - American Indian and Alaska Native
Year householder moved into unit - Moved in 1980 to 1989 (%) - Multirace
Year householder moved into unit - Moved in 1980 to 1989 (%) - Other Race
Year householder moved into unit - Moved in 1970 to 1979 (%)
Year householder moved into unit - Moved in 1970 to 1979 (%) - White
Year householder moved into unit - Moved in 1970 to 1979 (%) - Black or African American
Year householder moved into unit - Moved in 1970 to 1979 (%) - Asian
Year householder moved into unit - Moved in 1970 to 1979 (%) - Hispanic or Latino
Year householder moved into unit - Moved in 1970 to 1979 (%) - American Indian and Alaska Native
Year householder moved into unit - Moved in 1970 to 1979 (%) - Multirace
Year householder moved into unit - Moved in 1970 to 1979 (%) - Other Race
Year householder moved into unit - Moved in 1969 or earlier (%)
Year householder moved into unit - Moved in 1969 or earlier (%) - White
Year householder moved into unit - Moved in 1969 or earlier (%) - Black or African American
Year householder moved into unit - Moved in 1969 or earlier (%) - Asian
Year householder moved into unit - Moved in 1969 or earlier (%) - Hispanic or Latino
Year householder moved into unit - Moved in 1969 or earlier (%) - American Indian and Alaska Native
Year householder moved into unit - Moved in 1969 or earlier (%) - Multirace
Year householder moved into unit - Moved in 1969 or earlier (%) - Other Race
Housing units lacking complete plumbing facilities (%)
Housing units lacking complete kitchen facilities (%)
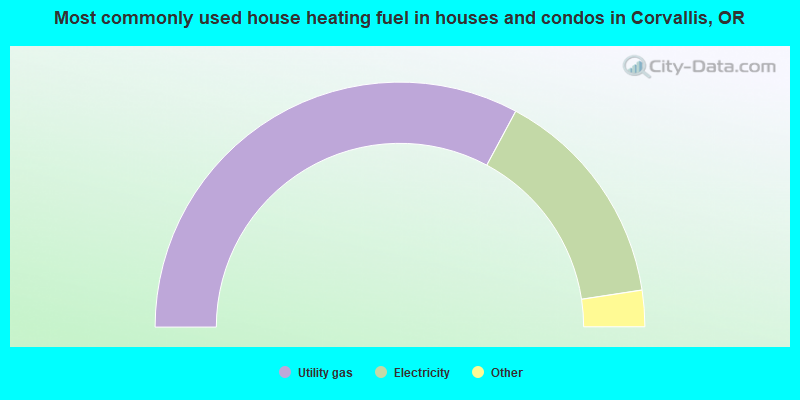
House heating fuel used in houses and condos - Utility gas (%)
House heating fuel used in houses and condos - Bottled, tank, or LP gas (%)
House heating fuel used in houses and condos - Electricity (%)
House heating fuel used in houses and condos - Fuel oil, kerosene, etc. (%)
House heating fuel used in houses and condos - Coal or coke (%)
House heating fuel used in houses and condos - Wood (%)
House heating fuel used in houses and condos - Solar energy (%)
House heating fuel used in houses and condos - Other fuel (%)
House heating fuel used in houses and condos - No fuel used (%)
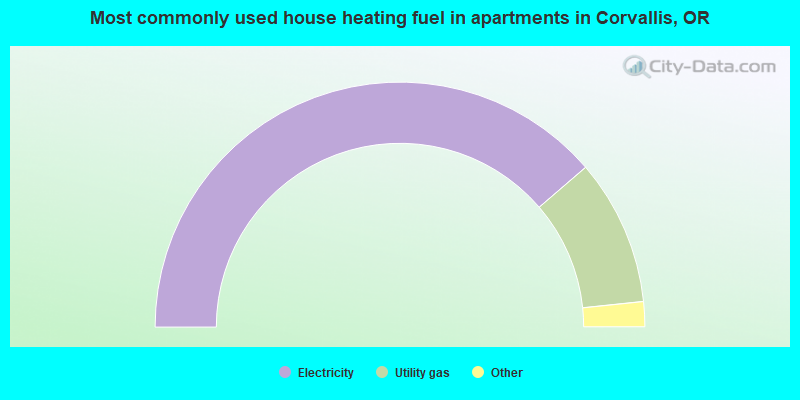
House heating fuel used in apartments - Utility gas (%)
House heating fuel used in apartments - Bottled, tank, or LP gas (%)
House heating fuel used in apartments - Electricity (%)
House heating fuel used in apartments - Fuel oil, kerosene, etc. (%)
House heating fuel used in apartments - Coal or coke (%)
House heating fuel used in apartments - Wood (%)
House heating fuel used in apartments - Solar energy (%)
House heating fuel used in apartments - Other fuel (%)
House heating fuel used in apartments - No fuel used (%)
Latest news about housing in Corvallis, OR collected exclusively by city-data.com from local newspapers, TV, and radio stations
Median year house/condo built: 1978Median year apartment built: 1983Household type by relationship:
Households: 61,315
Male householders: 12,293 (3,667 living alone ), Female householders: 12,339 (4,344 living alone )8,191 spouses (8,113 opposite-sex spouses ), 2,554 unmarried partners , (2,377 opposite-sex unmarried partners ), 9,555 children (9,177 natural , 209 adopted , 168 stepchildren ), 284 grandchildren , 534 brothers or sisters , 441 parents , 31 foster children , 491 other relatives , 8,431 non-relatives In group quarters: 6,167
Size of family households: 5,661 2-persons , 2,383 3-persons , 1,436 4-persons , 844 5-persons , 214 6-persons , 77 7-or-more-persons .
Size of nonfamily households: 9,105 1-person , 3,345 2-persons , 958 3-persons , 781 4-persons , 282 5-persons , 10 6-persons , 15 7-or-more-persons .
4,995 married couples with children. single-parent households (699 men , 1,871 women ).
82.7% of residents of Corvallis speak English at home. of residents speak Spanish at home (67% speak English very well , 17% speak English well , 11% speak English not well , 4% don't speak English at all ).of residents speak other Indo-European language at home (90% speak English very well , 9% speak English well , 2% speak English not well ).of residents speak Asian or Pacific Island language at home (56% speak English very well , 30% speak English well , 12% speak English not well , 2% don't speak English at all ).of residents speak other language at home (56% speak English very well , 28% speak English well , 8% speak English not well , 8% don't speak English at all ).
Foreign born population: 8,500 (13.9%)of them are naturalized citizens )
Median number of rooms in houses and condos:
Median number of rooms in apartments
Owner-occupied Renter-occupied
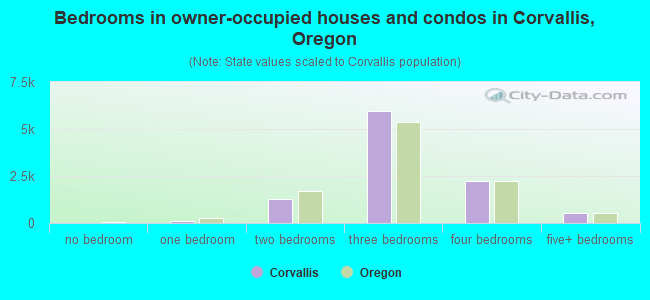
Bedrooms in owner-occupied houses and condos in Corvallis, Oregon
0 no bedroom 125 1 bedroom 1,265 2 bedrooms 5,978 3 bedrooms 2,254 4 bedrooms 538 5+ bedrooms
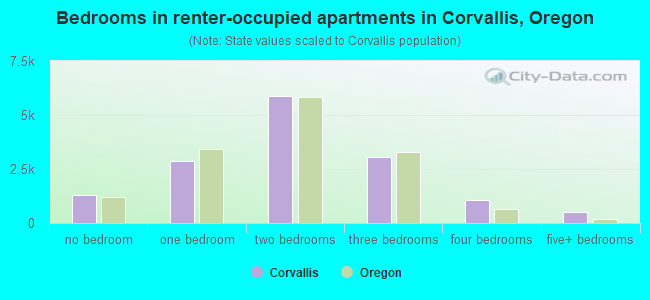
Bedrooms in renter-occupied apartments in Corvallis, Oregon
1,295 no bedroom 2,854 1 bedroom 5,862 2 bedrooms 3,042 3 bedrooms 1,045 4 bedrooms 492 5+ bedrooms
Owner-occupied Renter-occupied
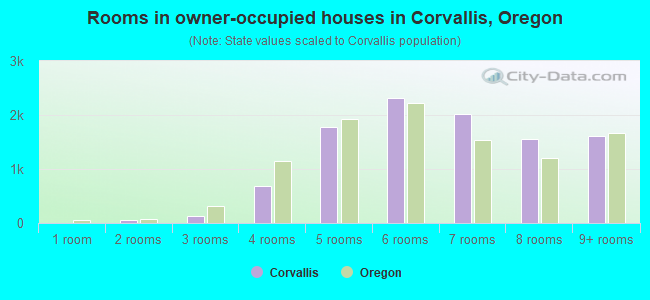
Rooms in owner-occupied houses in Corvallis, Oregon
0 1 room 62 2 rooms 138 3 rooms 679 4 rooms 1,775 5 rooms 2,309 6 rooms 2,026 7 rooms 1,557 8 rooms 1,613 9+ rooms
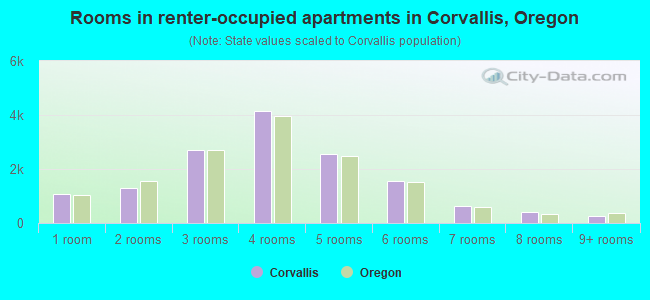
Rooms in renter-occupied apartments in Corvallis, Oregon
1,075 1 room 1,298 2 rooms 2,701 3 rooms 4,154 4 rooms 2,540 5 rooms 1,547 6 rooms 629 7 rooms 390 8 rooms 256 9+ rooms
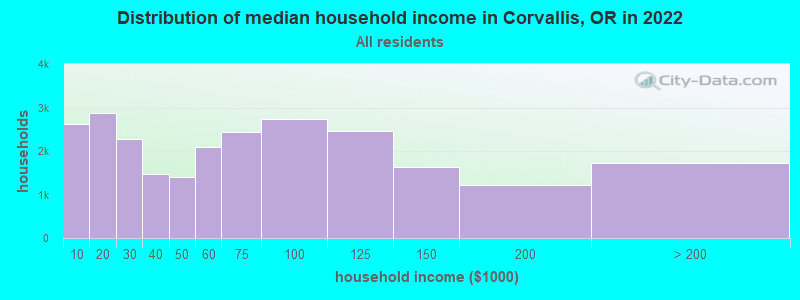
Corvallis, OR household income distribution 2,625 Less than $10,0002,871 $10,000 to $19,9992,281 $20,000 to $29,9991,477 $30,000 to $39,9991,396 $40,000 to $49,9992,088 $50,000 to $59,9992,430 $60,000 to $74,9992,738 $75,000 to $99,9992,470 $100,000 to $124,9991,623 $125,000 to $149,9991,226 $150,000 to $199,9991,735 $200,000 or more
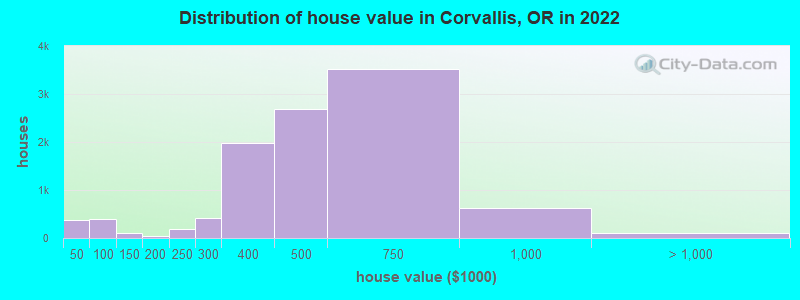
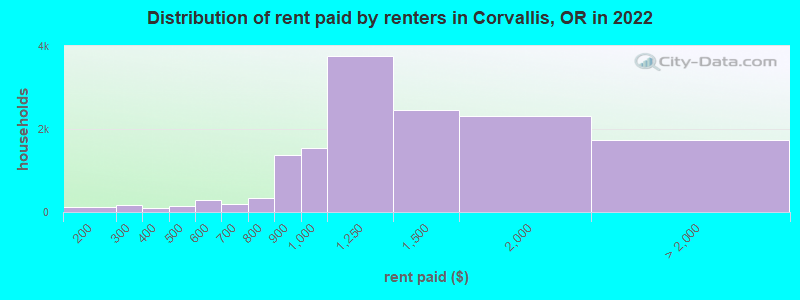
Home value of owner - occupied houses in 2022 in Corvallis, OR 53 Less than $10,00041 $10,000 to $14,9996 $15,000 to $19,99942 $20,000 to $24,99925 $25,000 to $29,99924 $30,000 to $34,99966 $35,000 to $39,999122 $40,000 to $49,99911 $50,000 to $59,999196 $60,000 to $69,99927 $70,000 to $79,99923 $80,000 to $89,99924 $90,000 to $99,99966 $100,000 to $124,99929 $125,000 to $149,99930 $150,000 to $174,9995 $175,000 to $199,999195 $200,000 to $249,999414 $250,000 to $299,9991,978 $300,000 to $399,9992,678 $400,000 to $499,9993,525 $500,000 to $749,999621 $750,000 to $999,99997 $1,000,000 to $1,499,999Rent paid by renters in 2022 in Corvallis, OR 24 $100 to $149100 $150 to $19938 $200 to $249128 $250 to $29956 $300 to $34934 $350 to $39985 $400 to $44962 $450 to $499236 $500 to $54949 $550 to $59945 $600 to $649153 $650 to $699131 $700 to $749199 $750 to $7991,379 $800 to $8991,553 $900 to $9993,755 $1,000 to $1,2492,449 $1,250 to $1,4992,310 $1,500 to $1,999846 $2,000 to $2,499489 $2,500 to $2,999126 $3,000 to $3,49943 $3,500 or more222 No cash rent
Percentage of workers working in this county: 88.7%Number of people working at home: 4,032 (13.4% of all workers )
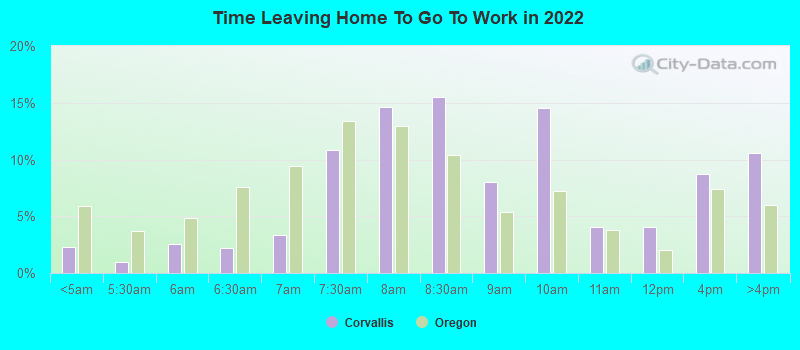
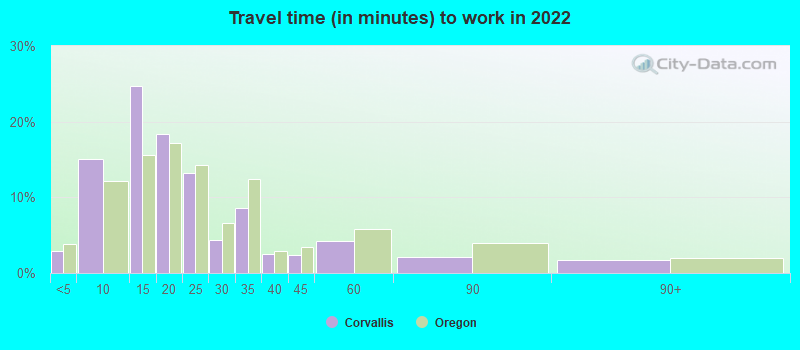
Travel time to work (commute)
Less than 5 minutes: 9035 to 9 minutes: 5,38510 to 14 minutes: 7,94515 to 19 minutes: 4,81920 to 24 minutes: 2,62225 to 29 minutes: 62630 to 34 minutes: 1,52435 to 39 minutes: 15740 to 44 minutes: 18745 to 59 minutes: 64860 to 89 minutes: 96090 or more minutes: 127
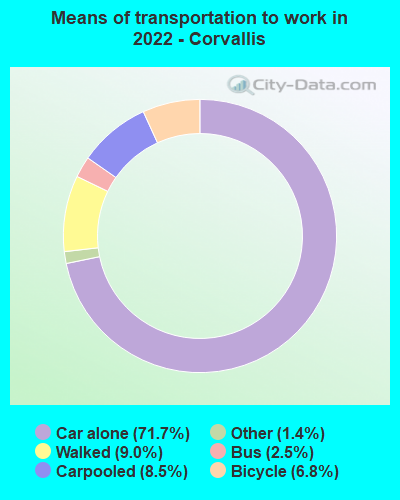
Means of transportation to work:
Drove a car alone: 26,675 (65.3%)Carpooled: 3,766 (9.2%)Bus : 516 (1.3%)Long-distance train or commuter rail : 15 (0.0%)Taxi: 536 (1.3%)Bicycle: 1,376 (3.4%)Walked: 3,782 (9.3%)Worked at home: 4,032 (9.9%)
Unemployment by race in 2022
Unemployment rate for White non-Hispanic residents 10.4% Males4.6% FemalesUnemployment rate for Black residents 10.0% MalesUnemployment rate for Asian residents 4.8% Males4.0% FemalesUnemployment rate for other race residents 18.1% FemalesUnemployment rate for two or more race residents 2.8% Males5.0% FemalesUnemployment rate for Hispanic or Latino residents 5.1% Males8.1% Females
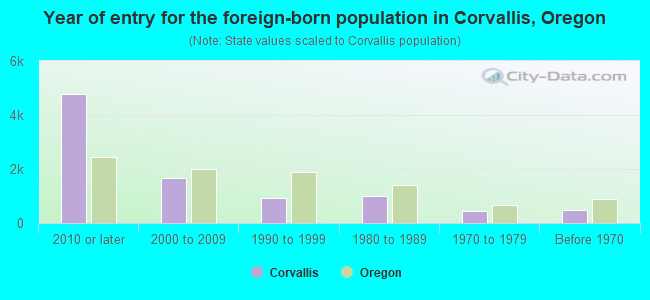
Year of entry for the foreign-born population in Corvallis, Oregon
4,785 2010 or later 1,680 2000 to 2009 919 1990 to 1999 1,008 1980 to 1989 431 1970 to 1979 467 Before 1970
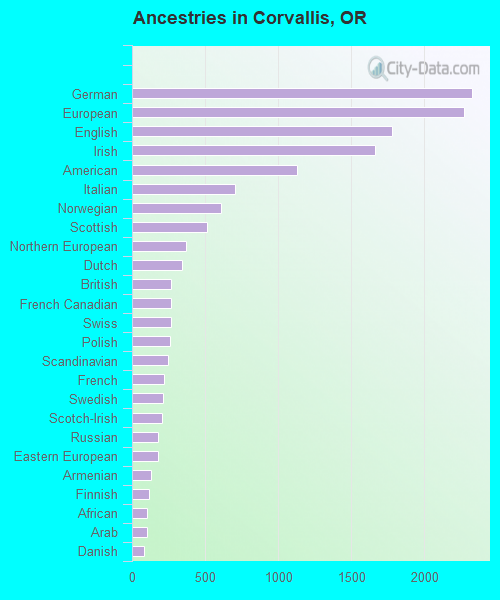
First ancestries reported:
German: 2,327 (8.6%)
European: 2,275 (8.4%)
English: 1,779 (6.6%)
Irish: 1,661 (6.2%)
American: 1,129 (4.2%)
Italian: 702 (2.6%)
Norwegian: 607 (2.3%)
Scottish: 515 (1.9%)
Northern European: 369 (1.4%)
Dutch: 343 (1.3%)
British: 269 (1.0%)
French Canadian: 267 (1.0%)
Swiss: 265 (1.0%)
Polish: 262 (1.0%)
Scandinavian: 244 (0.9%)
French: 217 (0.8%)
Swedish: 212 (0.8%)
Scotch-Irish: 202 (0.7%)
Russian: 180 (0.7%)
Eastern European: 177 (0.7%)
Armenian: 132 (0.5%)
Finnish: 116 (0.4%)
African: 106 (0.4%)
Arab: 101 (0.4%)
Danish: 85 (0.3%)
Jordanian: 80 (0.3%)
Ukrainian: 71 (0.3%)
Israeli: 69 (0.3%)
Australian: 61 (0.2%)
Belgian: 59 (0.2%)
Lebanese: 54 (0.2%)
Czech: 54 (0.2%)
Portuguese: 51 (0.2%)
Palestinian: 50 (0.2%)
Turkish: 50 (0.2%)
Austrian: 38 (0.1%)
Iranian: 37 (0.1%)
Welsh: 36 (0.1%)
Slavic: 36 (0.1%)
Greek: 30 (0.1%)
Czechoslovakian: 30 (0.1%)
Latvian: 28 (0.1%)
Lithuanian: 27 (0.1%)
Canadian: 23 (0.09%)
Romanian: 22 (0.08%)
Hungarian: 22 (0.08%)
Egyptian: 21 (0.08%)
Croatian: 19 (0.07%)
Pennsylvania German: 11 (0.04%)
Albanian: 9 (0.03%)
Basque: 5 (0.02%)
Slovak: 5 (0.02%)
Brazilian: 3 (0.01%)
Most common places of birth for foreign-born residents (%): China, excluding Hong Kong and Taiwan Corvallis:
14.7% (1,174)Oregon:
5.2% (21,429)
Korea Corvallis:
8.6% (684)Oregon:
2.8% (11,450)
Mexico Corvallis:
8.1% (648)Oregon:
33.9% (140,109)
Canada Corvallis:
4.8% (387)Oregon:
3.7% (15,229)
India Corvallis:
4.6% (369)Oregon:
4.7% (19,604)
Peru Corvallis:
3.6% (285)Oregon:
0.7% (2,927)
Taiwan Corvallis:
3.3% (264)Oregon:
0.8% (3,319)
Kuwait Corvallis:
3.1% (251)Oregon:
0.1% (532)
Singapore Corvallis:
2.8% (227)Oregon:
0.2% (700)
Philippines Corvallis:
2.3% (182)Oregon:
3.5% (14,530)
Thailand Corvallis:
2.1% (164)Oregon:
0.8% (3,190)
Argentina Corvallis:
2.0% (158)Oregon:
0.2% (931)
France Corvallis:
1.9% (151)Oregon:
0.7% (2,761)
Italy Corvallis:
1.8% (141)Oregon:
0.4% (1,477)
Kazakhstan Corvallis:
1.7% (136)Oregon:
0.3% (1,161)
Russia Corvallis:
1.5% (121)Oregon:
1.3% (5,229)
Place of birth for U.S.-born residents:
This state: 24,550Other state: 27,258Northeast: 2,871Midwest: 6,509South: 3,366West: 14,536 67.3% of Corvallis residents lived in the same house 1 years ago.
Out of people who lived in different houses, 24.6% lived in this county.
Out of people who lived in different counties, 56.4% lived in Oregon.
Corvallis:
67.3%State average:
85.5%
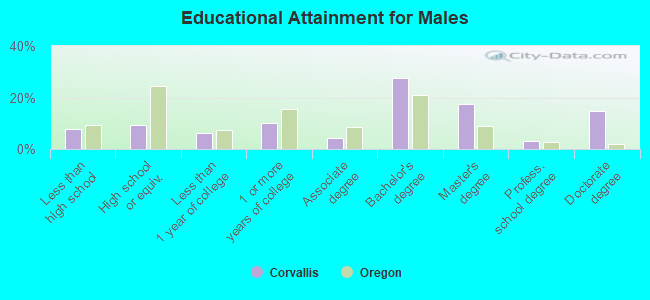
Education attainment for males 25 years and older:
No schooling: 168Nursery to 4th grade: 925th and 6th grade: 337th and 8th grade: 4189th grade: 5010th grade: 11311th grade: 16412th grade, no diploma: 305High school graduate (or equivalency): 1,622Less than 1 year of college: 1,038Some college more than 1 year, no degree: 1,707Associate degree: 720Bachelor's degree: 4,730Master's degree: 2,973Professional school degree: 531Doctorate degree: 2,533
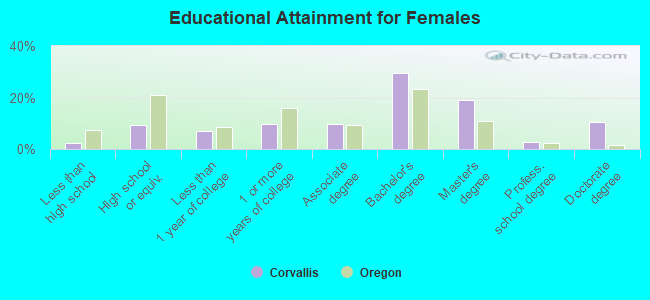
Education attainment for females 25 years and older:
No schooling: 66Nursery to 4th grade: 265th and 6th grade: 47th and 8th grade: 799th grade: 4210th grade: 1611th grade: 9412th grade, no diploma: 74High school graduate (or equivalency): 1,565Less than 1 year of college: 1,182Some college more than 1 year, no degree: 1,625Associate degree: 1,604Bachelor's degree: 4,944Master's degree: 3,223Professional school degree: 439Doctorate degree: 1,783
Housing units in structures:
One, detached: 12,174One, attached: 1,641Two: 8103 or 4: 2,2965 to 9: 2,88810 to 19: 1,62120 to 49: 1,81150 or more: 2,052Mobile homes: 842Boats, RVs, vans, etc.: 24Median worth of mobile homes: $95,985
Housing units lacking complete plumbing facilities in 2022: 0.1%Housing units lacking complete kitchen facilities in 2022: 2.7%House/condo owner moved in on average 11 years ago
Renter moved in on average 2 years ago
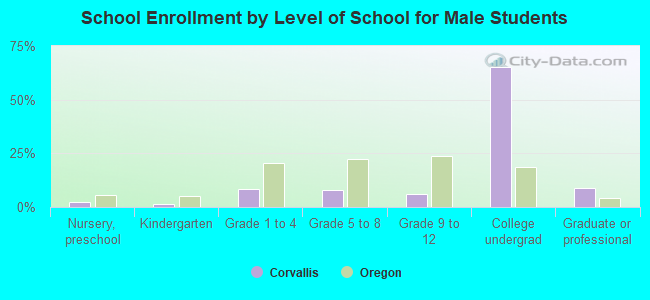
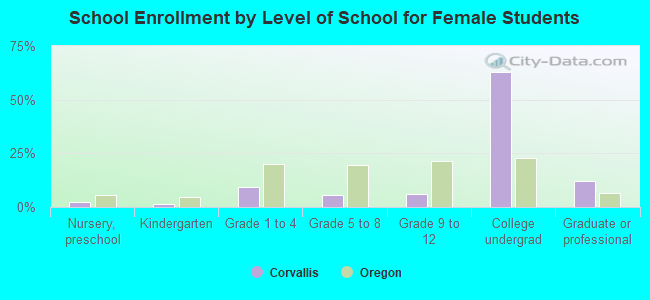
Private vs. public school enrollment:
Students in private schools in grades 1 to 8 (elementary and middle school): 236 Students in private schools in grades 9 to 12 (high school): 178 Students in private undergraduate colleges: 844