Corrales, NM (New Mexico) Houses and Residents
| Corrales: | $596,895 |
| New Mexico: | $243,100 |
Mean price in 2022:
Detached houses: $568,049
Here: $568,049 State: $322,045 Townhouses or other attached units: $560,382
Here: $560,382 State: $284,053 Mobile homes: $91,454
Here: $91,454 State: $117,675
Total population: 8,374 (Urban population: 7,430, Rural population: 0)
Houses: 4,094 (3,729 occupied: 3,352 owner occupied, 397 renter occupied)
| % of renters here: | 11% |
| State: | 29% |
Housing density: 382 houses/condos per square mile
Median price asked for vacant for-sale houses and condos in 2022: $387,968.
Median contract rent in 2022: $1,050 (lower quartile is $788, upper quartile is $1,361)
Median rent asked for vacant for-rent units in 2022: $1,133
Median gross rent in Corrales, NM in 2022: $1,277
Housing units in Corrales with a mortgage: 2,050 (145 second mortgage, 7 home equity loan, 114 both second mortgage and home equity loan)
Houses without a mortgage: 56
Median household income for houses/condos with a mortgage: $167,685
Median household income for apartments without a mortgage: $76,238
Median monthly housing costs: $1,325
Compare current foreclosures near Corrales, NM:
| Photo | Address | Area | Beds / Baths | Price | Details |
|---|---|---|---|---|---|

|
#1
Camino De La Tierra
Corrales, NM 87048
|
- sq. feet
|
- baths - beds |
show details | |

|
#2
Loma Del Cielo
Corrales, NM 87048
|
- sq. feet
|
- baths - beds |
show details | |

|
#3
Rincon Loop
Tijeras, NM 87059
|
2,500 sq. feet
|
2 baths 3 beds |
$715,000
|
show details |

|
#4
Britt St NE
Albuquerque, NM 87112
|
1,828 sq. feet
|
2 baths 3 beds |
show details | |

|
#5
Mcknight Ave NE
Albuquerque, NM 87112
|
1,400 sq. feet
|
2 baths 3 beds |
show details | |

|
#6
Bhutan Dr SE
Rio Rancho, NM 87124
|
1,229 sq. feet
|
1 baths 3 beds |
show details | |

|
#7
King Ranch Ln SW
Albuquerque, NM 87121
|
2,300 sq. feet
|
2 baths 4 beds |
show details | |

|
#8
Tapia Blvd SW
Albuquerque, NM 87105
|
1,144 sq. feet
|
2 baths 2 beds |
show details | |

|
#9
Bermuda Dr NE
Albuquerque, NM 87111
|
2,289 sq. feet
|
3 baths 4 beds |
show details | |

|
#10
Glorieta St NE
Albuquerque, NM 87111
|
1,788 sq. feet
|
2 baths 4 beds |
show details |
| Photo | Address | Area | Beds / Baths | Price | Details |
|---|---|---|---|---|---|

|
#11
Pebble Beach Dr NE
Albuquerque, NM 87111
|
200 sq. feet
|
2 baths 4 beds |
show details | |

|
#12
Jewel Pl NE
Albuquerque, NM 87123
|
1,769 sq. feet
|
2 baths 4 beds |
show details | |

|
#13
Congress Ave NW
Albuquerque, NM 87114
|
1,595 sq. feet
|
2 baths 3 beds |
show details | |

|
#14
Nicklaus Dr SE
Rio Rancho, NM 87124
|
3,250 sq. feet
|
3 baths 4 beds |
show details | |

|
#15
Trumbull Ave SE
Albuquerque, NM 87108
|
1,550 sq. feet
|
3 baths 3 beds |
show details | |

|
#16
Milpa Alta Rd NE
Rio Rancho, NM 87144
|
2,513 sq. feet
|
2 baths 3 beds |
show details | |

|
#17
Edith Blvd SE
Albuquerque, NM 87102
|
975 sq. feet
|
1 baths 2 beds |
show details | |

|
#18
Christine Dr NE
Rio Rancho, NM 87124
|
2,015 sq. feet
|
2 baths 4 beds |
show details | |

|
#19
Garcia St NE
Albuquerque, NM 87112
|
2,447 sq. feet
|
2 baths 3 beds |
show details | |

|
#20
Avenida Madrid NW
Albuquerque, NM 87114
|
3,811 sq. feet
|
3 baths 4 beds |
show details |
| Photo | Address | Area | Beds / Baths | Price | Details |
|---|---|---|---|---|---|

|
#21
Calle Alba NW
Albuquerque, NM 87114
|
- sq. feet
|
2 baths 4 beds |
show details | |

|
#22
Tesuque Ct NE
Rio Rancho, NM 87144
|
- sq. feet
|
2 baths 5 beds |
show details | |

|
#23
Georgia St NE
Albuquerque, NM 87110
|
- sq. feet
|
2 baths 3 beds |
show details | |

|
#24
Buck Island Rd SW
Albuquerque, NM 87121
|
- sq. feet
|
2 baths 2 beds |
show details | |

|
#25
Montclaire Dr NE
Albuquerque, NM 87110
|
- sq. feet
|
2 baths 2 beds |
show details | |

|
#26
Silver Ave SE
Albuquerque, NM 87108
|
- sq. feet
|
2 baths 3 beds |
show details | |

|
#27
Safelite Blvd Ne, Apt 2305
Rio Rancho, NM 87144
|
- sq. feet
|
- baths - beds |
show details | |

|
#28
Jefferson St SE # 1b
Albuquerque, NM 87108
|
- sq. feet
|
- baths - beds |
show details | |

|
#29
Safelite Blvd Ne, Apt 3307
Rio Rancho, NM 87144
|
- sq. feet
|
- baths - beds |
show details | |

|
#30
Wyoming Blvd NE
Albuquerque, NM 87123
|
- sq. feet
|
- baths - beds |
show details |
| Photo | Address | Area | Beds / Baths | Price | Details |
|---|---|---|---|---|---|

|
#31
San Ildefonso Dr NW
Albuquerque, NM 87120
|
- sq. feet
|
- baths - beds |
show details | |

|
#32
Topke Pl NE Apt H5
Albuquerque, NM 87109
|
- sq. feet
|
- baths - beds |
show details | |

|
#33
Copper Ave NE Apt 617
Albuquerque, NM 87123
|
- sq. feet
|
- baths - beds |
show details | |

|
#34
Cantata St NW Unit 3002
Albuquerque, NM 87114
|
- sq. feet
|
- baths - beds |
show details | |

|
#35
Taylor Ranch Rd NW Apt 222
Albuquerque, NM 87120
|
- sq. feet
|
- baths - beds |
show details | |

|
#36
E Antelope Cir SE
Albuquerque, NM 87123
|
- sq. feet
|
- baths - beds |
show details | |

|
#37
Mesa Del Rio St NW
Albuquerque, NM 87121
|
- sq. feet
|
- baths - beds |
show details | |

|
#38
Mesa Del Oso Rd NE
Albuquerque, NM 87111
|
- sq. feet
|
- baths - beds |
show details | |

|
#39
Paseo 550 Drive Ne, E-202
Rio Rancho, NM 87144
|
- sq. feet
|
- baths - beds |
show details | |

|
#40
Hearthstone Rd NW
Albuquerque, NM 87114
|
- sq. feet
|
- baths - beds |
show details |
| Photo | Address | Area | Beds / Baths | Price | Details |
|---|---|---|---|---|---|

|
#41
Pickard Ave NE
Albuquerque, NM 87110
|
- sq. feet
|
- baths - beds |
show details | |

|
#42
Ladera Dr NW Apt 424
Albuquerque, NM 87120
|
- sq. feet
|
- baths - beds |
show details | |

|
#43
San Mateo Ln NE Apt 137
Albuquerque, NM 87109
|
- sq. feet
|
- baths - beds |
show details | |

|
#44
Indian School Rd NE Apt D311
Albuquerque, NM 87102
|
- sq. feet
|
- baths - beds |
show details | |

|
#45
Manitoba Dr NE Apt C
Albuquerque, NM 87111
|
- sq. feet
|
- baths - beds |
show details | |

|
#46
Soothing Meadows Dr NE
Rio Rancho, NM 87144
|
- sq. feet
|
- baths - beds |
show details | |

|
#47
Stoney Bluff Ct NW
Albuquerque, NM 87120
|
- sq. feet
|
- baths - beds |
show details | |

|
#48
Universe Blvd NW Apt 838
Albuquerque, NM 87114
|
- sq. feet
|
- baths - beds |
show details | |

|
#49
Osuna Rd NE Apt 64
Albuquerque, NM 87109
|
- sq. feet
|
- baths - beds |
show details | |

|
Check over 1 million property listings on Foreclosure.com!
|
browse all offers | |||

Latest news about housing in Corrales, NM collected exclusively by city-data.com from local newspapers, TV, and radio stations

 | (Why) Is the Corrales real estate market stagnating? (30 replies) |
| ALB neighborhoods (27 replies) |
| Retiring to Silver City/Grant County NM or Pima County, AZ: Pros & Cons? (40 replies) |
| Searching for a Safe and Family-Friendly Neighborhood in Albuquerque (Update 2023) (37 replies) |
| Apartments For Seniors (4 replies) |
| Is cheap house rent between northern ABQ and SF an option? (14 replies) |

Median year apartment built: 1982
Household type by relationship:
Households: 8,724- Male householders: 1,954 (222 living alone), Female householders: 1,716 (536 living alone)
2,481 spouses (2,448 opposite-sex spouses), 225 unmarried partners, (215 opposite-sex unmarried partners), 1,701 children (1,506 natural, 100 adopted, 94 stepchildren), 102 grandchildren, 69 brothers or sisters, 171 parents, 4 foster children, 57 other relatives, 212 non-relatives
- In group quarters: 26
Size of family households: 1,750 2-persons, 496 3-persons, 260 4-persons, 156 5-persons, 26 6-persons, 44 7-or-more-persons.
Size of nonfamily households: 809 1-person, 191 2-persons, 1 3-persons.
934 married couples with children.
51 single-parent households (10 men, 41 women).
87.8% of residents of Corrales speak English at home.
12.4% of residents speak Spanish at home (81% speak English very well, 13% speak English well, 6% speak English not well).
1.3% of residents speak other Indo-European language at home (100% speak English very well).
0.3% of residents speak Asian or Pacific Island language at home (100% speak English very well).
1.2% of residents speak other language at home (67% speak English very well, 24% speak English well, 8% speak English not well).
Foreign born population: 753 (8.6%)
(44.9% of them are naturalized citizens)
| Here: | 6.8 |
| State: | 5.9 |
| Here: | 5.4 |
| State: | 4.2 |

- Bedrooms in owner-occupied houses and condos in Corrales, New Mexico
- 52no bedroom
- 861 bedroom
- 3862 bedrooms
- 1,6143 bedrooms
- 1,0404 bedrooms
- 1745+ bedrooms

- Bedrooms in renter-occupied apartments in Corrales, New Mexico
- 45no bedroom
- 91 bedroom
- 1222 bedrooms
- 1993 bedrooms
- 144 bedrooms
- 85+ bedrooms

- Cars and other vehicles available in Corrales in owner-occupied houses/condos
- 65no vehicle
- 5641 vehicle
- 1,2782 vehicles
- 9183 vehicles
- 3824 vehicles
- 1455+ vehicles

- Cars and other vehicles available in Corrales in renter-occupied apartments
- 0no vehicle
- 1511 vehicle
- 2102 vehicles
- 373 vehicles
- 04 vehicles
- 05+ vehicles

- Rooms in owner-occupied houses in Corrales, New Mexico
- 91 room
- 502 rooms
- 213 rooms
- 3164 rooms
- 3855 rooms
- 6236 rooms
- 6987 rooms
- 4718 rooms
- 7799+ rooms

- Rooms in renter-occupied apartments in Corrales, New Mexico
- 01 room
- 452 rooms
- 03 rooms
- 374 rooms
- 695 rooms
- 866 rooms
- 647 rooms
- 468 rooms
- 509+ rooms


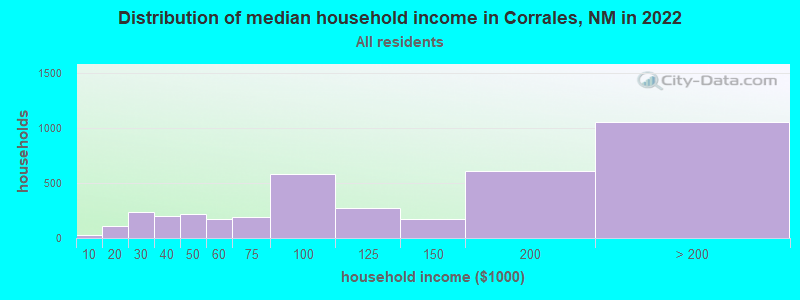
Corrales, NM household income distribution

- 28Less than $10,000
- 112$10,000 to $19,999
- 234$20,000 to $29,999
- 204$30,000 to $39,999
- 215$40,000 to $49,999
- 177$50,000 to $59,999
- 189$60,000 to $74,999
- 577$75,000 to $99,999
- 275$100,000 to $124,999
- 169$125,000 to $149,999
- 606$150,000 to $199,999
- 1,054$200,000 or more
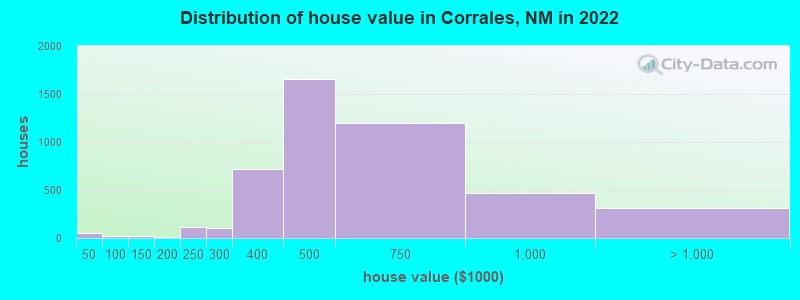
Home value of owner - occupied houses in 2022 in Corrales, NM
-
- 19Less than $10,000
- 10$10,000 to $14,999
- 20$40,000 to $49,999
- 11$100,000 to $124,999
- 8$125,000 to $149,999
- 8$175,000 to $199,999
- 115$200,000 to $249,999
- 101$250,000 to $299,999
- 722$300,000 to $399,999
- 1,657$400,000 to $499,999
- 1,201$500,000 to $749,999
- 468$750,000 to $999,999
- 284$1,000,000 to $1,499,999
- 17$1,500,000 to $1,999,999
- 6$2,000,000 or more
Rent paid by renters in 2022 in Corrales, NM
-
- 9$550 to $599
- 44$650 to $699
- 16$700 to $749
- 43$800 to $899
- 58$900 to $999
- 75$1,000 to $1,249
- 7$1,250 to $1,499
- 79$1,500 to $1,999
- 26No cash rent


Percentage of workers working in this county: 48.1%
Number of people working at home: 1,022 (25.4% of all workers)
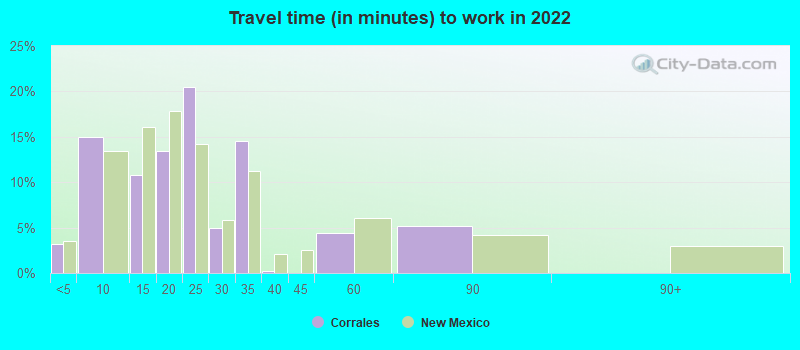
Travel time to work (commute)
- Less than 5 minutes: 68
- 5 to 9 minutes: 218
- 10 to 14 minutes: 267
- 15 to 19 minutes: 288
- 20 to 24 minutes: 437
- 25 to 29 minutes: 425
- 30 to 34 minutes: 436
- 35 to 39 minutes: 62
- 40 to 44 minutes: 369
- 45 to 59 minutes: 231
- 60 to 89 minutes: 76
- 90 or more minutes: 258
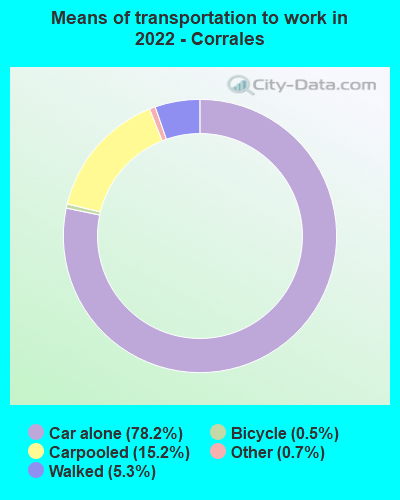
Means of transportation to work:
- Drove a car alone: 1,033 (47.1%)
- Carpooled: 218 (9.9%)
- Taxi: 10 (0.5%)
- Bicycle: 7 (0.3%)
- Walked: 78 (3.6%)
- Worked at home: 1,022 (46.6%)

- Unemployment by race in 2022
- Unemployment rate for White non-Hispanic residents
- 1.0%Males
- 1.2%Females
- Unemployment rate for American Indian and Alaska Native residents
- 45.8%Males
- Unemployment rate for two or more race residents
- 10.4%Females
- Unemployment rate for Hispanic or Latino residents
- 6.6%Females

- Year of entry for the foreign-born population in Corrales, New Mexico
- 1812010 or later
- 1262000 to 2009
- 651990 to 1999
- 351980 to 1989
- 511970 to 1979
- 85Before 1970

First ancestries reported:
- English: 548 (13.4%)
- German: 321 (7.8%)
- American: 207 (5.1%)
- Irish: 198 (4.8%)
- Italian: 185 (4.5%)
- Norwegian: 144 (3.5%)
- Canadian: 112 (2.7%)
- European: 71 (1.7%)
- British: 48 (1.2%)
- French: 44 (1.1%)
- Scottish: 42 (1.0%)
- Greek: 40 (1.0%)
- Northern European: 34 (0.8%)
- Lebanese: 24 (0.6%)
- Scandinavian: 23 (0.6%)
- Scotch-Irish: 23 (0.6%)
- Eastern European: 20 (0.5%)
- Danish: 18 (0.4%)
- Czech: 16 (0.4%)
- Dutch: 16 (0.4%)
- Polish: 16 (0.4%)
- Slavic: 15 (0.4%)
- Haitian: 15 (0.4%)
- Lithuanian: 11 (0.3%)
- Swiss: 7 (0.2%)
- French Canadian: 6 (0.1%)
Most common places of birth for foreign-born residents (%):
| Corrales: | 31.0% (189) |
| New Mexico: | 66.5% (129,316) |
| Corrales: | 16.9% (103) |
| New Mexico: | 0.2% (445) |
| Corrales: | 7.6% (46) |
| New Mexico: | 0.9% (1,770) |
| Corrales: | 6.9% (42) |
| New Mexico: | 1.1% (2,195) |
| Corrales: | 3.6% (22) |
| New Mexico: | 0.1% (275) |
| Corrales: | 3.1% (19) |
| New Mexico: | 0.2% (346) |
| Corrales: | 2.8% (17) |
| New Mexico: | 1.6% (3,140) |
| Corrales: | 2.8% (17) |
| New Mexico: | 0.1% (179) |
| Corrales: | 2.6% (16) |
| New Mexico: | 0.8% (1,561) |
| Corrales: | 2.5% (15) |
| New Mexico: | 0.6% (1,258) |
| Corrales: | 2.3% (14) |
| New Mexico: | 0.1% (113) |
| Corrales: | 2.1% (13) |
| New Mexico: | 1.1% (2,049) |
| Corrales: | 2.0% (12) |
| New Mexico: | 3.2% (6,181) |
| Corrales: | 1.6% (10) |
| New Mexico: | 0.2% (392) |
Place of birth for U.S.-born residents:
- This state: 3,781
- Other state: 4,060
- Northeast: 829
- Midwest: 1,307
- South: 759
- West: 1,063
92.2% of Corrales residents lived in the same house 1 years ago.
Out of people who lived in different houses, 11.6% lived in this county.
Out of people who lived in different counties, 78.0% lived in New Mexico.
| Corrales: | 92.2% |
| State average: | 88.2% |
Education attainment for males 25 years and older:
- No schooling: 13
- Nursery to 4th grade: 8
- 5th and 6th grade: 0
- 7th and 8th grade: 21
- 9th grade: 67
- 10th grade: 57
- 11th grade: 0
- 12th grade, no diploma: 44
- High school graduate (or equivalency): 458
- Less than 1 year of college: 178
- Some college more than 1 year, no degree: 510
- Associate degree: 158
- Bachelor's degree: 1,000
- Master's degree: 571
- Professional school degree: 186
- Doctorate degree: 210

Education attainment for females 25 years and older:
- No schooling: 69
- Nursery to 4th grade: 7
- 5th and 6th grade: 0
- 7th and 8th grade: 97
- 9th grade: 0
- 10th grade: 0
- 11th grade: 11
- 12th grade, no diploma: 16
- High school graduate (or equivalency): 573
- Less than 1 year of college: 106
- Some college more than 1 year, no degree: 583
- Associate degree: 376
- Bachelor's degree: 1,082
- Master's degree: 586
- Professional school degree: 161
- Doctorate degree: 72


Housing units in structures:
- One, detached: 3,610
- One, attached: 269
- 3 or 4: 13
- Mobile homes: 201
Housing units lacking complete kitchen facilities in 2022: 2.3%
House/condo owner moved in on average 14 years ago
Renter moved in on average 8 years ago

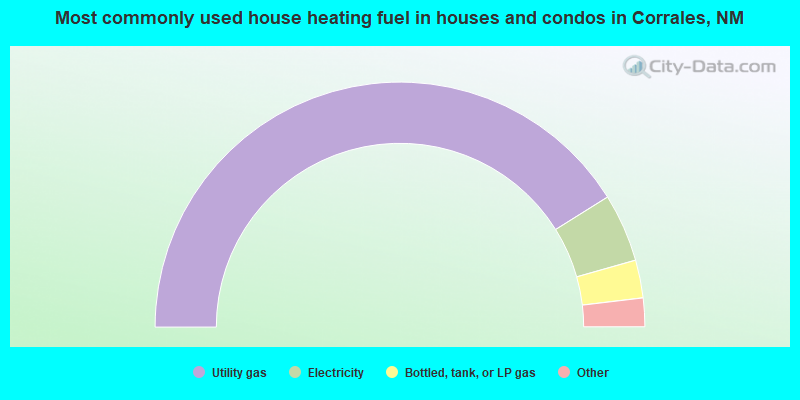
- 82.2%Utility gas
- 9.0%Electricity
- 5.0%Bottled, tank, or LP gas
- 1.9%Wood
- 1.8%Solar energy
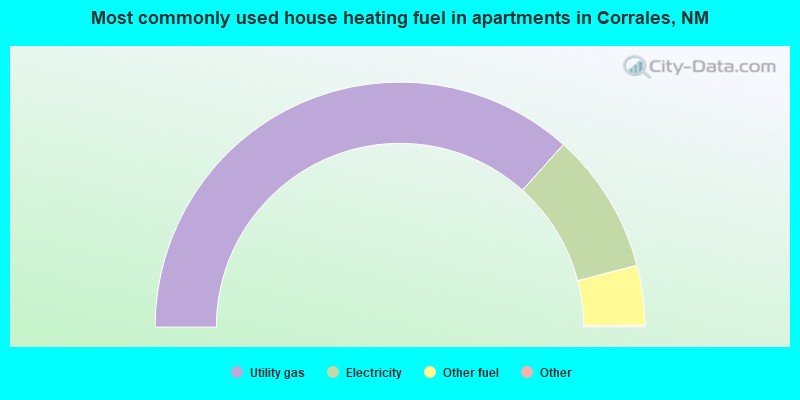
- 73.4%Utility gas
- 18.7%Electricity
- 7.9%Other fuel
Private vs. public school enrollment:
| Here: | 19.7% |
| New Mexico: | 10.2% |
| Here: | 34.4% |
| New Mexico: | 10.0% |
| Here: | 5.1% |
| New Mexico: | 12.3% |


