Coram, NY (New York) Houses and Residents
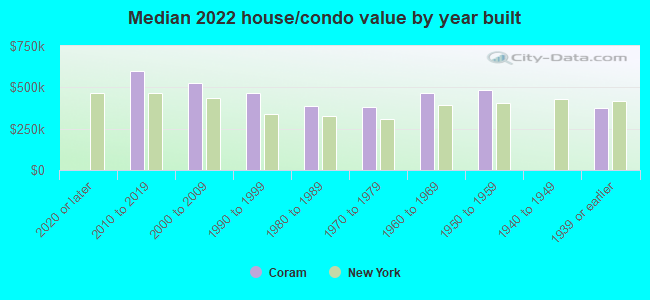
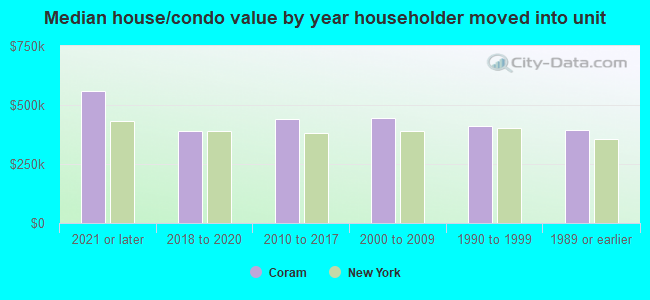
| Coram: | $422,840 |
| New York: | $400,400 |
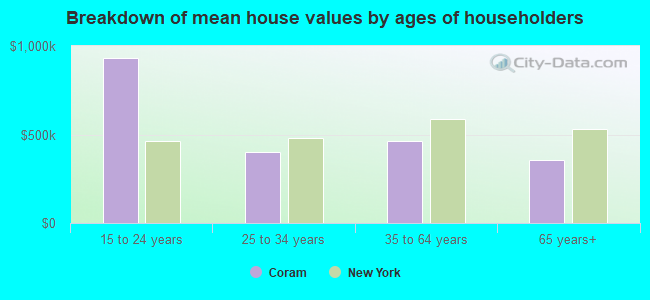
Mean price in 2022:
Detached houses: $474,801
Here: $474,801 State: $476,719 Townhouses or other attached units: $303,165
Here: $303,165 State: $699,270 In 2-unit structures: $133,817
Here: $133,817 State: $713,077 In 3-to-4-unit structures: $161,479
Here: $161,479 State: $764,568 In 5-or-more-unit structures: $161,131
Here: $161,131 State: $912,009
Total population: 39,113 (Urban population: 34,979, Rural population: 0)
Houses: 16,269 (15,541 occupied: 10,607 owner occupied, 4,927 renter occupied)
| % of renters here: | 32% |
| State: | 46% |
Housing density: 1,180 houses/condos per square mile
Median price asked for vacant for-sale houses and condos in 2022: $491,396.
Median contract rent in 2022: over $2,000 (lower quartile is $1,567, upper quartile is over $2,000)
Median rent asked for vacant for-rent units in 2022: $3,199
Median gross rent in Coram, NY in 2022: over $2,000
Housing units in Coram with a mortgage: 7,779 (916 second mortgage, 9 home equity loan, 889 both second mortgage and home equity loan)
Houses without a mortgage: 363
Median household income for houses/condos with a mortgage: $122,156
Median household income for apartments without a mortgage: $87,347
Median monthly housing costs: $2,363
Compare current foreclosures in Coram, NY:
| Photo | Address | Area | Beds / Baths | Price | Details |
|---|---|---|---|---|---|

|
#1
Houston Ct
Coram, NY 11727
|
650 sq. feet
|
1 baths 1 beds |
$219,900
|
show details |

|
#2
Albright Rd
Coram, NY 11727
|
15,246 sq. feet
|
2 baths 4 beds |
$549,900
|
show details |

|
#3
Norfleet Ln
Coram, NY 11727
|
1,092 sq. feet
|
1 baths 3 beds |
show details | |

|
#4
Hillsdale Ln
Coram, NY 11727
|
- sq. feet
|
1 baths 3 beds |
show details | |

|
#5
Nixon Ct
Coram, NY 11727
|
- sq. feet
|
- baths - beds |
show details | |

|
#6
Mount Sinai Coram Rd
Coram, NY 11727
|
- sq. feet
|
- baths - beds |
show details | |

|
#7
Townehouse Dr
Coram, NY 11727
|
- sq. feet
|
- baths - beds |
show details | |

|
#8
Middle Country Rd Apt 7a1
Coram, NY 11727
|
- sq. feet
|
- baths - beds |
show details | |

|
#9
Aycock Pl Apt A
Coram, NY 11727
|
- sq. feet
|
- baths - beds |
show details | |

|
#10
Kiowa Ct # K-3
Coram, NY 11727
|
- sq. feet
|
- baths - beds |
show details |
| Photo | Address | Area | Beds / Baths | Price | Details |
|---|---|---|---|---|---|

|
#11
Pointe Cir N
Coram, NY 11727
|
- sq. feet
|
- baths - beds |
show details | |

|
#12
Wincoram Way
Coram, NY 11727
|
- sq. feet
|
- baths - beds |
show details | |

|
#13
Juniper Ct
Coram, NY 11727
|
- sq. feet
|
- baths - beds |
show details | |

|
#14
Townehouse Dr
Coram, NY 11727
|
- sq. feet
|
- baths - beds |
show details | |

|
#15
Longwood Pl Apt B
Coram, NY 11727
|
- sq. feet
|
- baths - beds |
show details | |

|
#16
Charles Pond Dr
Coram, NY 11727
|
- sq. feet
|
- baths - beds |
show details | |

|
#17
Middle Country Rd Apt 7d1
Coram, NY 11727
|
- sq. feet
|
- baths - beds |
show details | |

|
#18
Whinstone St
Coram, NY 11727
|
- sq. feet
|
- baths - beds |
show details | |

|
#19
Adams Ct
Coram, NY 11727
|
- sq. feet
|
- baths - beds |
show details | |

|
#20
Elm Ave
Coram, NY 11727
|
- sq. feet
|
- baths - beds |
show details |
| Photo | Address | Area | Beds / Baths | Price | Details |
|---|---|---|---|---|---|

|
#21
Mount Sinai Coram Rd
Coram, NY 11727
|
- sq. feet
|
- baths - beds |
show details | |

|
#22
Townehouse Dr
Coram, NY 11727
|
- sq. feet
|
- baths - beds |
show details | |

|
#23
Townehouse Dr
Coram, NY 11727
|
- sq. feet
|
- baths - beds |
show details | |

|
#24
Petersburg Ct
Coram, NY 11727
|
- sq. feet
|
- baths - beds |
show details | |

|
#25
Hanson St
Coram, NY 11727
|
- sq. feet
|
- baths - beds |
show details | |

|
#26
Beach Ln
Coram, NY 11727
|
- sq. feet
|
- baths - beds |
show details | |

|
#27
Harford Dr
Coram, NY 11727
|
- sq. feet
|
- baths - beds |
show details | |

|
#28
Sandpiper Ln
Coram, NY 11727
|
- sq. feet
|
- baths - beds |
show details | |

|
#29
Halliday Rd
Coram, NY 11727
|
- sq. feet
|
- baths - beds |
show details | |

|
#30
Birchfield Ct
Coram, NY 11727
|
- sq. feet
|
- baths - beds |
show details |
| Photo | Address | Area | Beds / Baths | Price | Details |
|---|---|---|---|---|---|

|
#31
Winside Ln
Coram, NY 11727
|
- sq. feet
|
- baths - beds |
show details | |

|
#32
Windsor Ct
Coram, NY 11727
|
- sq. feet
|
- baths - beds |
show details | |

|
#33
Sequoia Dr
Coram, NY 11727
|
- sq. feet
|
- baths - beds |
show details | |

|
#34
Hollingwood Dr
Coram, NY 11727
|
- sq. feet
|
- baths - beds |
show details | |

|
#35
Hawkins Path
Coram, NY 11727
|
- sq. feet
|
- baths - beds |
show details | |

|
#36
Halliday Rd
Coram, NY 11727
|
- sq. feet
|
- baths - beds |
show details | |

|
#37
Burwood Ln
Coram, NY 11727
|
- sq. feet
|
- baths - beds |
show details | |

|
#38
Birchwood Rd
Coram, NY 11727
|
- sq. feet
|
- baths - beds |
show details | |

|
#39
Sun Valley Dr
Coram, NY 11727
|
- sq. feet
|
- baths - beds |
show details | |

|
#40
Pheasant Valley Dr
Coram, NY 11727
|
- sq. feet
|
- baths - beds |
show details |
| Photo | Address | Area | Beds / Baths | Price | Details |
|---|---|---|---|---|---|

|
#41
Fife Dr
Coram, NY 11727
|
- sq. feet
|
- baths - beds |
show details | |

|
#42
Charlottsville Ct
Coram, NY 11727
|
- sq. feet
|
- baths - beds |
show details | |

|
#43
Blair Dr
Coram, NY 11727
|
- sq. feet
|
- baths - beds |
show details | |

|
#44
Wilmont Turn
Coram, NY 11727
|
- sq. feet
|
- baths - beds |
show details | |

|
#45
Corpine Ln
Coram, NY 11727
|
- sq. feet
|
- baths - beds |
show details | |

|
#46
Holly Hill Ln
Coram, NY 11727
|
- sq. feet
|
- baths - beds |
show details | |

|
#47
Samantha Dr
Coram, NY 11727
|
- sq. feet
|
- baths - beds |
show details | |

|
#48
Magic Mountain Dr
Coram, NY 11727
|
- sq. feet
|
- baths - beds |
show details | |

|
#49
Gordal Ln
Coram, NY 11727
|
- sq. feet
|
- baths - beds |
show details | |

|
Check over 1 million property listings on Foreclosure.com!
|
browse all offers | |||

Latest news about housing in Coram, NY collected exclusively by city-data.com from local newspapers, TV, and radio stations


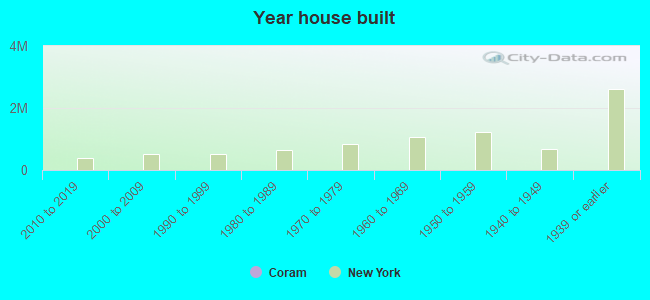
Median year apartment built: 1993
Household type by relationship:
Households: 42,196- Male householders: 7,776 (1,757 living alone), Female householders: 7,728 (2,666 living alone)
7,246 spouses (7,222 opposite-sex spouses), 1,502 unmarried partners, (1,430 opposite-sex unmarried partners), 13,254 children (12,247 natural, 464 adopted, 542 stepchildren), 771 grandchildren, 482 brothers or sisters, 1,081 parents, 0 foster children, 954 other relatives, 1,115 non-relatives
- In group quarters: 280
Size of family households: 3,938 2-persons, 2,296 3-persons, 2,028 4-persons, 756 5-persons, 715 6-persons, 212 7-or-more-persons.
Size of nonfamily households: 4,458 1-person, 866 2-persons, 237 3-persons.
5,748 married couples with children.
1,663 single-parent households (353 men, 1,310 women).
78.2% of residents of Coram speak English at home.
10.3% of residents speak Spanish at home (70% speak English very well, 19% speak English well, 10% speak English not well).
5.9% of residents speak other Indo-European language at home (71% speak English very well, 18% speak English well, 11% speak English not well).
1.9% of residents speak Asian or Pacific Island language at home (66% speak English very well, 30% speak English well, 4% speak English not well).
3.7% of residents speak other language at home (57% speak English very well, 43% speak English well).
Foreign born population: 7,287 (17.3%)
(79.1% of them are naturalized citizens)
| Here: | 6.5 |
| State: | 6.3 |
| Here: | 4.1 |
| State: | 3.8 |
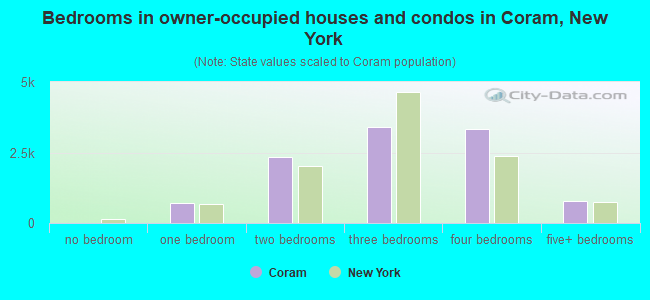
- Bedrooms in owner-occupied houses and condos in Coram, New York
- 15no bedroom
- 7191 bedroom
- 2,3502 bedrooms
- 3,4013 bedrooms
- 3,3414 bedrooms
- 7815+ bedrooms
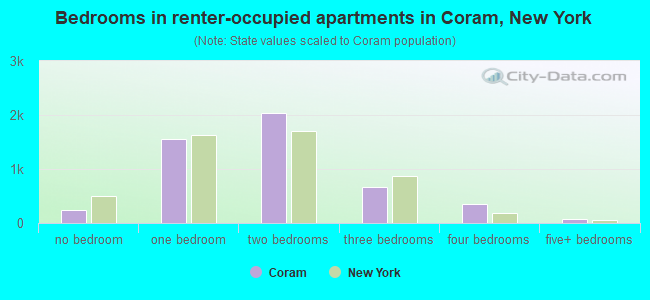
- Bedrooms in renter-occupied apartments in Coram, New York
- 247no bedroom
- 1,5611 bedroom
- 2,0302 bedrooms
- 6753 bedrooms
- 3464 bedrooms
- 695+ bedrooms
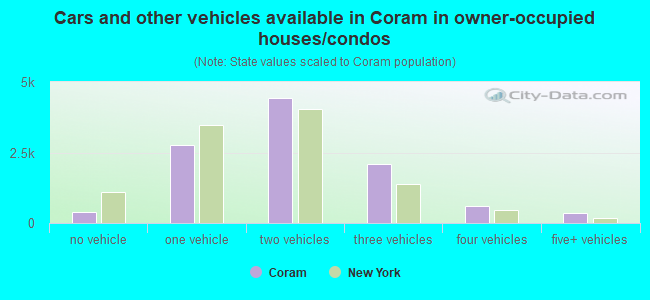
- Cars and other vehicles available in Coram in owner-occupied houses/condos
- 375no vehicle
- 2,7551 vehicle
- 4,4362 vehicles
- 2,0893 vehicles
- 6114 vehicles
- 3425+ vehicles
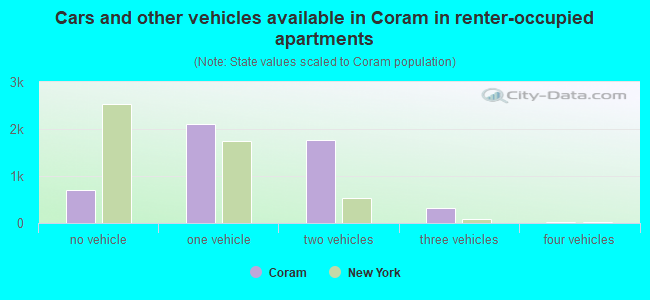
- Cars and other vehicles available in Coram in renter-occupied apartments
- 712no vehicle
- 2,1031 vehicle
- 1,7702 vehicles
- 3183 vehicles
- 244 vehicles
- 05+ vehicles
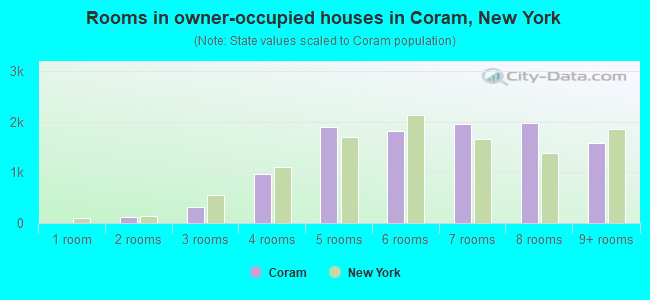
- Rooms in owner-occupied houses in Coram, New York
- 31 room
- 1172 rooms
- 3083 rooms
- 9764 rooms
- 1,8845 rooms
- 1,8176 rooms
- 1,9457 rooms
- 1,9788 rooms
- 1,5809+ rooms
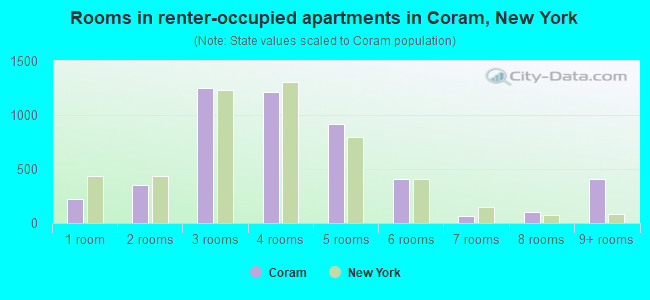
- Rooms in renter-occupied apartments in Coram, New York
- 2211 room
- 3482 rooms
- 1,2483 rooms
- 1,2124 rooms
- 9175 rooms
- 4086 rooms
- 677 rooms
- 1028 rooms
- 4049+ rooms
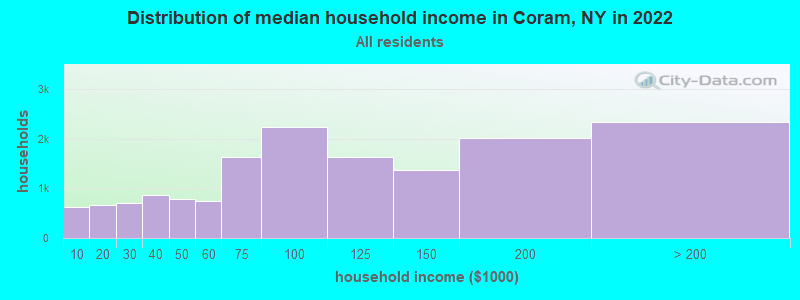
Coram, NY household income distribution

- 631Less than $10,000
- 667$10,000 to $19,999
- 696$20,000 to $29,999
- 858$30,000 to $39,999
- 786$40,000 to $49,999
- 753$50,000 to $59,999
- 1,627$60,000 to $74,999
- 2,247$75,000 to $99,999
- 1,630$100,000 to $124,999
- 1,379$125,000 to $149,999
- 2,014$150,000 to $199,999
- 2,338$200,000 or more
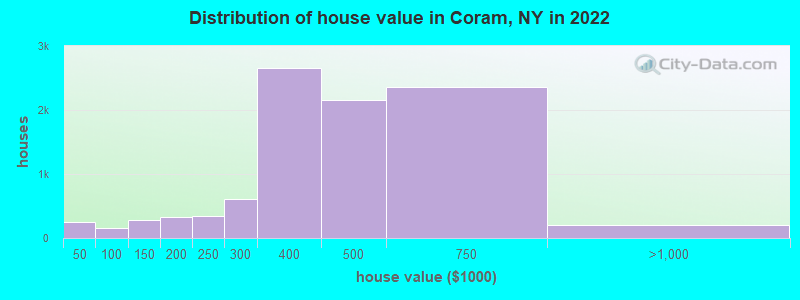
Home value of owner - occupied houses in 2022 in Coram, NY
-
- 173Less than $10,000
- 23$10,000 to $14,999
- 13$30,000 to $34,999
- 8$35,000 to $39,999
- 29$40,000 to $49,999
- 6$50,000 to $59,999
- 21$60,000 to $69,999
- 59$80,000 to $89,999
- 40$90,000 to $99,999
- 245$100,000 to $124,999
- 39$125,000 to $149,999
- 93$150,000 to $174,999
- 237$175,000 to $199,999
- 336$200,000 to $249,999
- 610$250,000 to $299,999
- 2,651$300,000 to $399,999
- 2,161$400,000 to $499,999
- 2,360$500,000 to $749,999
- 160$750,000 to $999,999
- 18$1,000,000 to $1,499,999
- 23$2,000,000 or more
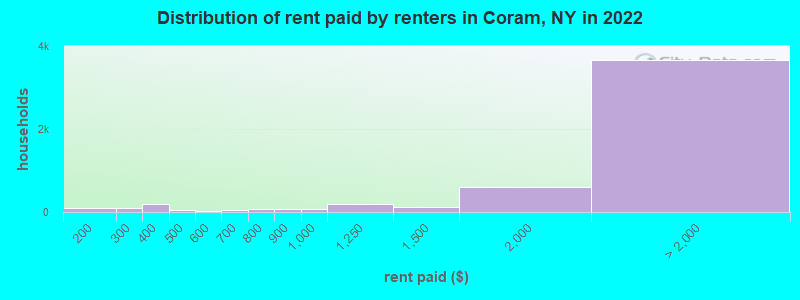
Rent paid by renters in 2022 in Coram, NY
-
- 14Less than $100
- 16$100 to $149
- 89$150 to $199
- 52$200 to $249
- 50$250 to $299
- 13$300 to $349
- 175$350 to $399
- 21$400 to $449
- 20$450 to $499
- 32$500 to $549
- 31$600 to $649
- 15$650 to $699
- 38$700 to $749
- 31$750 to $799
- 76$800 to $899
- 61$900 to $999
- 186$1,000 to $1,249
- 119$1,250 to $1,499
- 600$1,500 to $1,999
- 1,547$2,000 to $2,499
- 1,461$2,500 to $2,999
- 155$3,000 to $3,499
- 258$3,500 or more
- 232No cash rent
Percentage of workers working in this county: 85.9%
Number of people working at home: 1,881 (8.6% of all workers)
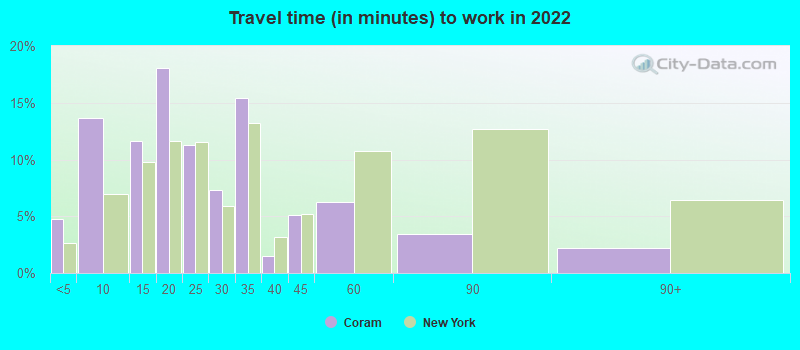
Travel time to work (commute)
- Less than 5 minutes: 490
- 5 to 9 minutes: 859
- 10 to 14 minutes: 1,992
- 15 to 19 minutes: 2,054
- 20 to 24 minutes: 3,185
- 25 to 29 minutes: 1,453
- 30 to 34 minutes: 3,343
- 35 to 39 minutes: 592
- 40 to 44 minutes: 1,252
- 45 to 59 minutes: 1,621
- 60 to 89 minutes: 1,163
- 90 or more minutes: 1,746
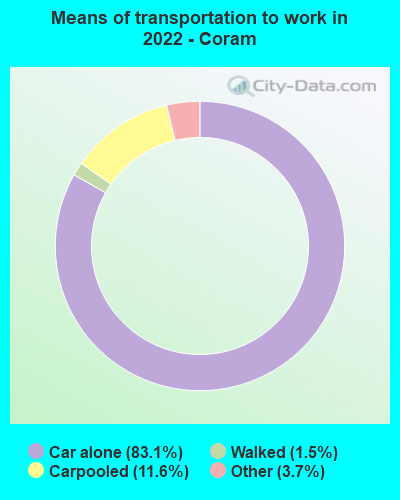
Means of transportation to work:
- Drove a car alone: 5,690 (65.7%)
- Carpooled: 908 (10.5%)
- Long-distance train or commuter rail: 6 (0.1%)
- Taxi: 317 (3.7%)
- Walked: 113 (1.3%)
- Worked at home: 1,881 (21.7%)
- Unemployment by race in 2022
- Unemployment rate for White non-Hispanic residents
- 2.6%Males
- 2.6%Females
- Unemployment rate for Black residents
- 2.7%Males
- 1.9%Females
- Unemployment rate for Asian residents
- 3.4%Males
- 3.0%Females
- Unemployment rate for other race residents
- 9.9%Females
- Unemployment rate for two or more race residents
- 2.5%Males
- 6.2%Females
- Unemployment rate for Hispanic or Latino residents
- 3.1%Males
- 5.0%Females
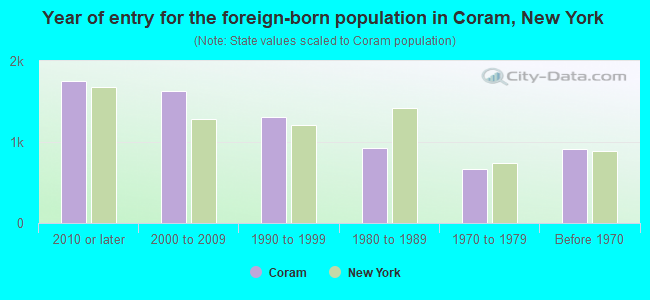
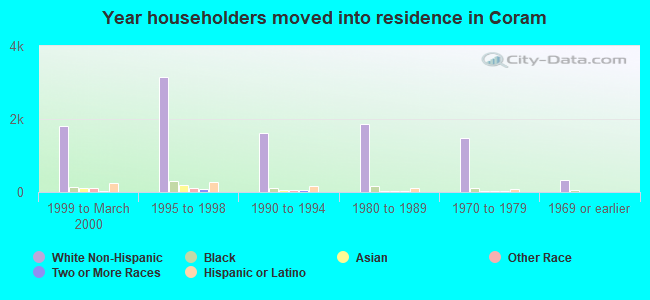
- Year of entry for the foreign-born population in Coram, New York
- 1,7592010 or later
- 1,6242000 to 2009
- 1,3081990 to 1999
- 9221980 to 1989
- 6681970 to 1979
- 917Before 1970
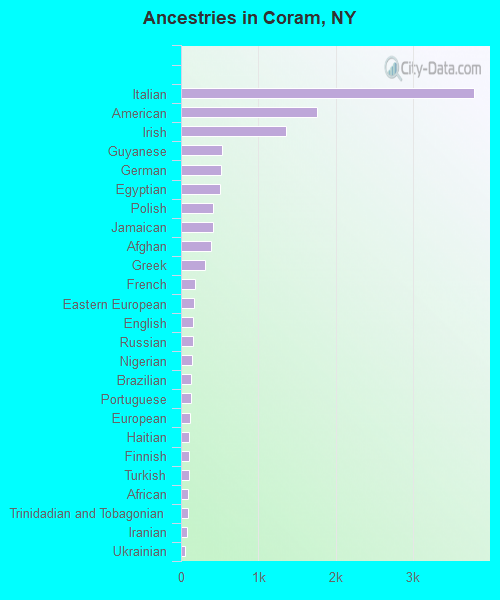
First ancestries reported:
- Italian: 3,794 (18.9%)
- American: 1,761 (8.8%)
- Irish: 1,355 (6.8%)
- Guyanese: 524 (2.6%)
- German: 515 (2.6%)
- Egyptian: 505 (2.5%)
- Polish: 414 (2.1%)
- Jamaican: 408 (2.0%)
- Afghan: 387 (1.9%)
- Greek: 310 (1.5%)
- French: 185 (0.9%)
- Eastern European: 166 (0.8%)
- English: 156 (0.8%)
- Russian: 153 (0.8%)
- Nigerian: 147 (0.7%)
- Brazilian: 126 (0.6%)
- Portuguese: 125 (0.6%)
- European: 122 (0.6%)
- Haitian: 107 (0.5%)
- Finnish: 105 (0.5%)
- Turkish: 99 (0.5%)
- African: 97 (0.5%)
- Trinidadian and Tobagonian: 88 (0.4%)
- Iranian: 82 (0.4%)
- Ukrainian: 49 (0.2%)
- Swedish: 33 (0.2%)
- Barbadian: 33 (0.2%)
- Jordanian: 32 (0.2%)
- Israeli: 24 (0.1%)
- French Canadian: 22 (0.1%)
- Hungarian: 19 (0.09%)
- Czechoslovakian: 18 (0.09%)
- Dutch: 17 (0.08%)
- Czech: 15 (0.07%)
- Scandinavian: 15 (0.07%)
- Austrian: 12 (0.06%)
- Norwegian: 11 (0.05%)
- Scottish: 11 (0.05%)
- Bulgarian: 11 (0.05%)
- Romanian: 9 (0.04%)
- Maltese: 7 (0.03%)
- Croatian: 7 (0.03%)
Most common places of birth for foreign-born residents (%):
| Coram: | 9.6% (643) |
| New York: | 3.8% (172,129) |
| Coram: | 7.9% (532) |
| New York: | 11.1% (501,040) |
| Coram: | 6.9% (467) |
| New York: | 0.1% (5,468) |
| Coram: | 5.8% (391) |
| New York: | 3.5% (158,432) |
| Coram: | 5.0% (336) |
| New York: | 5.0% (227,557) |
| Coram: | 4.7% (319) |
| New York: | 2.5% (111,920) |
| Coram: | 4.3% (288) |
| New York: | 1.4% (62,442) |
| Coram: | 3.6% (242) |
| New York: | 1.8% (82,786) |
| Coram: | 3.5% (234) |
| New York: | 2.4% (108,067) |
| Coram: | 3.0% (205) |
| New York: | 9.1% (410,910) |
| Coram: | 3.0% (200) |
| New York: | 0.2% (8,745) |
| Coram: | 2.9% (196) |
| New York: | 0.6% (25,782) |
| Coram: | 2.6% (173) |
| New York: | 1.8% (81,374) |
| Coram: | 2.6% (173) |
| New York: | 0.6% (27,385) |
| Coram: | 2.4% (158) |
| New York: | 0.6% (28,604) |
| Coram: | 2.0% (135) |
| New York: | 2.0% (91,428) |
| Coram: | 1.9% (130) |
| New York: | 1.4% (65,102) |
| Coram: | 1.9% (129) |
| New York: | 1.2% (55,571) |
| Coram: | 1.9% (126) |
| New York: | 1.3% (59,107) |
| Coram: | 1.8% (118) |
| New York: | 0.7% (33,746) |
| Coram: | 1.6% (108) |
| New York: | 1.4% (61,245) |
| Coram: | 1.6% (106) |
| New York: | 0.2% (10,519) |
Place of birth for U.S.-born residents:
- This state: 31,626
- Other state: 2,693
- Northeast: 1,091
- Midwest: 381
- South: 772
- West: 429
87.0% of Coram residents lived in the same house 1 years ago.
Out of people who lived in different houses, 40.7% lived in this county.
Out of people who lived in different counties, 76.5% lived in New York.
| Coram: | 87.0% |
| State average: | 89.6% |
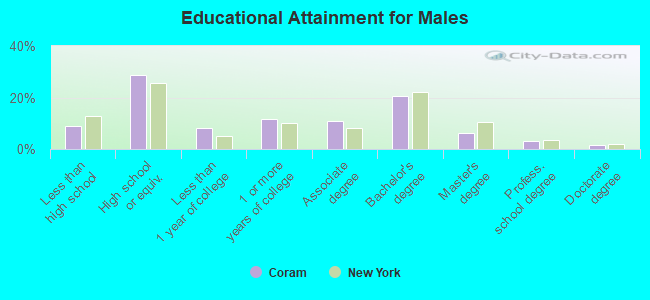
Education attainment for males 25 years and older:
- No schooling: 268
- Nursery to 4th grade: 12
- 5th and 6th grade: 11
- 7th and 8th grade: 81
- 9th grade: 82
- 10th grade: 143
- 11th grade: 212
- 12th grade, no diploma: 455
- High school graduate (or equivalency): 4,019
- Less than 1 year of college: 1,125
- Some college more than 1 year, no degree: 1,605
- Associate degree: 1,542
- Bachelor's degree: 2,883
- Master's degree: 872
- Professional school degree: 440
- Doctorate degree: 227
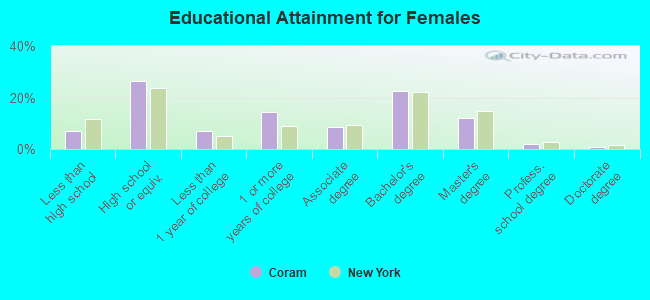
Education attainment for females 25 years and older:
- No schooling: 116
- Nursery to 4th grade: 0
- 5th and 6th grade: 49
- 7th and 8th grade: 204
- 9th grade: 97
- 10th grade: 234
- 11th grade: 190
- 12th grade, no diploma: 185
- High school graduate (or equivalency): 4,132
- Less than 1 year of college: 1,071
- Some college more than 1 year, no degree: 2,235
- Associate degree: 1,330
- Bachelor's degree: 3,497
- Master's degree: 1,910
- Professional school degree: 287
- Doctorate degree: 93


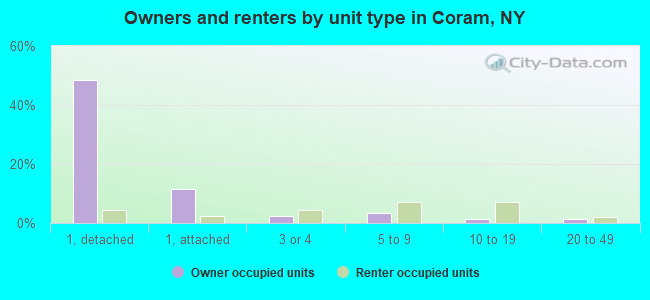
Housing units in structures:
- One, detached: 8,596
- One, attached: 2,341
- Two: 609
- 3 or 4: 907
- 5 to 9: 1,594
- 10 to 19: 1,319
- 20 to 49: 504
- 50 or more: 394
House/condo owner moved in on average 13 years ago
Renter moved in on average 2 years ago
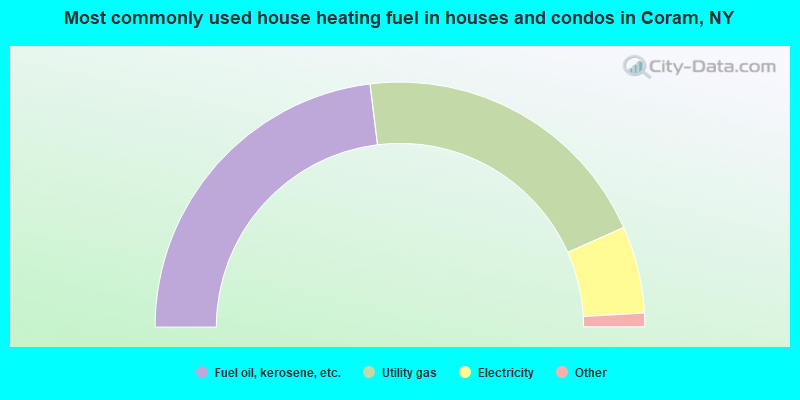
- 46.1%Fuel oil, kerosene, etc.
- 40.6%Utility gas
- 11.5%Electricity
- 0.9%Bottled, tank, or LP gas
- 0.5%Wood
- 0.4%Solar energy
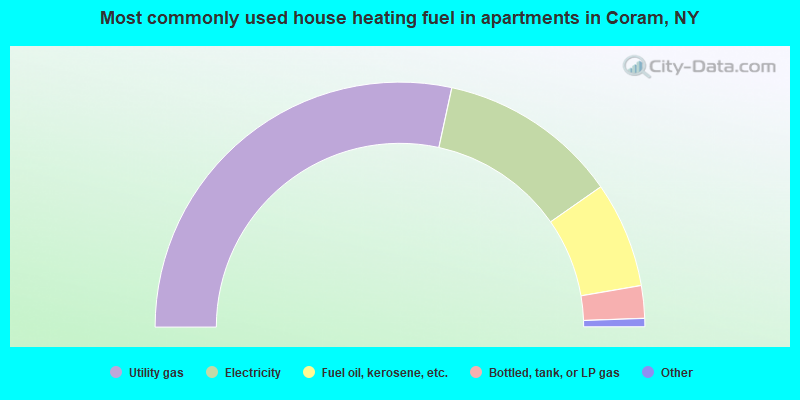
- 56.8%Utility gas
- 23.8%Electricity
- 14.0%Fuel oil, kerosene, etc.
- 4.3%Bottled, tank, or LP gas
- 0.9%No fuel used
- 0.2%Other fuel
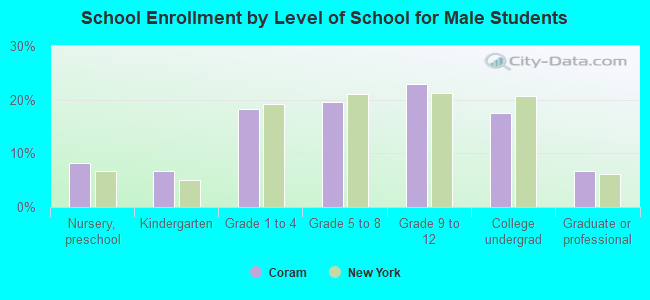
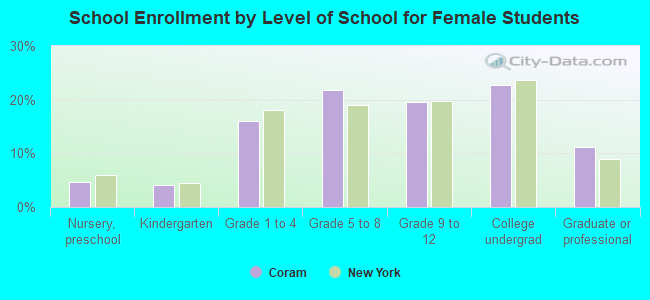
Private vs. public school enrollment:
| Here: | 3.3% |
| New York: | 15.6% |
| Here: | 7.1% |
| New York: | 15.0% |
| Here: | 16.8% |
| New York: | 39.2% |