Conyngham, PA (Pennsylvania) Houses and Residents
| Conyngham: | $232,699 |
| Pennsylvania: | $245,500 |
Mean price in 2022:
Detached houses: $272,411
Here: $272,411 State: $317,202 Townhouses or other attached units: $163,446
Here: $163,446 State: $254,369
Total population: 1,888 (All urban)
Houses: 813 (732 occupied: 565 owner occupied, 176 renter occupied)
| % of renters here: | 24% |
| State: | 31% |
Housing density: 762 houses/condos per square mile
Median price asked for vacant for-sale houses and condos in 2022 in this county: $138,564.
Median contract rent in 2022: $847 (lower quartile is $713, upper quartile is $947)
Median rent asked for vacant for-rent units in 2022: $596
Median gross rent in Conyngham, PA in 2022: $949
Housing units in Conyngham with a mortgage: 253 (41 second mortgage, 0 home equity loan, 29 both second mortgage and home equity loan)
Houses without a mortgage: 21
Median household income for houses/condos with a mortgage: $106,418
Median household income for apartments without a mortgage: $74,988
Median monthly housing costs: $912
Compare current foreclosures near Conyngham, PA:
| Photo | Address | Area | Beds / Baths | Price | Details |
|---|---|---|---|---|---|

|
#1
Main St
Conyngham, PA 18219
|
- sq. feet
|
- baths - beds |
show details | |

|
#2
W Main St
Nanticoke, PA 18634
|
1,474 sq. feet
|
1 baths 3 beds |
$214,750
|
show details |

|
#3
W Kline Ave
Lansford, PA 18232
|
998 sq. feet
|
1 baths 2 beds |
$104,500
|
show details |

|
#4
W Spruce St
Mahanoy City, PA 17948
|
1,408 sq. feet
|
1 baths 4 beds |
$35,163
|
show details |

|
#5
S Lehigh Ave
Frackville, PA 17931
|
1,696 sq. feet
|
1 baths 3 beds |
$67,664
|
show details |

|
#6
W Mount Vernon St
Shenandoah, PA 17976
|
900 sq. feet
|
1 baths 2 beds |
$6,216
|
show details |

|
#7
1st St
Coaldale, PA 18218
|
1,519 sq. feet
|
1 baths 2 beds |
$3,066
|
show details |

|
#8
Market St
Tamaqua, PA 18252
|
1,265 sq. feet
|
1 baths 3 beds |
$63,376
|
show details |

|
#9
Hotel Ln
Barnesville, PA 18214
|
1,316 sq. feet
|
1 baths 3 beds |
$140,761
|
show details |

|
#10
Hazle St
Tamaqua, PA 18252
|
1,576 sq. feet
|
1 baths 3 beds |
$69,864
|
show details |
| Photo | Address | Area | Beds / Baths | Price | Details |
|---|---|---|---|---|---|

|
#11
Virginia Ave
Shenandoah, PA 17976
|
1,311 sq. feet
|
1 baths 3 beds |
$6,313
|
show details |

|
#12
Golf Rd
Barnesville, PA 18214
|
1,440 sq. feet
|
1 baths 2 beds |
$3,893
|
show details |

|
#13
Orwigsburg St
Tamaqua, PA 18252
|
1,455 sq. feet
|
1 baths 3 beds |
$47,280
|
show details |

|
#14
E Fell St
Summit Hill, PA 18250
|
1,024 sq. feet
|
1 baths 3 beds |
show details | |

|
#15
Main St
Hazleton, PA 18201
|
1,194 sq. feet
|
1 baths 2 beds |
show details | |

|
#16
N James St
Kelayres, PA 18231
|
- sq. feet
|
1 baths 3 beds |
show details | |

|
#17
5th St
Nescopeck, PA 18635
|
- sq. feet
|
1 baths 3 beds |
show details | |

|
#18
E Phillips St
Coaldale, PA 18218
|
1,281 sq. feet
|
1 baths 2 beds |
show details | |

|
#19
E Ridge St
Nanticoke, PA 18634
|
1,328 sq. feet
|
1 baths 3 beds |
show details | |

|
#20
Woodhaven Dr
White Haven, PA 18661
|
- sq. feet
|
- baths - beds |
$29,900
|
show details |
| Photo | Address | Area | Beds / Baths | Price | Details |
|---|---|---|---|---|---|

|
#21
Woodside Dr
Freeland, PA 18224
|
1,322 sq. feet
|
1 baths 3 beds |
show details | |

|
#22
E Ludlow St
Summit Hill, PA 18250
|
1,184 sq. feet
|
1 baths 3 beds |
show details | |

|
#23
North St
Freeland, PA 18224
|
1,744 sq. feet
|
2 baths 3 beds |
show details | |

|
#24
W 23rd St
Hazleton, PA 18202
|
- sq. feet
|
1 baths 3 beds |
show details | |

|
#25
Lauderburn Ave
Weatherly, PA 18255
|
1,652 sq. feet
|
1 baths 3 beds |
show details | |

|
#26
Martzville Rd
Berwick, PA 18603
|
1,865 sq. feet
|
1 baths 2 beds |
show details | |

|
#27
Walnut St
White Haven, PA 18661
|
1,175 sq. feet
|
1 baths 2 beds |
show details | |

|
#28
S Main St
Wilkes Barre, PA 18706
|
1,728 sq. feet
|
1 baths 3 beds |
show details | |

|
#29
Shingle Mill Dr
Drums, PA 18222
|
1,418 sq. feet
|
2 baths 3 beds |
show details | |

|
#30
E Coal St
Shenandoah, PA 17976
|
3,502 sq. feet
|
1 baths 3 beds |
show details |
| Photo | Address | Area | Beds / Baths | Price | Details |
|---|---|---|---|---|---|

|
#31
Miner Street
Coaldale, PA 18218
|
- sq. feet
|
- baths - beds |
$3,440
|
show details |

|
#32
West Main Street
Quakake, PA 18245
|
- sq. feet
|
- baths - beds |
$86,496
|
show details |

|
#33
West Main Street
Quakake, PA 18245
|
- sq. feet
|
- baths - beds |
$6,014
|
show details |

|
#34
Peach Ln
Berwick, PA 18603
|
- sq. feet
|
5 baths 3 beds |
show details | |

|
#35
Brew St
Tamaqua, PA 18252
|
929 sq. feet
|
1 baths 2 beds |
show details | |

|
#36
Florida Ave
Shenandoah, PA 17976
|
1,224 sq. feet
|
1 baths 3 beds |
show details | |

|
#37
Walnut Street
Delano, PA 18220
|
- sq. feet
|
- baths - beds |
$58,737
|
show details |

|
#38
Kline St
Weatherly, PA 18255
|
1,178 sq. feet
|
1 baths 2 beds |
show details | |

|
#39
E Coal St
Shenandoah, PA 17976
|
1,140 sq. feet
|
1 baths 3 beds |
show details | |

|
#40
7th St
Weatherly, PA 18255
|
1,500 sq. feet
|
2 baths 2 beds |
show details |
| Photo | Address | Area | Beds / Baths | Price | Details |
|---|---|---|---|---|---|

|
#41
E Main St
Weatherly, PA 18255
|
1,084 sq. feet
|
1 baths 3 beds |
show details | |

|
#42
North St
Weatherly, PA 18255
|
1,290 sq. feet
|
2 baths 3 beds |
show details | |

|
#43
E Centre St
Mahanoy City, PA 17948
|
1,272 sq. feet
|
1 baths 3 beds |
show details | |

|
#44
W Arlington St
Shenandoah, PA 17976
|
- sq. feet
|
- baths - beds |
$3,382
|
show details |

|
#45
W Miner St
Coaldale, PA 18218
|
1,509 sq. feet
|
1 baths 2 beds |
show details | |

|
#46
Van Gelder St
Tamaqua, PA 18252
|
- sq. feet
|
- baths - beds |
$3,095
|
show details |

|
#47
Washington St
Tamaqua, PA 18252
|
1,968 sq. feet
|
1 baths 4 beds |
show details | |

|
#48
E Abbott St
Lansford, PA 18232
|
1,064 sq. feet
|
1 baths 2 beds |
show details | |

|
#49
N Broad Mountain Ave
Frackville, PA 17931
|
1,440 sq. feet
|
1 baths 3 beds |
show details | |

|
Check over 1 million property listings on Foreclosure.com!
|
browse all offers | |||

Latest news about housing in Conyngham, PA collected exclusively by city-data.com from local newspapers, TV, and radio stations

 | Buying in Conyngham (0 replies) |
| Most Magnificent Homes in NEPA (5 replies) |
| Am I assuming correctly? (20 replies) |
| Why So Much Hatred for Scranton? (52 replies) |
| Moved to NEPA transplants and opinions (137 replies) |
| New Upscale Housing Coming to Downtown Scranton (312 replies) |

Median year apartment built: 1967
Household type by relationship:
Households: 1,641- Male householders: 373 (130 living alone), Female householders: 359 (106 living alone)
425 spouses (425 opposite-sex spouses), 53 unmarried partners, (53 opposite-sex unmarried partners), 319 children (311 natural, 0 adopted, 8 stepchildren), 31 grandchildren, 8 brothers or sisters, 26 parents, 0 foster children, 11 other relatives, 35 non-relatives
Size of family households: 333 2-persons, 57 3-persons, 90 4-persons, 14 5-persons, 13 6-persons.
Size of nonfamily households: 228 1-person.
99 married couples with children.
110 single-parent households (12 men, 98 women).
87.1% of residents of Conyngham speak English at home.
5.6% of residents speak Spanish at home (71% speak English very well, 25% speak English well, 4% speak English not well).
2.4% of residents speak other Indo-European language at home (100% speak English very well).
4.9% of residents speak Asian or Pacific Island language at home (58% speak English very well, 9% speak English well, 33% don't speak English at all).
Foreign born population: 130 (7.9%)
(43.1% of them are naturalized citizens)
| Here: | 7.4 |
| State: | 6.8 |
| Here: | 4.3 |
| State: | 4.3 |

- Bedrooms in owner-occupied houses and condos in Conyngham, Pennsylvania
- 0no bedroom
- 111 bedroom
- 432 bedrooms
- 2893 bedrooms
- 1864 bedrooms
- 375+ bedrooms

- Bedrooms in renter-occupied apartments in Conyngham, Pennsylvania
- 0no bedroom
- 251 bedroom
- 1222 bedrooms
- 293 bedrooms
- 04 bedrooms
- 05+ bedrooms

- Cars and other vehicles available in Conyngham in owner-occupied houses/condos
- 21no vehicle
- 1381 vehicle
- 1952 vehicles
- 1273 vehicles
- 524 vehicles
- 325+ vehicles

- Cars and other vehicles available in Conyngham in renter-occupied apartments
- 0no vehicle
- 1361 vehicle
- 292 vehicles
- 03 vehicles
- 04 vehicles
- 115+ vehicles

- Rooms in owner-occupied houses in Conyngham, Pennsylvania
- 01 room
- 02 rooms
- 03 rooms
- 34 rooms
- 385 rooms
- 966 rooms
- 1697 rooms
- 1248 rooms
- 1369+ rooms

- Rooms in renter-occupied apartments in Conyngham, Pennsylvania
- 01 room
- 02 rooms
- 253 rooms
- 824 rooms
- 565 rooms
- 136 rooms
- 07 rooms
- 08 rooms
- 09+ rooms


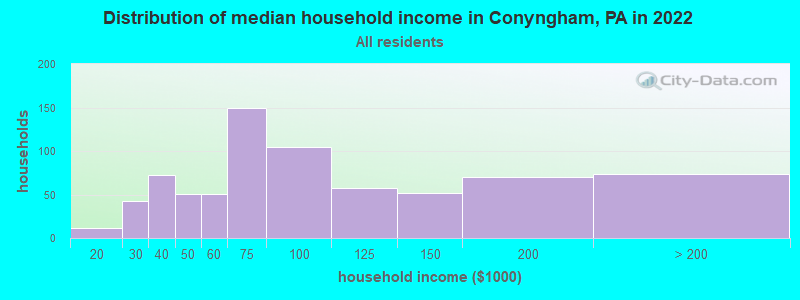
Conyngham, PA household income distribution

- 12$10,000 to $19,999
- 43$20,000 to $29,999
- 72$30,000 to $39,999
- 51$40,000 to $49,999
- 51$50,000 to $59,999
- 150$60,000 to $74,999
- 105$75,000 to $99,999
- 58$100,000 to $124,999
- 52$125,000 to $149,999
- 70$150,000 to $199,999
- 74$200,000 or more
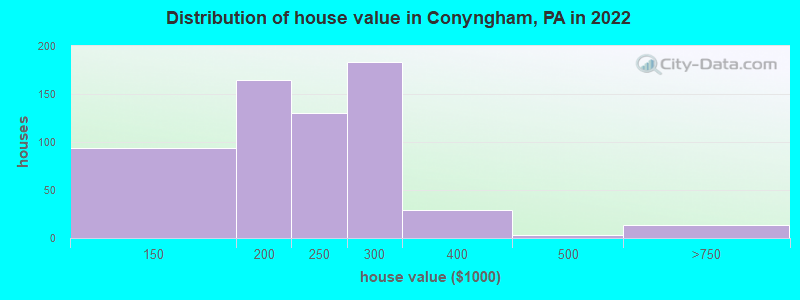
Home value of owner - occupied houses in 2022 in Conyngham, PA
-
- 50$100,000 to $124,999
- 43$125,000 to $149,999
- 118$150,000 to $174,999
- 46$175,000 to $199,999
- 129$200,000 to $249,999
- 183$250,000 to $299,999
- 28$300,000 to $399,999
- 2$400,000 to $499,999
- 13$500,000 to $749,999
Rent paid by renters in 2022 in Conyngham, PA
-
- 15$450 to $499
- 6$550 to $599
- 24$650 to $699
- 9$700 to $749
- 11$750 to $799
- 64$800 to $899
- 41$1,000 to $1,249
- 12No cash rent


Percentage of workers working in this county: 83.7%
Number of people working at home: 36 (3.9% of all workers)
Travel time to work (commute)
- Less than 5 minutes: 56
- 5 to 9 minutes: 58
- 10 to 14 minutes: 155
- 15 to 19 minutes: 297
- 20 to 24 minutes: 113
- 25 to 29 minutes: 70
- 30 to 34 minutes: 36
- 35 to 39 minutes: 0
- 40 to 44 minutes: 30
- 45 to 59 minutes: 33
- 60 to 89 minutes: 13
- 90 or more minutes: 16
Means of transportation to work:
- Drove a car alone: 830 (87.3%)
- Carpooled: 83 (8.7%)
- Worked at home: 38 (4.0%)


- Year of entry for the foreign-born population in Conyngham, Pennsylvania
- 72010 or later
- 632000 to 2009
- 71990 to 1999
- 71980 to 1989
- 71970 to 1979
- 30Before 1970

First ancestries reported:
- Irish: 111 (14.4%)
- Polish: 102 (13.2%)
- English: 75 (9.7%)
- German: 70 (9.1%)
- Italian: 40 (5.2%)
- Slovak: 39 (5.1%)
- Scottish: 38 (4.9%)
- Serbian: 25 (3.2%)
- Pennsylvania German: 21 (2.7%)
- Austrian: 13 (1.7%)
- American: 11 (1.4%)
- European: 11 (1.4%)
- Yugoslavian: 11 (1.4%)
- Czechoslovakian: 10 (1.3%)
- Canadian: 7 (0.9%)
- Scandinavian: 7 (0.9%)
- Ukrainian: 6 (0.8%)
- Russian: 5 (0.6%)
Most common places of birth for foreign-born residents (%):
| Conyngham: | 23.3% (30) |
| Pennsylvania: | 0.7% (6,643) |
| Conyngham: | 20.9% (27) |
| Pennsylvania: | 7.2% (67,704) |
| Conyngham: | 20.9% (27) |
| Pennsylvania: | 9.2% (86,544) |
| Conyngham: | 10.9% (14) |
| Pennsylvania: | 1.9% (18,065) |
| Conyngham: | 7.8% (10) |
| Pennsylvania: | 1.8% (17,032) |
| Conyngham: | 5.4% (7) |
| Pennsylvania: | 2.2% (21,039) |
| Conyngham: | 5.4% (7) |
| Pennsylvania: | 2.9% (27,433) |
| Conyngham: | 4.7% (6) |
| Pennsylvania: | 0.6% (6,097) |
Place of birth for U.S.-born residents:
- This state: 1,236
- Other state: 212
- Northeast: 130
- Midwest: 17
- South: 64
- West: 0
91.4% of Conyngham residents lived in the same house 1 years ago.
Out of people who lived in different houses, 47.7% lived in this county.
Out of people who lived in different counties, 100.0% lived in Pennsylvania.
| Conyngham: | 91.4% |
| State average: | 89.3% |
Education attainment for males 25 years and older:
- No schooling: 0
- Nursery to 4th grade: 0
- 5th and 6th grade: 0
- 7th and 8th grade: 21
- 9th grade: 0
- 10th grade: 0
- 11th grade: 19
- 12th grade, no diploma: 0
- High school graduate (or equivalency): 168
- Less than 1 year of college: 14
- Some college more than 1 year, no degree: 80
- Associate degree: 105
- Bachelor's degree: 156
- Master's degree: 134
- Professional school degree: 1
- Doctorate degree: 10

Education attainment for females 25 years and older:
- No schooling: 6
- Nursery to 4th grade: 0
- 5th and 6th grade: 0
- 7th and 8th grade: 10
- 9th grade: 0
- 10th grade: 9
- 11th grade: 0
- 12th grade, no diploma: 0
- High school graduate (or equivalency): 216
- Less than 1 year of college: 9
- Some college more than 1 year, no degree: 37
- Associate degree: 103
- Bachelor's degree: 149
- Master's degree: 46
- Professional school degree: 0
- Doctorate degree: 31


Housing units in structures:
- One, detached: 653
- One, attached: 57
- Two: 11
- 3 or 4: 25
- 5 to 9: 48
- 10 to 19: 12
- Mobile homes: 6
House/condo owner moved in on average 19 years ago
Renter moved in on average 5 years ago

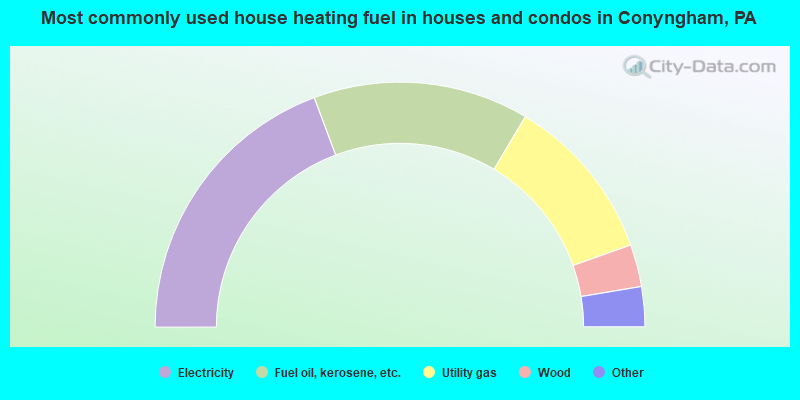
- 38.8%Electricity
- 28.6%Fuel oil, kerosene, etc.
- 22.1%Utility gas
- 5.6%Wood
- 3.8%Coal or coke
- 0.7%Other fuel
- 0.4%Bottled, tank, or LP gas
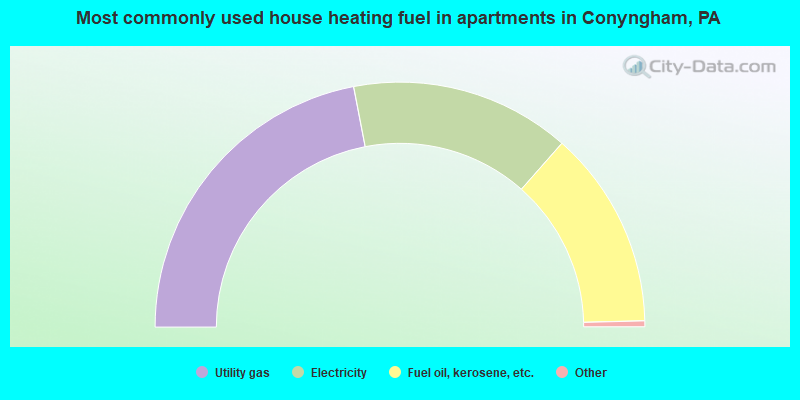
- 44.3%Utility gas
- 29.3%Electricity
- 26.4%Fuel oil, kerosene, etc.
Private vs. public school enrollment:
| Here: | 13.5% |
| Pennsylvania: | 15.7% |
| Here: | 0.0% |
| Pennsylvania: | 13.4% |
| Here: | 0.0% |
| Pennsylvania: | 39.8% |


