Jump to a detailed profile or search site with Google Custom Search

Colton, OR (Oregon) Houses and Residents

Estimated median house or condo value in 2022: $642,110 (it was $202,700 in 2000)
Colton:

$642,110
Oregon:

$475,600
Lower value quartile - upper value quartile: $452,889 - $752,599

Total population: 5,557 (Urban population: 0, Rural population: 5,024 (326 farm, 4,698 nonfarm))

Houses: 1,783 (1,708 occupied: 1,443 owner occupied, 265 renter occupied)

% of renters here:

16%
State:

37%

Housing density: 17 houses/condos per square mile

Median price asked for vacant for-sale houses and condos in 2022 in this county: $788,071.

Median contract rent in 2022: $1,405 (lower quartile is $824, upper quartile is over $2,000)


Median rent asked for vacant for-rent units in 2022: $963


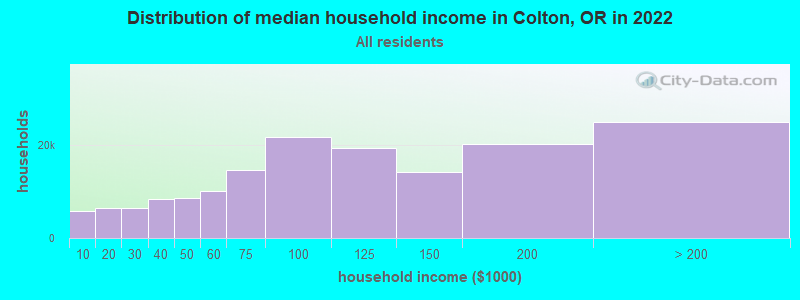
Median gross rent in Colton, OR in 2022: $1,656

Housing units in Colton with a mortgage: 681 (110 second mortgage, 89 home equity loan, 5 both second mortgage and home equity loan)
Houses without a mortgage: 178

Compare current foreclosures near Colton, OR:

Check out more offers near Colton, OR.
Powered by Foreclosure.com


Colton, Oregon Age and Sex of Residents

Household type by relationship:

Households: 373,239
  • In family households: 315,893 (73,770 male householders, 27,096 female householders)
    79,856 spouses, 107,451 children (98,993 natural, 3,285 adopted, 5,173 stepchildren), 6,228 grandchildren, 2,852 brothers or sisters, 2,991 parents, foster children, 3,486 other relatives, 9,508 non-relatives
  • In nonfamily households: 57,346 (20,413 male householders (14,825 living alone)), 24,511 female householders (20,254 living alone)), 12,422 nonrelatives
  • In group quarters: 2,753 (1,340 institutionalized population)

65,696 married couples with children.
15,935 single-parent households (4,341 men, 11,594 women).

96.4% of residents of Colton speak English at home.
1.9% of residents speak Spanish at home (73% speak English very well, 24% speak English well, 3% speak English not well).
1.5% of residents speak other Indo-European language at home (88% speak English very well, 12% speak English well).
0.2% of residents speak Asian or Pacific Island language at home (100% speak English very well).

Foreign born population: 161 (2.6%)
(101.9% of them are naturalized citizens)

Median number of rooms in houses and condos:
Here:

6.9
State:

6.2

Median number of rooms in apartments
Here:

4.1
State:

4.0

Owner-occupied Renter-occupied
Bedrooms in owner-occupied houses and condos in Colton, Oregon
  • Bedrooms in owner-occupied houses and condos in Colton, Oregon
  • 3no bedroom
  • 551 bedroom
  • 3042 bedrooms
  • 8113 bedrooms
  • 2324 bedrooms
  • 385+ bedrooms
Bedrooms in renter-occupied apartments in Colton, Oregon
  • Bedrooms in renter-occupied apartments in Colton, Oregon
  • 19no bedroom
  • 471 bedroom
  • 1092 bedrooms
  • 583 bedrooms
  • 264 bedrooms
  • 65+ bedrooms
Owner-occupied Renter-occupied
Cars and other vehicles available in Colton in owner-occupied houses/condos
  • Cars and other vehicles available in Colton in owner-occupied houses/condos
  • 30no vehicle
  • 1971 vehicle
  • 5432 vehicles
  • 3903 vehicles
  • 1764 vehicles
  • 1075+ vehicles
Cars and other vehicles available in Colton in renter-occupied apartments
  • Cars and other vehicles available in Colton in renter-occupied apartments
  • 19no vehicle
  • 871 vehicle
  • 1092 vehicles
  • 333 vehicles
  • 84 vehicles
  • 95+ vehicles
Owner-occupied Renter-occupied
Rooms in owner-occupied houses in Colton, Oregon
  • Rooms in owner-occupied houses in Colton, Oregon
  • 01 room
  • 72 rooms
  • 673 rooms
  • 1344 rooms
  • 3015 rooms
  • 3626 rooms
  • 2667 rooms
  • 1338 rooms
  • 1739+ rooms
Rooms in renter-occupied apartments in Colton, Oregon
  • Rooms in renter-occupied apartments in Colton, Oregon
  • 191 room
  • 412 rooms
  • 283 rooms
  • 714 rooms
  • 215 rooms
  • 386 rooms
  • 187 rooms
  • 238 rooms
  • 69+ rooms
Year house built
Breakdown of mean house values by ages of householders
Owners and renters by unit type in Colton, OR
  • Colton, OR household income distribution

  • Distribution of median household income in Colton, OR in 2022
  • 5,749Less than $10,000
  • 6,468$10,000 to $19,999
  • 6,472$20,000 to $29,999
  • 8,332$30,000 to $39,999
  • 8,615$40,000 to $49,999
  • 10,192$50,000 to $59,999
  • 14,558$60,000 to $74,999
  • 21,662$75,000 to $99,999
  • 19,348$100,000 to $124,999
  • 14,191$125,000 to $149,999
  • 20,184$150,000 to $199,999
  • 24,943$200,000 or more

Percentage of workers working in this county: 87.8%
Number of people working at home: 659 (22.0% of all workers)

Travel time to work (commute)

  • Less than 5 minutes: 31
  • 5 to 9 minutes: 95
  • 10 to 14 minutes: 151
  • 15 to 19 minutes: 225
  • 20 to 24 minutes: 169
  • 25 to 29 minutes: 195
  • 30 to 34 minutes: 215
  • 35 to 39 minutes: 174
  • 40 to 44 minutes: 148
  • 45 to 59 minutes: 469
  • 60 to 89 minutes: 242
  • 90 or more minutes: 100

Means of transportation to work:

  • Drove a car alone: 1,979 (83.5%)
  • Carpooled: 215 (9.1%)
  • Bus or trolley bus: 9 (0.4%)
  • Streetcar or trolley car: 11 (0.5%)
  • Worked at home: 155 (6.5%)
Class of Workers in 2000
Year of entry for the foreign-born population in Colton, Oregon
  • Year of entry for the foreign-born population in Colton, Oregon
  • 01995 to March 2000
  • 61990 to 1994
  • 291985 to 1989
  • 71980 to 1984
  • 61975 to 1979
  • 241970 to 1974
  • 121965 to 1969
  • 32Before 1965

Most common places of birth for foreign-born residents (%):

Mexico
Colton:

33.6% (39)
Oregon:

39.0% (113,083)

Canada
Colton:

13.8% (16)
Oregon:

5.9% (17,137)

Austria
Colton:

11.2% (13)
Oregon:

0.2% (584)

Germany
Colton:

10.3% (12)
Oregon:

3.0% (8,568)

Ireland
Colton:

8.6% (10)
Oregon:

0.3% (923)

Panama
Colton:

6.9% (8)
Oregon:

0.2% (452)

United Kingdom
Colton:

6.0% (7)
Oregon:

3.3% (9,473)

Netherlands
Colton:

5.2% (6)
Oregon:

0.8% (2,237)

Korea
Colton:

4.3% (5)
Oregon:

3.6% (10,488)

Place of birth for U.S.-born residents:

  • This state: 3,079
  • Other state: 1,794
  • Northeast: 109
  • Midwest: 378
  • South: 218
  • West: 1,089

62% of Colton residents lived in the same house 5 years ago.
   Out of people who lived in different houses, 57% lived in this county.
   Out of people who lived in different counties, 51% lived in Oregon.

Education attainment for males 25 years and older:

  • No schooling: 3
  • Nursery to 4th grade: 0
  • 5th and 6th grade: 5
  • 7th and 8th grade: 23
  • 9th grade: 13
  • 10th grade: 60
  • 11th grade: 17
  • 12th grade, no diploma: 101
  • High school graduate (or equivalency): 536
  • Less than 1 year of college: 198
  • Some college more than 1 year, no degree: 271
  • Associate degree: 128
  • Bachelor's degree: 196
  • Master's degree: 42
  • Professional school degree: 6
  • Doctorate degree: 0
Educational Attainment for Males

Education attainment for females 25 years and older:

  • No schooling: 9
  • Nursery to 4th grade: 0
  • 5th and 6th grade: 6
  • 7th and 8th grade: 28
  • 9th grade: 23
  • 10th grade: 50
  • 11th grade: 70
  • 12th grade, no diploma: 50
  • High school graduate (or equivalency): 609
  • Less than 1 year of college: 122
  • Some college more than 1 year, no degree: 301
  • Associate degree: 131
  • Bachelor's degree: 184
  • Master's degree: 37
  • Professional school degree: 3
  • Doctorate degree: 0
Educational Attainment for Females
Colton marital status for males
Colton marital status for females

Housing units in structures:

  • One, detached: 1,301
  • One, attached: 29
  • Two: 7
  • 3 or 4: 9
  • Mobile homes: 418
  • Boats, RVs, vans, etc.: 19

Median worth of mobile homes: $459,596

Year householders moved into residence in Colton
Houses and condos Apartments
Most commonly used house heating fuel in houses and condos in Colton, OR
  • 42.2%Electricity
  • 33.3%Wood
  • 10.1%Fuel oil, kerosene, etc.
  • 7.7%Bottled, tank, or LP gas
  • 4.6%Other fuel
  • 2.1%Utility gas
Most commonly used house heating fuel in apartments in Colton, OR
  • 59.6%Electricity
  • 23.0%Wood
  • 8.7%Bottled, tank, or LP gas
  • 6.0%Fuel oil, kerosene, etc.
  • 2.6%Other fuel

Private vs. public school enrollment:

Students in private schools in grades 1 to 8 (elementary and middle school): 82
Here:

10.6%
Oregon:

9.7%

Students in private schools in grades 9 to 12 (high school): 50
Here:

14.7%
Oregon:

7.6%

Students in private undergraduate colleges: 14
Here:

8.4%
Oregon:

16.1%
School Enrollment by Level of School for Male Students
School Enrollment by Level of School for Female Students
Age and Sex of Sensory-Disabled Noninstitutionalized Residents
Age and Sex of Physically-Disabled Noninstitutionalized Residents
Age and Sex of Mentally-Disabled Noninstitutionalized Residents
Age and Sex of Self-Care Disabled Noninstitutionalized Residents
Age and Sex of Go-Outside-Home Disabled Noninstitutionalized Residents
Age and Sex of Noninstitutionalized Residents with Employment Disability