Colton, CA (California) Houses and Residents
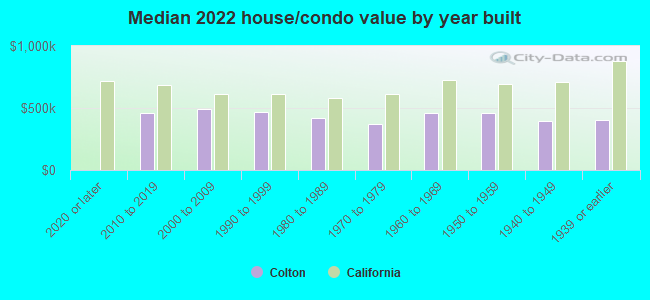
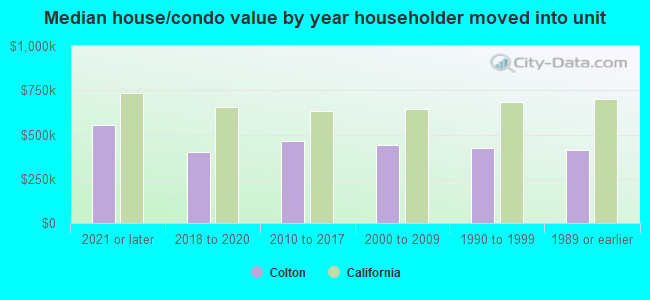
Estimated median house or condo value in 2022: $433,692 (it was $99,800 in 2000 )
Colton:
$433,692California:
$715,900
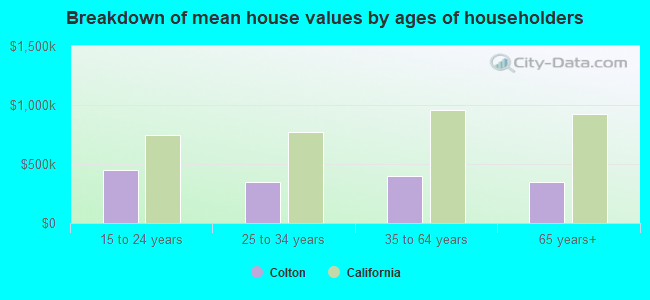
Lower value quartile - upper value quartile: $355,294 - $518,421Mean price in 2022: Detached houses: $348,016 Here:
$348,016State:
$988,808
Townhouses or other attached units: $258,271 Here:
$258,271State:
$838,546
In 2-unit structures: $309,839 Here:
$309,839State:
$1,138,100
In 3-to-4-unit structures: $150,246 Here:
$150,246State:
$824,253
In 5-or-more-unit structures: $237,783 Here:
$237,783State:
$730,996
Mobile homes: $60,556 Here:
$60,556State:
$184,506
Occupied boats, RVs, vans, etc.: $16,240 Here:
$16,240State:
$204,957
Total population: 54,053 (Urban population: 47,948, Rural population: 63 (48 farm, 15 nonfarm ))
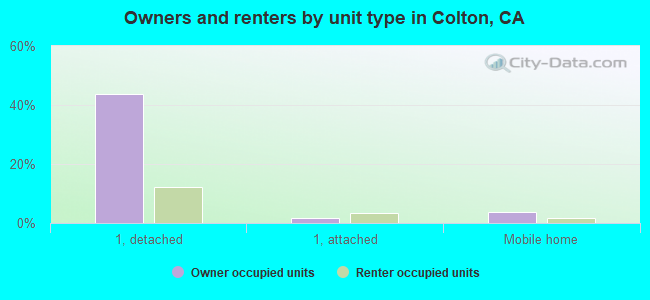
Houses: 18,345 (16,946 occupied: 8,808 owner occupied, 8,293 renter occupied )
% of renters here:
48%State:
44%
Housing density: 1,214 houses/condos per square mile
Median price asked for vacant for-sale houses and condos in 2022: $228,206.
Median contract rent in 2022: $1,346 (lower quartile is $1,065, upper quartile is $1,697)
Median rent asked for vacant for-rent units in 2022: $1,239
Median gross rent in Colton, CA in 2022: $1,528
Housing units in Colton with a mortgage: 5,856 (189 second mortgage, 0 home equity loan, 129 both second mortgage and home equity loan )Houses without a mortgage: 76
Median household income for houses/condos with a mortgage: $91,532
Median household income for apartments without a mortgage: $73,909
Median monthly housing costs: $1,455
Data:
Median house or condo value ($)
Median house or condo value ($ change since 2000)
Median house or condo value ($) - White
Median house or condo value ($) - Black or African American
Median house or condo value ($) - Asian
Median house or condo value ($) - Hispanic or Latino
Median house or condo value ($) - American Indian and Alaska Native
Median house or condo value ($) - Multirace
Median house or condo value ($) - Other Race
Median price asked for mobile homes ($)
Household density (households per square mile)
Mean house or condo value by units in structure - 1, detached ($)
Mean house or condo value by units in structure - 1, attached ($)
Mean house or condo value by units in structure - 2 ($)
Mean house or condo value by units in structure by units in structure - 3 or 4 ($)
Mean house or condo value by units in structure - 5 or more ($)
Mean house or condo value by units in structure - Boat, RV, van, etc. ($)
Mean house or condo value by units in structure - Mobile home ($)
Median contract rent ($)
Median contract rent - Lower quartile ($)
Median contract rent - Upper quartile ($)
Median gross rent ($)
Urban houses (%)
Rural houses (%)
Houses occupied (%)
Houses occupied (% change since 2000)
Houses owner occupied (%)
Houses owner occupied (% change since 2000)
Houses renter occupied (%)
Houses renter occupied (% change since 2000)
Vacant housing units - For rent (%)
Vacant housing units - For rent (% change since 2000)
Vacant housing units - For sale only (%)
Vacant housing units - For sale only (% change since 2000)
Vacant housing units - Rented or sold, not occupied (%)
Vacant housing units - Rented or sold, not occupied (% change since 2000)
Vacant housing units - For seasonal, recreational, or occasional use (%)
Vacant housing units - For seasonal, recreational, or occasional use (% change since 2000)
Vacant housing units - For migrant workers (%)
Vacant housing units - For migrant workers (% change since 2000)
Vacant housing units - Other vacant (%)
Vacant housing units - Other vacant (% change since 2000)
Median monthly housing costs ($)
Median household income for houses/condos with a mortgage ($)
Median household income for houses/condos without a mortgage ($)
Median household income ($)
Median household income ($) - White
Median household income ($) - Black or African American
Median household income ($) - Asian
Median household income ($) - Hispanic or Latino
Median household income ($) - American Indian and Alaska Native
Median household income ($) - Multirace
Median household income ($) - Other Race
Mortgage status - with mortgage (%)
Mortgage status - with second mortgage (%)
Mortgage status - with home equity loan (%)
Mortgage status - with both second mortgage and home equity loan (%)
Mortgage status - without a mortgage (%)
Median year house/condo built
Median year apartment built
Household type by relationship - Male householder living alone (%)
Household type by relationship - Male householder not living alone (%)
Household type by relationship - Female householder living alone (%)
Household type by relationship - Female householder not living alone (%)
Household type by relationship - Opposite-Sex spouse (%)
Household type by relationship - Same-Sex spouse (%)
Household type by relationship - Opposite-Sex unmarried partner (%)
Household type by relationship - Same-Sex unmarried partner (%)
Household type by relationship - In group quarters (%)
Size of family households - 2-person household (%)
Size of family households - 3-person household (%)
Size of family households - 4-person household (%)
Size of family households - 5-person household (%)
Size of family households - 6-person household (%)
Size of family households - 7-or-more-person household (%)
Size of nonfamily households - 1-person household (%)
Size of nonfamily households - 2-person household (%)
Size of nonfamily households - 3-person household (%)
Size of nonfamily households - 4-person household (%)
Size of nonfamily households - 5-person household (%)
Size of nonfamily households - 6-person household (%)
Size of nonfamily households - 7-or-moreperson household (%)
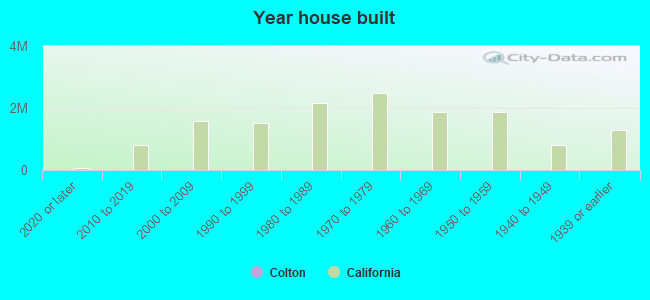
Year house built - Built 2010 or later (%)
Year house built - Built 2000 to 2009 (%)
Year house built - Built 1990 to 1999 (%)
Year house built - Built 1980 to 1989 (%)
Year house built - Built 1970 to 1979 (%)
Year house built - Built 1960 to 1969 (%)
Year house built - Built 1950 to 1959 (%)
Year house built - Built 1940 to 1949 (%)
Year house built - Built 1939 or earlier (%)
Median number of rooms in houses and condos
Median number of rooms in apartments
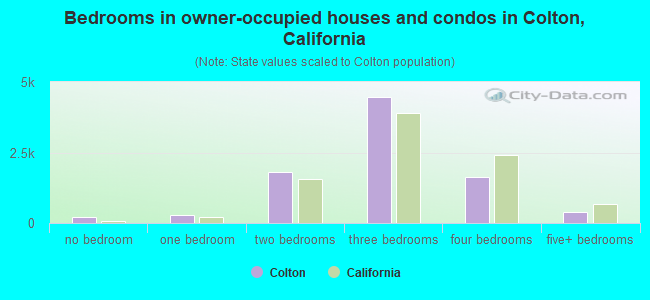
Median number of bedrooms in owner occupied houses
Mean number of bedrooms in owner occupied houses
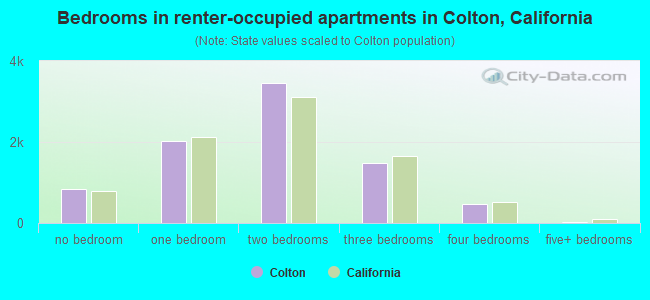
Median number of bedrooms in renter occupied houses
Mean number of bedrooms in renter occupied houses
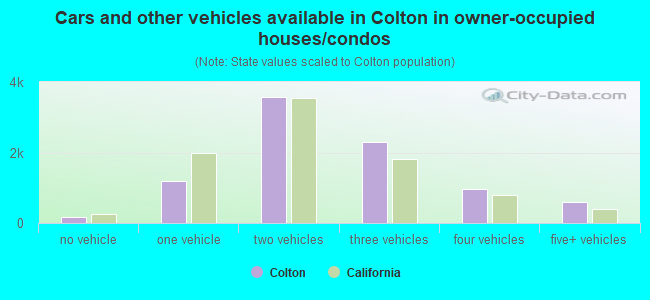
Median number of vehichles in owner occupied houses
Mean number of vehichles in owner occupied houses
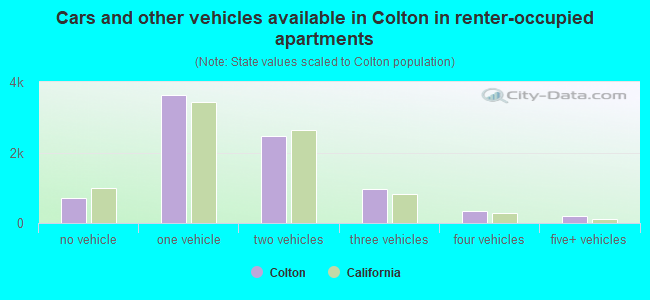
Median number of vehichles in renter occupied houses
Mean number of vehichles in renter occupied houses
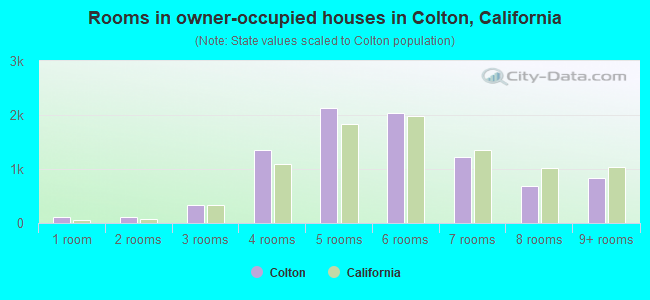
Rooms in owner-occupied houses - 1 room (%)
Rooms in owner-occupied houses - 2 rooms (%)
Rooms in owner-occupied houses - 3 rooms (%)
Rooms in owner-occupied houses - 4 rooms (%)
Rooms in owner-occupied houses - 5 rooms (%)
Rooms in owner-occupied houses - 6 rooms (%)
Rooms in owner-occupied houses - 7 rooms (%)
Rooms in owner-occupied houses - 8 rooms (%)
Rooms in owner-occupied houses - 9+ rooms (%)
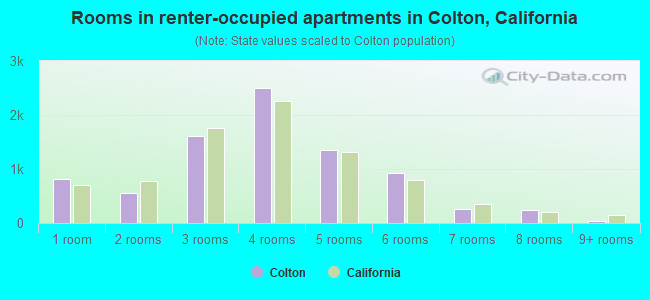
Rooms in renter-occupied houses - 1 room (%)
Rooms in renter-occupied houses - 2 rooms (%)
Rooms in renter-occupied houses - 3 rooms (%)
Rooms in renter-occupied houses - 4 rooms (%)
Rooms in renter-occupied houses - 5 rooms (%)
Rooms in renter-occupied houses - 6 rooms (%)
Rooms in renter-occupied houses - 7 rooms (%)
Rooms in renter-occupied houses - 8 rooms (%)
Rooms in renter-occupied houses - 9+ rooms (%)
Bedrooms in owner-occupied houses - no bedrooms (%)
Bedrooms in owner-occupied houses - 1 bedroom (%)
Bedrooms in owner-occupied houses - 2 bedrooms (%)
Bedrooms in owner-occupied houses - 3 bedrooms (%)
Bedrooms in owner-occupied houses - 4 bedrooms (%)
Bedrooms in owner-occupied houses - 5+ bedrooms (%)
Bedrooms in renter-occupied houses - no bedrooms (%)
Bedrooms in renter-occupied houses - 1 bedroom (%)
Bedrooms in renter-occupied houses - 2 bedrooms (%)
Bedrooms in renter-occupied houses - 3 bedrooms (%)
Bedrooms in renter-occupied houses - 4 bedrooms (%)
Bedrooms in renter-occupied houses - 5+ bedrooms (%)
Vehicles available in owner-occupied houses - no vehicle available (%)
Vehicles available in owner-occupied houses - 1 vehicle available(%)
Vehicles available in owner-occupied houses - 2 Vehicles available (%)
Vehicles available in owner-occupied houses - 3 Vehicles available (%)
Vehicles available in owner-occupied houses - 4 Vehicles available (%)
Vehicles available in owner-occupied houses - 5+ Vehicles available (%)
Vehicles available in renter-occupied houses - no vehicle available (%)
Vehicles available in renter-occupied houses - 1 vehicle available (%)
Vehicles available in renter-occupied houses - 2 Vehicles available (%)
Vehicles available in renter-occupied houses - 3 Vehicles available (%)
Vehicles available in renter-occupied houses - 4 Vehicles available (%)
Vehicles available in renter-occupied houses - 5+ Vehicles available (%)
Housing units in structures - 1, detached (%)
Housing units in structures - 1, attached (%)
Housing units in structures - 2 (%)
Housing units in structures - 3 or 4 (%)
Housing units in structures - 5 to 9 (%)
Housing units in structures - 10 to 19 (%)
Housing units in structures - 20 to 49 (%)
Housing units in structures - 50 or more (%)
Housing units in structures - Mobile home (%)
Housing units in structures - Boat, RV, van, etc. (%)
Housing units in structures - Owners - 1, detached (%)
Housing units in structures - Owners - 1, attached (%)
Housing units in structures - Owners - 2 (%)
Housing units in structures - Owners - 3 or 4 (%)
Housing units in structures - Owners - 5 to 9 (%)
Housing units in structures - Owners - 10 to 19 (%)
Housing units in structures - Owners - 20 to 49 (%)
Housing units in structures - Owners - 50 or more (%)
Housing units in structures - Owners - Mobile home (%)
Housing units in structures - Owners - Boat, RV, van, etc. (%)
Housing units in structures - Renters - 1, detached (%)
Housing units in structures - Renters - 1, attached (%)
Housing units in structures - Renters - 2 (%)
Housing units in structures - Renters - 3 or 4 (%)
Housing units in structures - Renters - 5 to 9 (%)
Housing units in structures - Renters - 10 to 19 (%)
Housing units in structures - Renters - 20 to 49 (%)
Housing units in structures - Renters - 50 or more (%)
Housing units in structures - Renters - Mobile home (%)
Housing units in structures - Renters - Boat, RV, van, etc. (%)
House/condo owner moved in on average (years ago)
Renter moved in on average (years ago)
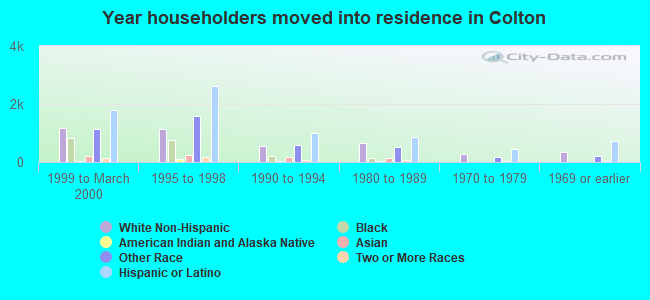
Year householder moved into unit - Moved in 1999 to March 2000 (%)
Year householder moved into unit - Moved in 1999 to March 2000 (%) - White
Year householder moved into unit - Moved in 1999 to March 2000 (%) - Black or African American
Year householder moved into unit - Moved in 1999 to March 2000 (%) - Asian
Year householder moved into unit - Moved in 1999 to March 2000 (%) - Hispanic or Latino
Year householder moved into unit - Moved in 1999 to March 2000 (%) - American Indian and Alaska Native
Year householder moved into unit - Moved in 1999 to March 2000 (%) - Multirace
Year householder moved into unit - Moved in 1999 to March 2000 (%) - Other Race
Year householder moved into unit - Moved in 1995 to 1998 (%)
Year householder moved into unit - Moved in 1995 to 1998 (%) - White
Year householder moved into unit - Moved in 1995 to 1998 (%) - Black or African American
Year householder moved into unit - Moved in 1995 to 1998 (%) - Asian
Year householder moved into unit - Moved in 1995 to 1998 (%) - Hispanic or Latino
Year householder moved into unit - Moved in 1995 to 1998 (%) - American Indian and Alaska Native
Year householder moved into unit - Moved in 1995 to 1998 (%) - Multirace
Year householder moved into unit - Moved in 1995 to 1998 (%) - Other Race
Year householder moved into unit - Moved in 1990 to 1994 (%)
Year householder moved into unit - Moved in 1990 to 1994 (%) - White
Year householder moved into unit - Moved in 1990 to 1994 (%) - Black or African American
Year householder moved into unit - Moved in 1990 to 1994 (%) - Asian
Year householder moved into unit - Moved in 1990 to 1994 (%) - Hispanic or Latino
Year householder moved into unit - Moved in 1990 to 1994 (%) - American Indian and Alaska Native
Year householder moved into unit - Moved in 1990 to 1994 (%) - Multirace
Year householder moved into unit - Moved in 1990 to 1994 (%) - Other Race
Year householder moved into unit - Moved in 1980 to 1989 (%)
Year householder moved into unit - Moved in 1980 to 1989 (%) - White
Year householder moved into unit - Moved in 1980 to 1989 (%) - Black or African American
Year householder moved into unit - Moved in 1980 to 1989 (%) - Asian
Year householder moved into unit - Moved in 1980 to 1989 (%) - Hispanic or Latino
Year householder moved into unit - Moved in 1980 to 1989 (%) - American Indian and Alaska Native
Year householder moved into unit - Moved in 1980 to 1989 (%) - Multirace
Year householder moved into unit - Moved in 1980 to 1989 (%) - Other Race
Year householder moved into unit - Moved in 1970 to 1979 (%)
Year householder moved into unit - Moved in 1970 to 1979 (%) - White
Year householder moved into unit - Moved in 1970 to 1979 (%) - Black or African American
Year householder moved into unit - Moved in 1970 to 1979 (%) - Asian
Year householder moved into unit - Moved in 1970 to 1979 (%) - Hispanic or Latino
Year householder moved into unit - Moved in 1970 to 1979 (%) - American Indian and Alaska Native
Year householder moved into unit - Moved in 1970 to 1979 (%) - Multirace
Year householder moved into unit - Moved in 1970 to 1979 (%) - Other Race
Year householder moved into unit - Moved in 1969 or earlier (%)
Year householder moved into unit - Moved in 1969 or earlier (%) - White
Year householder moved into unit - Moved in 1969 or earlier (%) - Black or African American
Year householder moved into unit - Moved in 1969 or earlier (%) - Asian
Year householder moved into unit - Moved in 1969 or earlier (%) - Hispanic or Latino
Year householder moved into unit - Moved in 1969 or earlier (%) - American Indian and Alaska Native
Year householder moved into unit - Moved in 1969 or earlier (%) - Multirace
Year householder moved into unit - Moved in 1969 or earlier (%) - Other Race
Housing units lacking complete plumbing facilities (%)
Housing units lacking complete kitchen facilities (%)
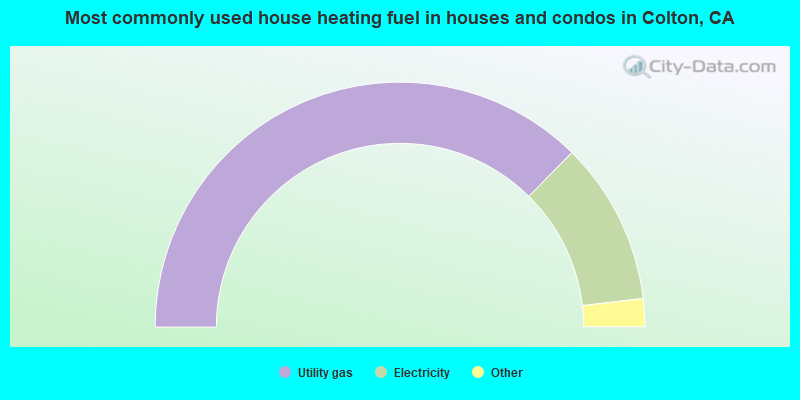
House heating fuel used in houses and condos - Utility gas (%)
House heating fuel used in houses and condos - Bottled, tank, or LP gas (%)
House heating fuel used in houses and condos - Electricity (%)
House heating fuel used in houses and condos - Fuel oil, kerosene, etc. (%)
House heating fuel used in houses and condos - Coal or coke (%)
House heating fuel used in houses and condos - Wood (%)
House heating fuel used in houses and condos - Solar energy (%)
House heating fuel used in houses and condos - Other fuel (%)
House heating fuel used in houses and condos - No fuel used (%)
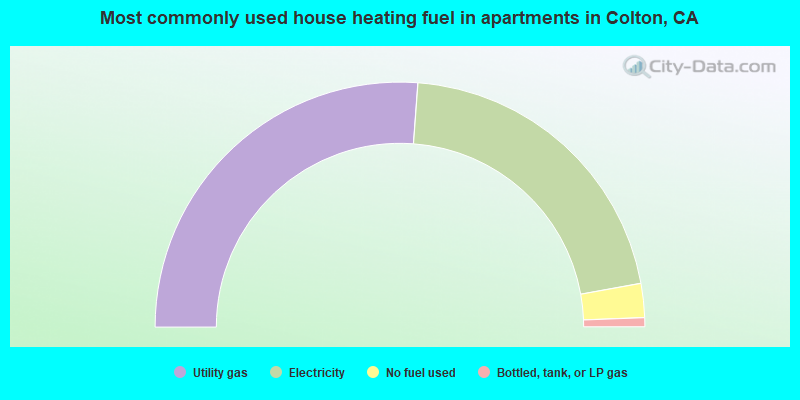
House heating fuel used in apartments - Utility gas (%)
House heating fuel used in apartments - Bottled, tank, or LP gas (%)
House heating fuel used in apartments - Electricity (%)
House heating fuel used in apartments - Fuel oil, kerosene, etc. (%)
House heating fuel used in apartments - Coal or coke (%)
House heating fuel used in apartments - Wood (%)
House heating fuel used in apartments - Solar energy (%)
House heating fuel used in apartments - Other fuel (%)
House heating fuel used in apartments - No fuel used (%)
Latest news about housing in Colton, CA collected exclusively by city-data.com from local newspapers, TV, and radio stations
Median year house/condo built: 1979Median year apartment built: 1976Household type by relationship:
Households: 54,282
Male householders: 8,715 (1,596 living alone ), Female householders: 8,125 (1,360 living alone )7,955 spouses (7,929 opposite-sex spouses ), 1,055 unmarried partners , (936 opposite-sex unmarried partners ), 18,746 children (18,105 natural , 199 adopted , 442 stepchildren ), 2,364 grandchildren , 1,239 brothers or sisters , 1,798 parents , 112 foster children , 2,194 other relatives , 1,599 non-relatives In group quarters: 376
Size of family households: 3,971 2-persons , 3,416 3-persons , 2,709 4-persons , 1,673 5-persons , 903 6-persons , 545 7-or-more-persons .
Size of nonfamily households: 2,926 1-person , 841 2-persons , 51 3-persons , 12 4-persons , 13 6-persons .
6,556 married couples with children. single-parent households (736 men , 3,211 women ).
45.8% of residents of Colton speak English at home. of residents speak Spanish at home (66% speak English very well , 17% speak English well , 10% speak English not well , 6% don't speak English at all ).of residents speak other Indo-European language at home (69% speak English very well , 23% speak English well , 2% speak English not well , 7% don't speak English at all ).of residents speak Asian or Pacific Island language at home (69% speak English very well , 24% speak English well , 7% speak English not well ).of residents speak other language at home (42% speak English very well , 34% speak English well , 23% speak English not well ).
Foreign born population: 11,414 (21.0%)of them are naturalized citizens )
Median number of rooms in houses and condos:
Median number of rooms in apartments
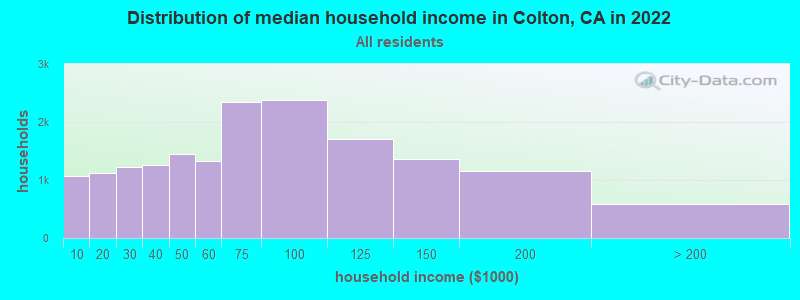
Colton, CA household income distribution 1,068 Less than $10,0001,129 $10,000 to $19,9991,223 $20,000 to $29,9991,261 $30,000 to $39,9991,442 $40,000 to $49,9991,322 $50,000 to $59,9992,351 $60,000 to $74,9992,382 $75,000 to $99,9991,715 $100,000 to $124,9991,364 $125,000 to $149,9991,153 $150,000 to $199,999583 $200,000 or more
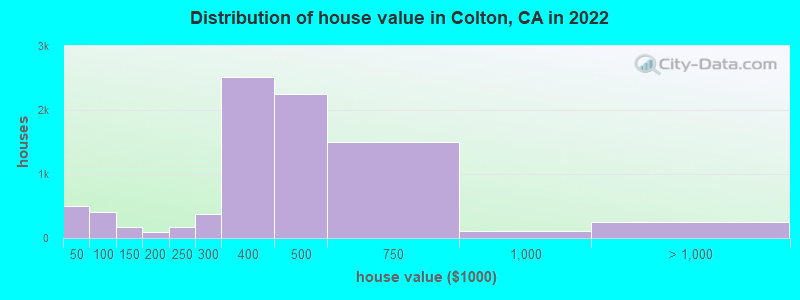
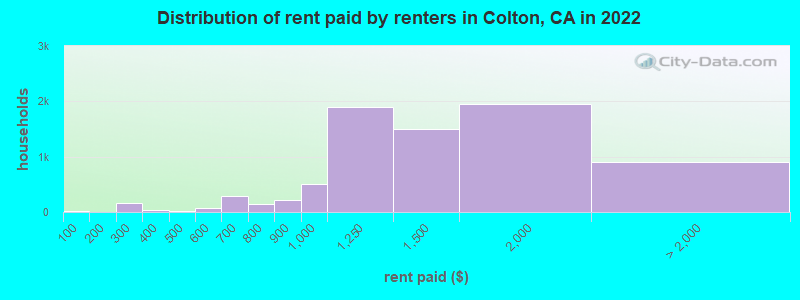
Home value of owner - occupied houses in 2022 in Colton, CA 79 Less than $10,00039 $10,000 to $14,99920 $15,000 to $19,99948 $20,000 to $24,99934 $25,000 to $29,99922 $30,000 to $34,99939 $35,000 to $39,999222 $40,000 to $49,99938 $50,000 to $59,99950 $60,000 to $69,99913 $70,000 to $79,99947 $80,000 to $89,99928 $90,000 to $99,999134 $100,000 to $124,99932 $125,000 to $149,99949 $150,000 to $174,99940 $175,000 to $199,999173 $200,000 to $249,999375 $250,000 to $299,9992,507 $300,000 to $399,9992,243 $400,000 to $499,9991,500 $500,000 to $749,999103 $750,000 to $999,999178 $1,000,000 to $1,499,99966 $2,000,000 or moreRent paid by renters in 2022 in Colton, CA 26 Less than $10096 $200 to $24970 $250 to $2998 $300 to $34926 $350 to $39916 $400 to $4496 $450 to $49930 $500 to $54934 $550 to $599219 $600 to $64967 $650 to $69976 $700 to $74975 $750 to $799223 $800 to $899504 $900 to $9991,891 $1,000 to $1,2491,493 $1,250 to $1,4991,953 $1,500 to $1,999415 $2,000 to $2,499233 $2,500 to $2,999256 No cash rent
Percentage of workers working in this county: 80.6%Number of people working at home: 3,003 (12.0% of all workers )
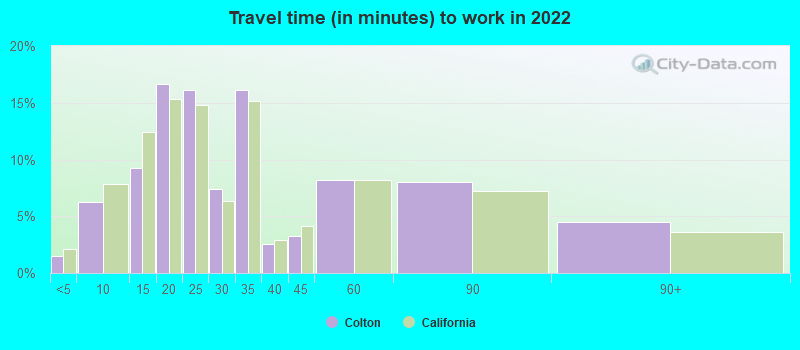
Travel time to work (commute)
Less than 5 minutes: 4445 to 9 minutes: 1,43310 to 14 minutes: 2,67415 to 19 minutes: 4,27620 to 24 minutes: 3,60125 to 29 minutes: 1,52630 to 34 minutes: 3,25835 to 39 minutes: 62740 to 44 minutes: 84745 to 59 minutes: 82560 to 89 minutes: 1,40590 or more minutes: 1,054
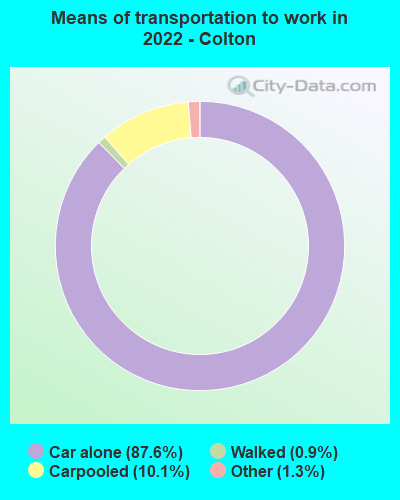
Means of transportation to work:
Drove a car alone: 19,052 (76.3%)Carpooled: 2,363 (9.5%)Bus : 19 (0.1%)Taxi: 319 (1.3%)Walked: 213 (0.9%)Worked at home: 3,003 (12.0%)
Unemployment by race in 2022
Unemployment rate for White non-Hispanic residents 5.6% Males8.9% FemalesUnemployment rate for Black residents 8.9% Males4.1% FemalesUnemployment rate for American Indian and Alaska Native residents 11.1% MalesUnemployment rate for Asian residents 1.9% Males2.5% FemalesUnemployment rate for other race residents 4.6% Males7.4% FemalesUnemployment rate for two or more race residents 4.4% Males4.3% FemalesUnemployment rate for Hispanic or Latino residents 5.6% Males6.0% Females
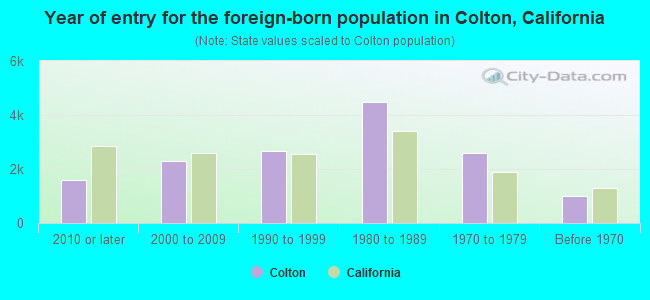
Year of entry for the foreign-born population in Colton, California
1,579 2010 or later 2,293 2000 to 2009 2,649 1990 to 1999 4,467 1980 to 1989 2,605 1970 to 1979 1,011 Before 1970
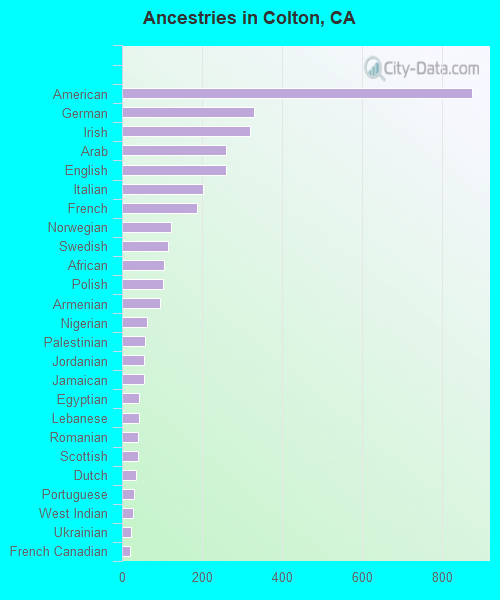
First ancestries reported:
American: 874 (2.3%)
German: 330 (0.9%)
Irish: 320 (0.8%)
Arab: 261 (0.7%)
English: 259 (0.7%)
Italian: 203 (0.5%)
French: 187 (0.5%)
Norwegian: 122 (0.3%)
Swedish: 114 (0.3%)
African: 105 (0.3%)
Polish: 102 (0.3%)
Armenian: 94 (0.2%)
Nigerian: 62 (0.2%)
Palestinian: 58 (0.2%)
Jordanian: 56 (0.1%)
Jamaican: 56 (0.1%)
Egyptian: 43 (0.1%)
Lebanese: 42 (0.1%)
Romanian: 41 (0.1%)
Scottish: 41 (0.1%)
Dutch: 35 (0.09%)
Portuguese: 30 (0.08%)
West Indian: 27 (0.07%)
Ukrainian: 23 (0.06%)
French Canadian: 21 (0.06%)
Ghanaian: 21 (0.06%)
Austrian: 15 (0.04%)
European: 12 (0.03%)
Northern European: 12 (0.03%)
Finnish: 11 (0.03%)
Swiss: 11 (0.03%)
Welsh: 10 (0.03%)
Greek: 8 (0.02%)
Scotch-Irish: 6 (0.02%) Most common places of birth for foreign-born residents (%): Mexico Colton:
70.7% (7,862)California:
37.2% (3,881,193)
Philippines Colton:
5.4% (598)California:
7.8% (818,297)
El Salvador Colton:
4.0% (450)California:
4.2% (440,287)
Guatemala Colton:
3.3% (369)California:
2.8% (290,436)
Place of birth for U.S.-born residents:
This state: 38,285Other state: 3,955Northeast: 625Midwest: 773South: 1,134West: 1,352 93.3% of Colton residents lived in the same house 1 years ago.
Out of people who lived in different houses, 39.5% lived in this county.
Out of people who lived in different counties, 80.4% lived in California.
Colton:
93.3%State average:
88.9%
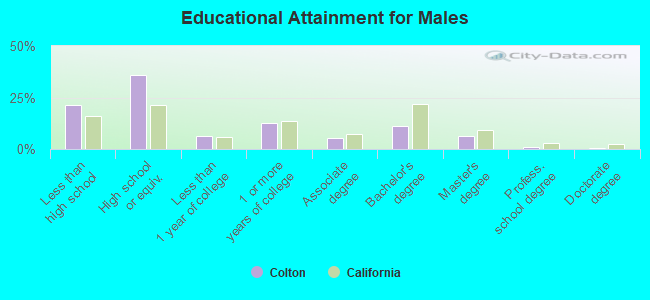
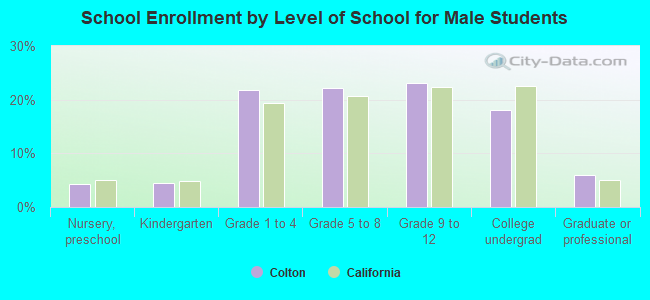
Education attainment for males 25 years and older:
No schooling: 659Nursery to 4th grade: 1985th and 6th grade: 3567th and 8th grade: 4569th grade: 61310th grade: 26511th grade: 49212th grade, no diploma: 788High school graduate (or equivalency): 6,405Less than 1 year of college: 1,130Some college more than 1 year, no degree: 2,232Associate degree: 927Bachelor's degree: 1,962Master's degree: 1,091Professional school degree: 148Doctorate degree: 58
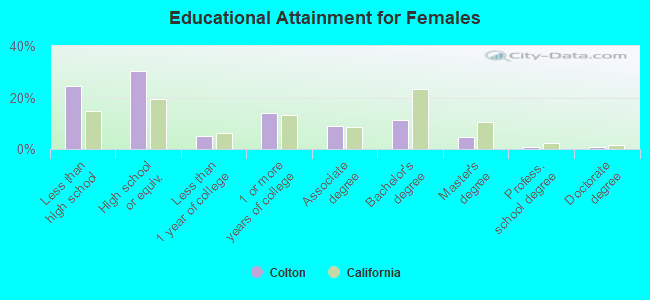
Education attainment for females 25 years and older:
No schooling: 750Nursery to 4th grade: 3275th and 6th grade: 7357th and 8th grade: 4559th grade: 17410th grade: 57111th grade: 66012th grade, no diploma: 535High school graduate (or equivalency): 5,190Less than 1 year of college: 862Some college more than 1 year, no degree: 2,393Associate degree: 1,545Bachelor's degree: 1,924Master's degree: 826Professional school degree: 127Doctorate degree: 140
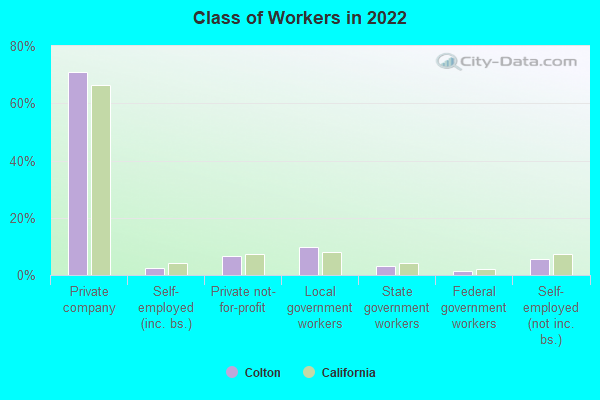
Housing units in structures:
One, detached: 11,012One, attached: 538Two: 2993 or 4: 9395 to 9: 94310 to 19: 1,03620 to 49: 83450 or more: 1,848Mobile homes: 822Boats, RVs, vans, etc.: 70Median worth of mobile homes: $97,463
Housing units lacking complete plumbing facilities in 2022: 2.4%Housing units lacking complete kitchen facilities in 2022: 6.7%House/condo owner moved in on average 15 years ago
Renter moved in on average 3 years ago
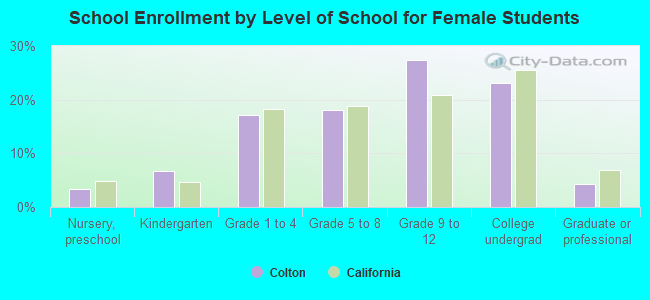
Private vs. public school enrollment:
Students in private schools in grades 1 to 8 (elementary and middle school): 80 Here:
1.4%California:
10.5%
Students in private schools in grades 9 to 12 (high school): 172 Students in private undergraduate colleges: 446 Here:
14.8%California:
15.9%